. 2019 Feb 27;10(3):199.
doi: 10.1038/s41419-019-1406-7.

Regulation of senescence escape by TSP1 and CD47 following chemotherapy treatment

Affiliations

Regulation of senescence escape by TSP1 and CD47 following chemotherapy treatment

Jordan Guillon et al. Cell Death Dis. .

Abstract

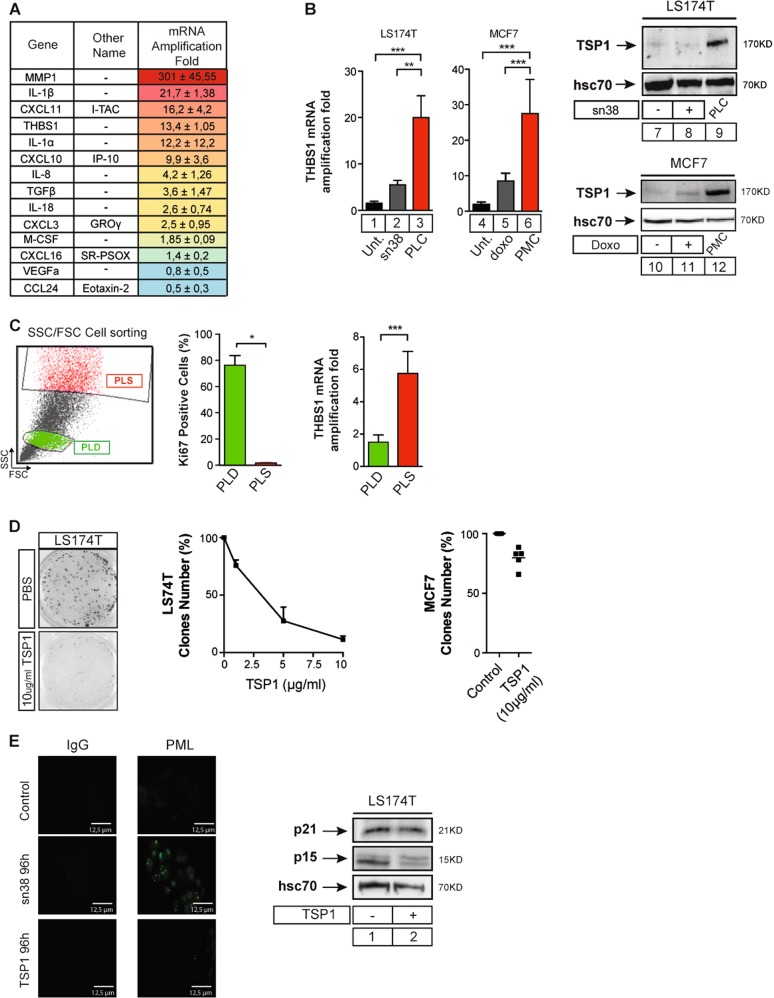
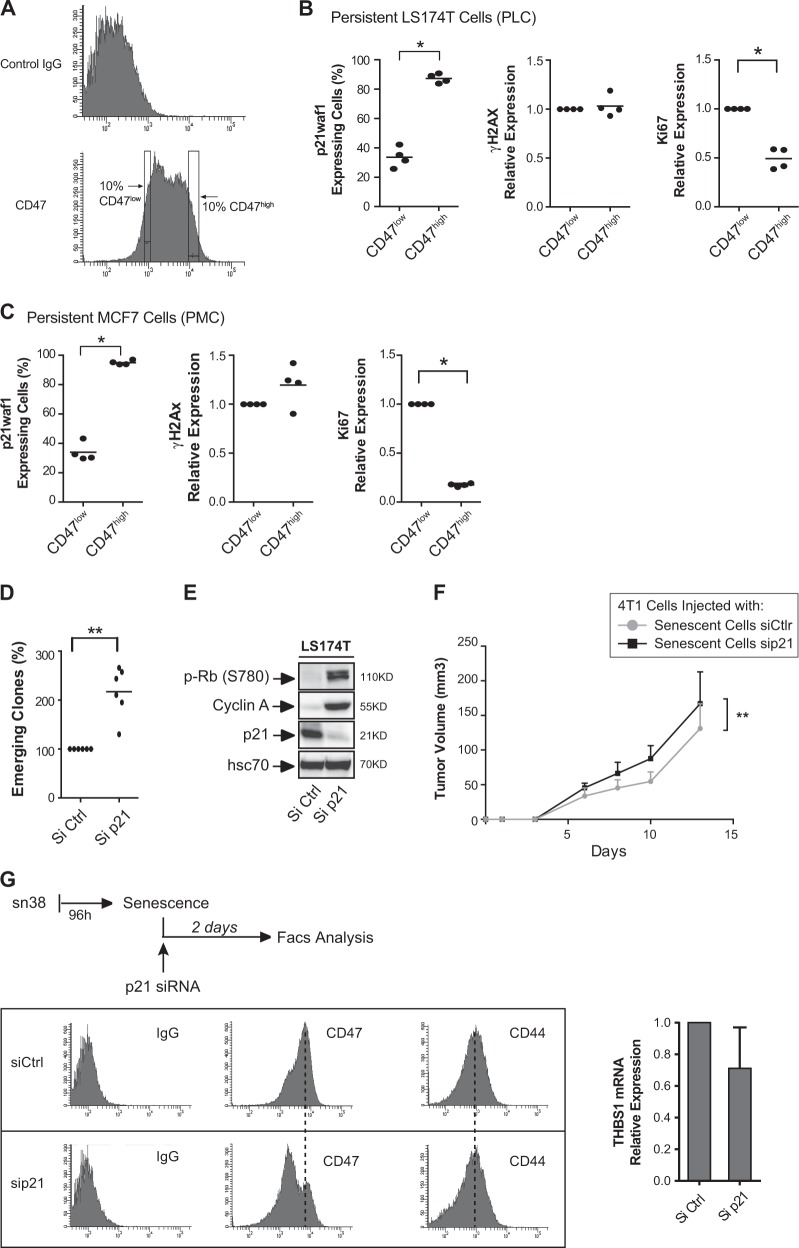
Senescence is a tumor-suppressive mechanism induced by telomere shortening, oncogenes, or chemotherapy treatment. Although it is clear that this suppressive pathway leads to a permanent arrest in primary cells, this might not be the case in cancer cells that have inactivated their suppressive pathways. We have recently shown that subpopulations of cells can escape chemotherapy-mediated senescence and emerge as more transformed cells that induce tumor formation, resist anoikis, and are more invasive. In this study, we characterized this emergence and showed that senescent cells favor tumor growth and metastasis, in vitro and in vivo. Senescence escape was regulated by secreted proteins produced during emergence. Among these, we identified thrombospondin-1 (TSP1), a protein produced by senescent cells that prevented senescence escape. Using SWATH quantitative proteomic analysis, we found that TSP1 can be detected in the serum of patients suffering from triple-negative breast cancer and that its low expression was associated with treatment failure. The results also indicate that senescence escape is explained by the emergence of CD47low cells that express a reduced level of CD47, the TSP1 receptor. The results show that CD47 expression is regulated by p21waf1. The cell cycle inhibitor was sufficient to maintain senescence since its downregulation in senescent cells increased cell emergence. This leads to the upregulation of Myc, which then binds to the CD47 promoter to repress its expression, allowing the generation of CD47low cells that escape the suppressive arrest. Altogether, these results uncovered a new function for TSP1 and CD47 in the control of chemotherapy-mediated senescence.


Conflict of interest statement

The authors declare that they have no conflict of interest.

Figures

Fig. 1
Fig. 1. Colorectal and breast cancer cell lines escape chemotherapy-mediated senescence.
a Following sn38 treatment (5 ng/ml), senescence was detected by the evaluation of p21waf1 expression, SA-β-galactosidase, PML bodies, and ɣ-H2AX staining (n = 3 +/−sd, Mann–Whitney test, *** = p < 0.001). b After treatment, LS174T cells were washed and stimulated with 10% FBS for 7 days to reinduce cell growth. Persistent MCF7 cells (PMC) were generated using the same protocol following doxorubicin treatment. c Images illustrating persistence using colorectal (top) or breast (bottom) cells. SA-β-galactosidase activity staining shows PLC heterogeneity and the presence of proliferating cells (white cells, named PLD) together with senescent cells (blue cells, named PLS). d In vivo evaluation of tumor formation by parental LS174T cells, senescent cells, or PLCs. Senescent and emergent cells were generated as described above. Cells were injected subcutaneously in NOD/SCID mice (five mice were used per condition in each experiment, two-way Anova with a Bonferroni’s multiple comparison test: ns = p > 0.05. ** = p < 0.01). e Quantification of necrosis in tumors arising from parental or PLC cells (n = 6, Mann–Whitney test, * = p < 0.05, see also supplementary Figure 1)
Fig. 2
Fig. 2. Emergence and cell invasion rely on secreted proteins produced by emergent cells.
a Emergent cells were generated as described above and conditioned media (CM) collected after 24 h of serum starvation were supplemented with 10% FBS and applied to untreated parental LS174T cells. The proliferative capacity and survival were quantified by clonogenic tests (n = 6, Kolmogorov–Smirnov test, * = p < 0.05, ** = p < 0.01). b Conditioned media (CM) were collected after 24 h of serum starvation. LS74T cells were treated with sn38 for 4 days and emergence was induced after senescence induction for 7 days using either RPMI or conditioned medium from parental or emergent cells, both supplemented with 10% FBS. CM were added during the treatment and during emergence. Clones were then counted using crystal violet staining (n = 5, normalized to the emergence obtained from the CM of parental cells, Kolmogorov–Smirnov test, ** = p < 0.01). c Analysis of anoikis resistance and enhanced cell transformation using soft agar assays. Conditioned media obtained from parental or emergent cells were supplemented with 20% FBS and mixed with RPMI 0.7% low-melting-point (LMP) agarose to a final concentration of 10% FBS and 0.35% LMP agarose (n = 4). d Invasion assays were performed using Boyden inserts in which Matrigel was deposited at the bottom of the inserts. Conditioned media supplemented with 10% FBS were placed in the bottom chamber. After 72 h, invasive cells were stained with crystal violet (n = 5). e Migration assays were performed using Boyden inserts. Conditioned media obtained from parental or emergent cells supplemented with 3% FBS were placed at the well bottom. After 72 h, migrating cells were stained with crystal violet (n = 4). f CIS was induced in 4T1 cells following doxorubicin treatment (75 ng/ml, 4 days). Senescent cells mixed with untreated cells were injected in mice and tumor growth was monitored in the mammary fat pad of Balb/c mice and compared with controls (six mice were used for untreated 4T1 cells, seven for the mix of 4T1 cells and senescent population, and six for the senescent clones, two-way Anova with a Bonferroni’s multiple comparison test: ** = p < 0.01, p = 0.0018). g Following CIS induction, 4T1 cells were injected in the tail vein, alone or with senescent cells, and metastasis invasion was monitored after 31 days (Mann–Whitney test, * = p < 0.05)
Fig. 3
Fig. 3. Thrombospondin-1 is overexpressed in senescent cells and blocks cell proliferation.
a Quantitative RT-PCR analysis of SASP components in emergent cells (n = 3). Emergent cells were generated as described above and mRNA expression was analyzed as compared with parental cells. b Analysis of TSP1 expression, by RT-QPCR or by western blot in LS174T and MCF7 cells treated or not and after emergence. The presence of TSP1 in the secretome of emergent cells was assessed by western blot assay following serum starvation for 24 h. Intracellular hsc70 expression was evaluated in parallel on the corresponding adherent cells (n = 4, Mann–Whitney test, ** = p < 0.01, *** = p < 0.001). c Cell sorting of dividing PLD and senescent PLS clones according to FSC/SSC and Ki67 parameters (n = 4 +/− sd). The image illustrates the gates that have been used during cell sorting. THBS1 mRNA expression was analyzed by quantitative RT-PCR (n = 5 +/− sd, Mann–Whitney test, * = p < 0.05). d Analysis of LS174T (n = 3 +/− sd) and MCF7 (n = 5) proliferation and survival using clonogenic tests. Cells have been treated with the indicated concentrations of TSP1 or PBS for 7 days. e Following TSP1 stimulation of LS174T cells (10 µg/ml), PML staining and p21 and p15 expressions were evaluated by immunofluorescence and western blot (n = 3)
Fig. 4
Fig. 4. TSP1 prevents senescence escape.
a After CIS induction, cells were transfected with siRNAs targeting TSP1. Transfection efficacy was assessed by evaluating THBS1 mRNA expression using quantitative RT-PCR or western blot analysis. Following a 24-h incubation, 10% FBS was added to induce emergence (Kolmogorov–Smirnov test, ** = p < 0.01, *** = p < 0.001). b After CIS induction, LS174T cells emergence was induced using 10% serum in the presence or absence of TSP1 (10 µg/ml, one representative image out of three experiments). c Cells were incubated for 5 mn with the indicated antibodies (B6H12 blocking antibody that prevents CD47–TSP1 binding, or its non-blocking control 2D3 or IgG1k isotype, all at 10 µg/ml). TSP1 (5 μg/ml) was then added to LS174T cells and clonogenic assays were performed for 7 days before crystal violet staining (n = 4 +/− sd, Kolmogorov–Smirnov test, * = p < 0.05). d Following treatment, emergence was induced using the secretome from PLC cells supplemented with 10% FBS and 10 µg/ml antibodies directed against CD47 or the control IgG1k isotype (n = 3 +/− sd, Kolmogorov–Smirnov test, * = p < 0.05). e MRM analysis and validation of TSP1 levels in patients that relapsed or not following chemotherapy treatment. Samples were obtained before chemotherapy treatment, see supplementary Figure 4 for the description of the clinical trial. f Analysis of platelet count in patients that relapsed or not following chemotherapy treatment
Fig. 5
Fig. 5. CD47 expression is downregulated in emergent clones.
a Analysis of CD47 and Ki67 expressions by immunofluorescence in parental LS174T and MCF7 cells or emergent populations (PLC/PMC). Ki67 staining identifies the clones that have restarted proliferation in the middle of senescent cells (n = 3). b CD47 expression was analyzed by flow cytometry (one experiment representative of three, left part) in LS174T cells that express an shRNA directed against CD47 or a non-targeting control. In parallel, cells have been treated with sn38 to induce senescence and 10% FBS was added after 4 days to allow emergence (n = 3, Kolmogorov–Smirnov test, ** = p < 0.01). c CD47 expression was analyzed by flow cytometry in MCF7 clones expressing an shRNA directed against CD47 or a non-targeting control shRNA. Emergence was induced as described above (n = 3, Kolmogorov–Smirnov test, ** = p < 0.01)
Fig. 6
Fig. 6. p21waf1 inactivation increases emergence and generates CD47low cells.
a Flow cytometry analysis of CD47 expression. The image describes the gating position of the 10% cells corresponding to CD47low or CD47high cells. b, c Following senescence induction, emergence was induced by serum addition. The dividing and senescent clones were then recovered and analyzed by intracellular flow cytometry. p21waf1, KI67, and ɣ-H2AX expressions were quantified by flow cytometry in CD47low cells or CD47high cells and normalized to control IgG staining (n = 4, LS174T (b) and MCF7 (c), Kolmogorov–Smirnov test, * = p < 0.05). d Senescence was induced as decribed above in LS174T cells and after 4 days, cells were transfected with control siRNA or siRNA directed against p21waf1. Ten-percent FBS was added to allow cell emergence (n = 6, Kolmogorov–Smirnov test, ** = p < 0.01). e LS174T cells were treated as above and cell extracts were recovered 2 days after p21waf1 inactivation by siRNA. The expression of the indicated proteins was analyzed by western blot (n = 4). f CIS was induced in 4T1 cells with doxorubicine and after 4 days, cells were transfected with a control siRNA or siRNA directed against p21waf1. After 24 h, cells were mixed with untreated 4T1 cells and injected in Balb/c mice (n = 7, two-way Anova with a Bonferroni’s multiple comparison test: ** = p < 0.01, p = 0.0075). Tumor growth was monitored in the mammary fat pad. g LS174T cells were treated as above to induce senescence and after 4 days, cells were transfected with control siRNA or siRNA directed against p21waf1. CD47 expression was analyzed by flow cytometry after 2 days and CD44 staining was used as a control (n = 4). In parallel, the expression of the THBS1 mRNA was analyzed by RT-QPCR (n = 3 +/− sd)
Fig. 7
Fig. 7. p21waf1 prevents the generation of CD47low cells by downregulating Myc expression.
a Following senescence induction, emergence was induced by serum addition, in the presence or absence of a control siRNA or a siRNA directed against p21 (n = 3). Cell extracts were analyzed by SWATH quantitative proteomics and GSEA analysis. b Validation of Myc induction by western blot analysis following p21 downregulation and emergence (n = 3). c, d Myc expression was downregulated by an inducible shRNA in LS174T cells or by a transient infection of a different shRNA in MCF7 cells. CD47 expression was then analyzed by flow cytometry. One experiment representative of 4 is presented. e Myc was downregulated as described above in LS174T cells and the expression of the CD47 mRNA was evaluated by RT-QPCR (n = 4 +/− sd, Kolmogorov–Smirnov test, * = p < 0.05). f ChIP assays were performed following Myc or Gal4 immunoprecipitation using the indicated primers and analyzed by quantitative PCR (n = 3). Each amplification is also shown compared with the Gal4 signal. g Senescence was induced as decribed above and after 4 days, 10% FBS was added to allow LS174T or MCF7 cell emergence, in the presence of control shRNAs or shRNAs directed against Myc (n = 4, Kolmogorov–Smirnov test, * = p < 0.05). h LS174T or MCF7 cells were infected with a lentivirus expressing an shRNA targeting CD47 or a control sequence. Senescence was then induced as described and after 4 days, 10% FBS was added to allow LS174T or MCF7 cell emergence, in the presence or absence of control shRNA or shRNA directed against Myc (LS174T (n = 4), MCF7 (n = 3), Kolmogorov–Smirnov test, *p < 0.05)
Fig. 8
Fig. 8. Senescence escape in primary fibroblasts generates CD47low cells with a reduced expression of p21waf1.
a Analysis of WI38 proliferation and survival using clonogenic tests (n = 3 +/− sd). Cells have been treated with TSP1 (10 µg/ml) or PBS for 7 days. b WI38 cells have been infected with a lentivirus expressing a K-RasG12V-estrogen receptor chimera. After KRasG12V induction, senescence was evaluated at day 20 by crystal violet staining (left), SA-β-galactosidase activity (middle), and mRNA expression of p15INK4b, p16INK4a, p21waf1, IL1-beta, IL-6, and IL-8 (n = 5 +/− sd). c Senescence was induced in WI38 cells as described above and cells were then infected with a lentivirus expressing the SV40 large T antigen or GFP as a control. Emergence was observed after 1 month. d One week after emergence detection, dividing and senescent WI38 clones were recovered and analyzed by intracellular flow cytometry. p21waf1 and KI-67 expressions were quantified by flow cytometry in CD47low cells or CD47high cells and normalized to control IgG staining (n = 6, n = 4 for KI-67 staining, Kolmogorov–Smirnov test, ** = p < 0.01). One illustrative image of p21waf1 staining is presented

References

    1. Perez-Mancera PA, Young AR, Narita M. Inside and out: the activities of senescence in cancer. Nat. Rev. Cancer. 2014;14:547–558. doi: 10.1038/nrc3773. - DOI - PubMed
    1. te Poele RH, Okorokov AL, Jardine L, Cummings J, Joel SP. DNA damage is able to induce senescence in tumor cells in vitro and in vivo. Cancer Res. 2002;62:1876–1883. - PubMed
    1. Rodier F, et al. Persistent DNA damage signalling triggers senescence-associated inflammatory cytokine secretion. Nat. Cell Biol. 2009;11:973–979. doi: 10.1038/ncb1909. - DOI - PMC - PubMed
    1. Coppe JP, et al. Senescence-associated secretory phenotypes reveal cell-nonautonomous functions of oncogenic RAS and the p53 tumor suppressor. PLoS Biol. 2008;6:2853–2868. doi: 10.1371/journal.pbio.0060301. - DOI - PMC - PubMed
    1. Kuilman T, et al. Oncogene-induced senescence relayed by an interleukin-dependent inflammatory network. Cell. 2008;133:1019–1031. doi: 10.1016/j.cell.2008.03.039. - DOI - PubMed

Publication types