. 2019 Feb 27;10(3):205.
doi: 10.1038/s41419-019-1397-4.

EMT is associated with an epigenetic signature of ECM remodeling genes

Affiliations

EMT is associated with an epigenetic signature of ECM remodeling genes

Paul Peixoto et al. Cell Death Dis. .

Abstract

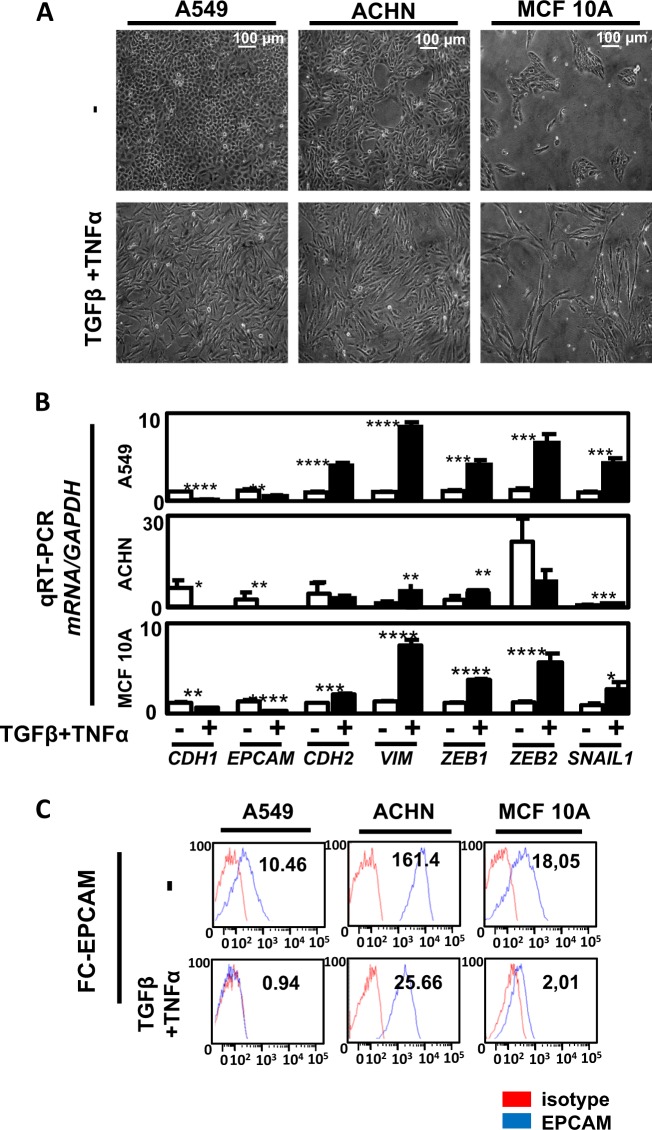
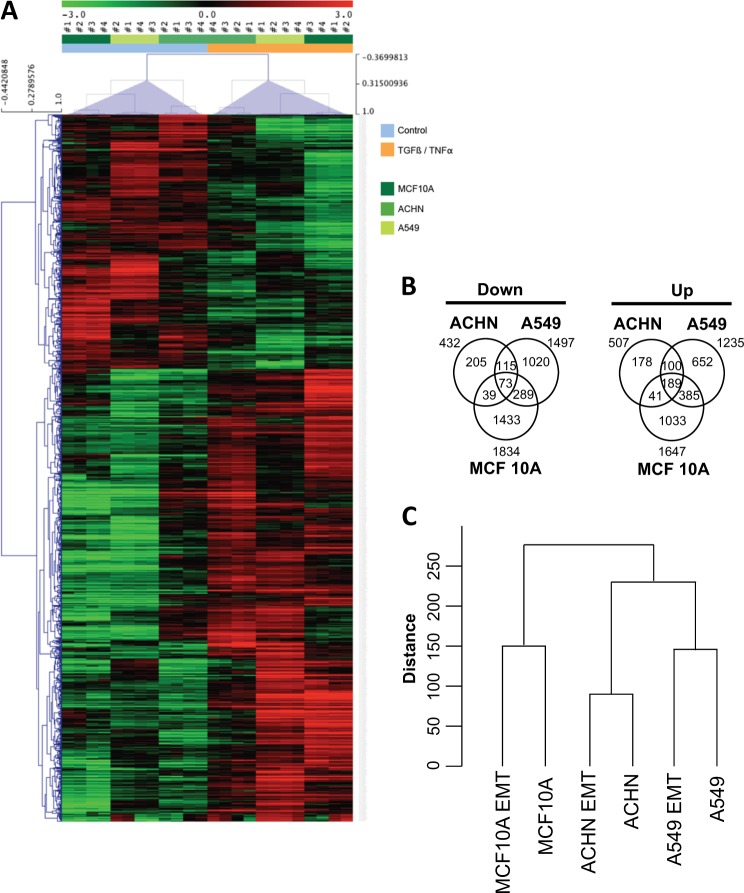
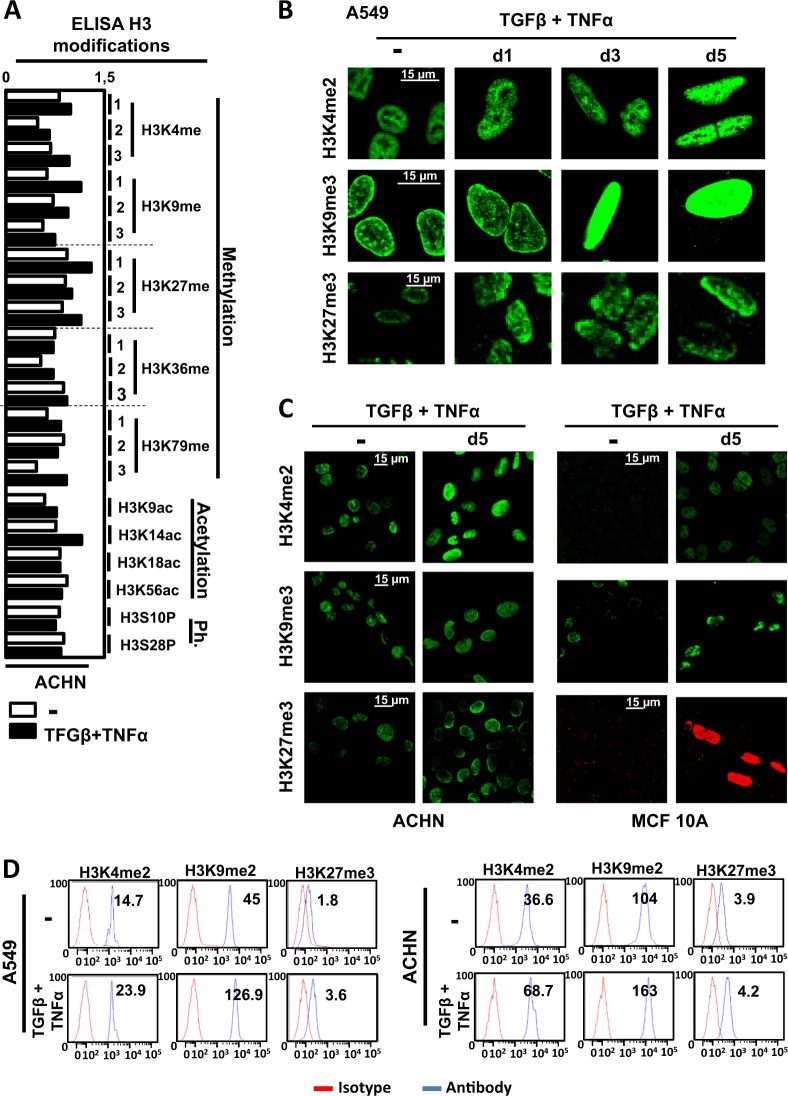
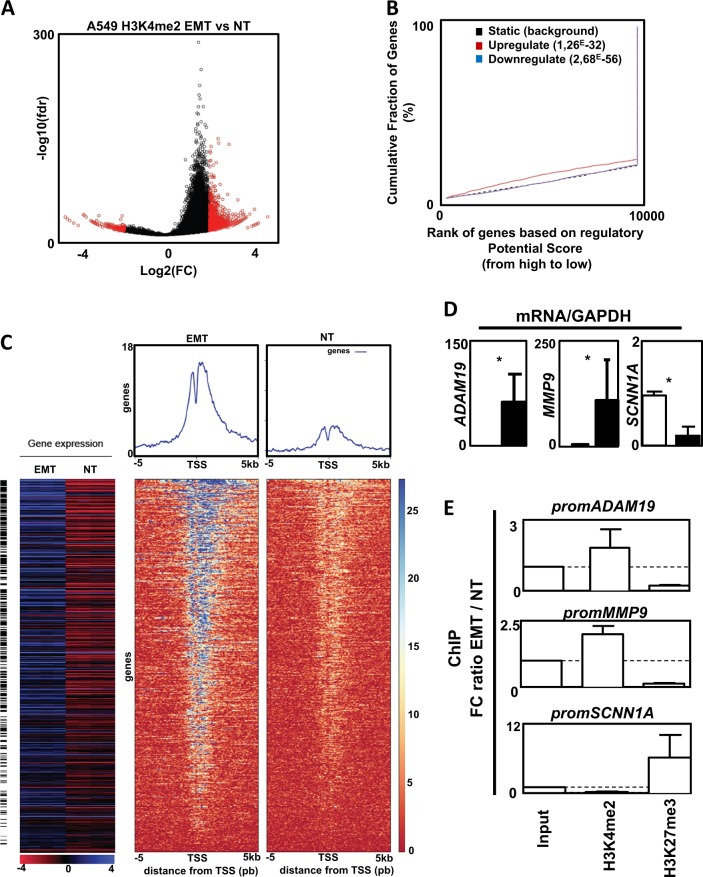
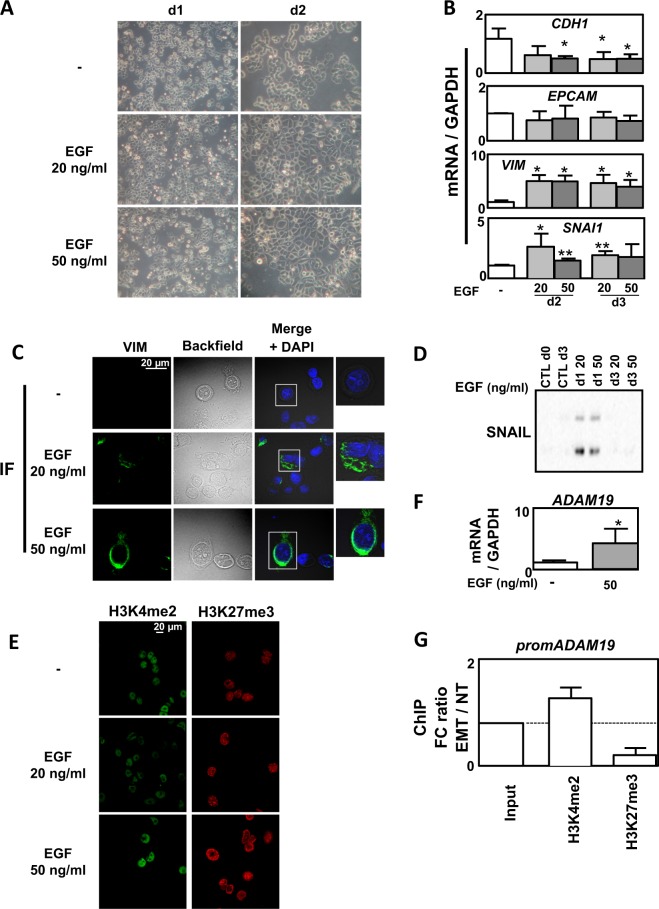
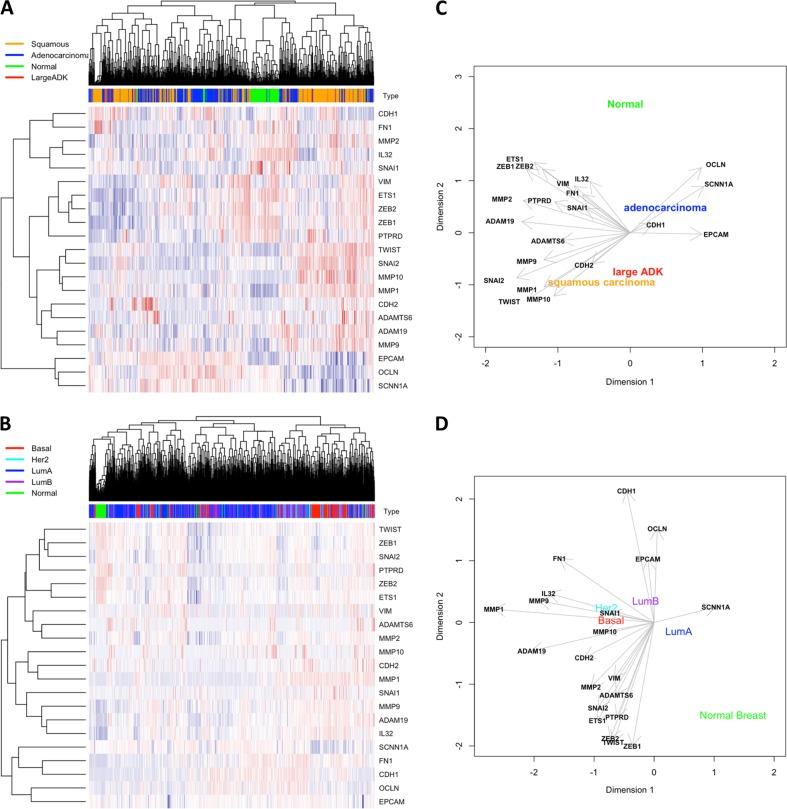
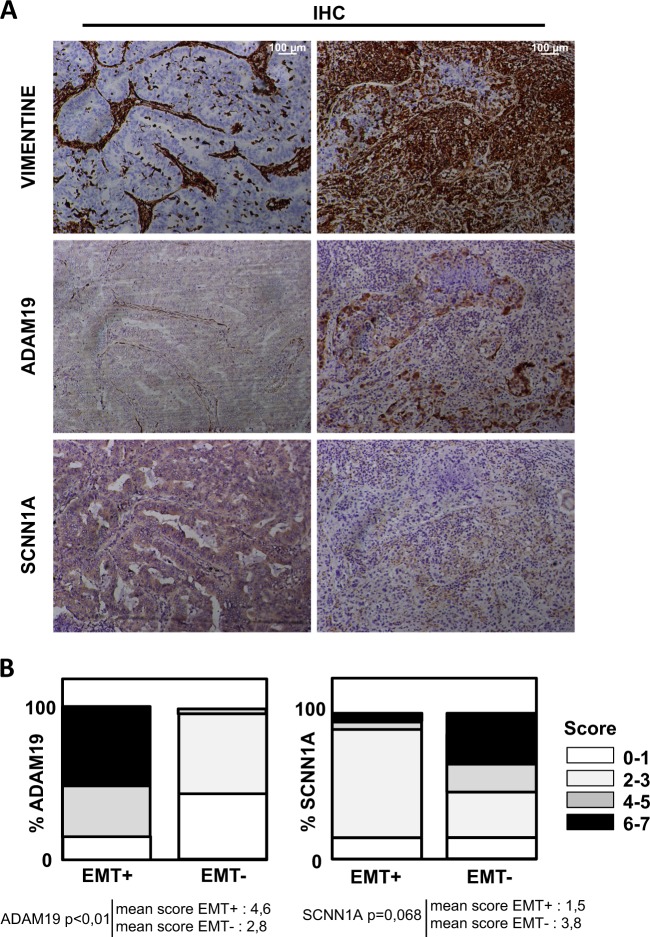
Type III epithelial-mesenchymal transition (EMT) has been previously associated with increased cell migration, invasion, metastasis, and therefore cancer aggressiveness. This reversible process is associated with an important gene expression reprogramming mainly due to epigenetic plasticity. Nevertheless, most of the studies describing the central role of epigenetic modifications during EMT were performed in a single-cell model and using only one mode of EMT induction. In our study, we studied the overall modulations of gene expression and epigenetic modifications in four different EMT-induced cell models issued from different tissues and using different inducers of EMT. Pangenomic analysis (transcriptome and ChIP-sequencing) validated our hypothesis that gene expression reprogramming during EMT is largely regulated by epigenetic modifications of a wide range of genes. Indeed, our results confirmed that each EMT model is unique and can be associated with a specific transcriptome profile and epigenetic program. However, we could select some genes or pathways that are similarly regulated in the different models and that could therefore be used as a common signature of all EMT models and become new biomarkers of the EMT phenotype. As an example, we can cite the regulation of gene-coding proteins involved in the degradation of the extracellular matrix (ECM), which are highly induced in all EMT models. Based on our investigations and results, we identified ADAM19 as a new biomarker of in vitro and in vivo EMT and we validated this biological new marker in a cohort of non-small lung carcinomas.


Figures

Fig. 1
Fig. 1. Transforming growth factor beta (TGFβ)/tumor necrosis factor alpha (TNFα) treatment induced epithelial–mesenchymal transition (EMT) in the A549, ACHN, and MCF10A models.
a A549, ACHN, and MCF10A cells were seeded in 6-multiwell dishes and treated for 5 days with TGFβ and TNFα. The pictures presented are representative of at least three independent experiments. b Expression of epithelial gene markers (CDH1 and EPCAM), mesenchymal gene markers (CDH2, VIMENTIN) and EMT-linked transcription factors (ZEB1, ZEB2, and SNAI1) were measured by quantitative reverse transcriptase–polymerase chain reaction (independent triplicates) in cells treated with or without TGFβ/TNFα for 5 days (white bars: untreated; black bars: TGFβ/TNFα). c A decrease of the epithelial marker EPCAM was confirmed using flow cytometry in the 3 cell lines following treatment with TGFβ/TNFα for 5 days
Fig. 2
Fig. 2. Transcriptome analysis of genes regulated during epithelial–mesenchymal transition induction
a Gene expression was quantified by microarray in A549, ACHN, and MCF10A cells treated with or without transforming growth factor beta/tumor necrosis factor alpha for 5 days (n = 4). b Venn diagrams showing the distribution of upregulated and downregulated genes in the three cell lines. c Cluster dendrogram of the different transcriptomes
Fig. 3
Fig. 3. Transforming growth factor beta (TGFβ)/tumor necrosis factor alpha (TGFβ/TNFα) treatment regulates histone H3 modifications.
a Histones were purified from ACHN cells treated with or without TGFβ/TNFα for 5 days. Twenty-one posttranslational modifications of histone H3 (acetylation: H3K9ac, H3K14ac, H3K18ac, H3K56ac; methylation: H3K4me1, H3K4me2, H3K4me2, H3K9me1, H3K9me2, H3K9me3, H3K27me1, H3K27me2, H3K27me3, H3K36me1, H3K36me2, H3K36me3, H3K79me1, H3K79me2, H3K79me3; and phosphorylation: H3S10P, H3S28P) were quantified using a multiplex enzyme-linked immunosorbent assay. Values were normalized to total H3 content in the same measurement. Each bar represents the mean of two independent measurements and each one was obtained from a mix of two independent histone extractions. b, c Increase staining of H3K4me2, H3K9me3, and H3K27me3 marks observed using immunofluorescence in A549, ACHN, and MCF10A cells treated with or without TGFβ/TNFα for 5 days. Each picture is representative of a typical result from at least three independent experiments. d Increased staining in H3K4me2, H3K9me3, and H3K27me3 marks quantified using flow cytometry in A549, ACHN, and MCF10A cells treated with or without TGFβ/TNFα for 5 days (representative results of at least 3 independent experiments)
Fig. 4
Fig. 4. Chromatin immunoprecipitation (ChIP) and ChIP-seq analysis on the H3K4me2 mark following transforming growth factor beta (TGFβ)/tumor necrosis factor alpha (TGFβ/TNFα) treatment.
a Volcano plot of the 42,076 H3K4me2 merged islands. In red, the regions significantly enriched in TGFβ-/TNFα-treated cells versus non-treated cells. FC: fold change treated versus non-treated. fdr: false discovery rate treated versus non-treated. b Activating and/or repressive function prediction of H3K4me2 in A549 cells. BETA-basic integrates H3K4me2 differentially enriched regions and transcriptome data on TGFβ/TNFα treated cells and non-treated conditions to identify upregulated (red) and downregulated (purple) genes. The dashed line indicates the non-differentially expressed genes as background. Genes are cumulated by the rank on the basis of the regulatory potential score from high to low. p Values represent the significance of difference in the upregulated or downregulated groups compared with the non-differentially expressed group by Kolmogorov–Smirnov test. c Integration of transcriptome and ChIP-seq data for the A549 cell line. Top: heat maps of read coverage from −5 kb to +5 kb around the transcription start site for TGFβ-/TNFα-treated (left) and non-treated (right) conditions. Each line represents an upregulated gene identified by BETA. Genes are ordered according to their increasing rank product. Upper panels: read coverage density plots. Bottom: Corresponding gene expression heat map for treated (n = 4) and non-treated conditions (n = 4). Black lines indicate differentially expressed genes. d Increase expression of ADAM19 and MMP9 and decrease expression of SCNN1A in A549 cells treated with TGFβ/TNFα (mean ± SD of at least 3 independent experiments). e Ratio of fold change (epithelial–mesenchymal transition: TGFβ/TNFα treated A549 versus NT: untreated A549 cells) following ChIP against H3K4me2 and H3K27me3 marks on MMP9, ADAM19, and SCNN1A promoters. Dotted line = 1 (mean ± SEM of at least 3 independent experiments) *p < 0.05
Fig. 5
Fig. 5. Epigenetic regulation in epidermal growth factor (EGF)-induced epithelial–mesenchymal transition (EMT) in MDA-MB-468 cells.
a Representative images showing a change in morphology of MDA-MB-468 cells following 1–5 days of treatment with EGF (20 or 50 ng/ml). b Validation of EMT markers by quantitative reverse transcriptase–polymerase chain reaction (qRT-PCR) in the MDA-MB-468 cell line treated or not with EGF (20 or 50 ng/ml) for 3 days (mean ± SD of at least 3 independent experiments). c Increased change of morphology and intensity of VIMENTIN staining using immunofluorescence (IF) in MDA-MB-468 cells treated or not with EGF (20 or 50 ng/ml) for 3 days. d Increased expression of SNAIL1 in MDA-MB-468 cells treated or not with EGF (20 or 50 ng/ml) for 3 days. e Increased staining in H3K4me2 and H3K27me3 marks using IF in MDA-MB-468 cells treated or not with EGF (20 or 50 ng/ml) for 3 days (representative pictures of 3 independent experiments). f Increased expression of ADAM19 gene quantified by qRT-PCR in MDA-MB-468 cells treated or not with EGF (50 ng/ml) for 3 days. g Ratio of fold change (EMT: EGF treated versus NT: untreated MDA-MB-468 cells) following chromatin immunoprecipitation against H3K4me2 and H3K27me3 marks on the ADAM19 promoter. Dotted line = 1 (mean ± SEM of at least 3 independent experiments) *p < 0.05 and **p < 0.01
Fig. 6
Fig. 6. Large retrospective transcriptome analysis in non-small cell lung cancer (NSCLC) or breast cancer (BC) subtypes.
Expression of MMP9, ADAM19, and SCNN1A mRNA was correlated to epithelial–mesenchymal transition (EMT) markers in a retrospective analysis using published microarrays. Expression of MMP9, ADAM19, SCNN1A was correlated to EMT markers in a retrospective analysis using microarrays downloaded from public datasets. Heat maps were drawn by hierarchical clustering of gene expression in different samples from lung (a) and breast (c) including primary tumors and normal tissue (“Normal”). High transcript levels are marked in red and low levels are marked in blue. Correlations between these markers were plotted in two dimensions after principal component analysis for NSCLC (b) and for BC subtypes (d)
Fig. 7
Fig. 7. Immunohistological (IHC) staining of ADAM19 and SCNN1A in non-small cell lung cancer is associated with epithelial–mesenchymal transition (EMT) status.
a Representative staining of IHC against VIMENTIN, ADAM19, and SCNN1A showing a positive correlation between ADAM19 and VIMENTIN expression levels and an inverse correlation between VIM and SCNN1A in 30 patients tumors classified as EMT-positive. b Top: quantifications of ADAM19 and SCNN1A staining in regard to EMT status (percentage of patients). Bottom: mean of IHC score in VIM+ and VIM tumors

References

    1. Prieto-Garcia E, Diaz-Garcia CV, Garcia-Ruiz I, Agullo-Ortuno MT. Epithelial-to-mesenchymal transition in tumor progression. Med. Oncol. 2017;34:122. doi: 10.1007/s12032-017-0980-8. - DOI - PubMed
    1. Li W, et al. Methylation-mediated silencing of microRNA-211 promotes cell growth and epithelial to mesenchymal transition through activation of the AKT/beta-catenin pathway in GBM. Oncotarget. 2017;8:25167–25176. - PMC - PubMed
    1. Li Q, et al. KDM6B induces epithelial-mesenchymal transition and enhances clear cell renal cell carcinoma metastasis through the activation of SLUG. Int. J. Clin. Exp. Pathol. 2015;8:6334–6344. - PMC - PubMed
    1. Yang F, et al. SET8 promotes epithelial-mesenchymal transition and confers TWIST dual transcriptional activities. EMBO J. 2012;31:110–123. doi: 10.1038/emboj.2011.364. - DOI - PMC - PubMed
    1. Gemmill RM, et al. ZEB1-responsive genes in non-small cell lung cancer. Cancer Lett. 2011;300:66–78. doi: 10.1016/j.canlet.2010.09.007. - DOI - PMC - PubMed

Publication types

MeSH terms

Substances