. 2019 Feb 27;10(1):963.
doi: 10.1038/s41467-019-08831-9.

An atlas of the aging lung mapped by single cell transcriptomics and deep tissue proteomics

Affiliations

An atlas of the aging lung mapped by single cell transcriptomics and deep tissue proteomics

Ilias Angelidis et al. Nat Commun. .

Abstract

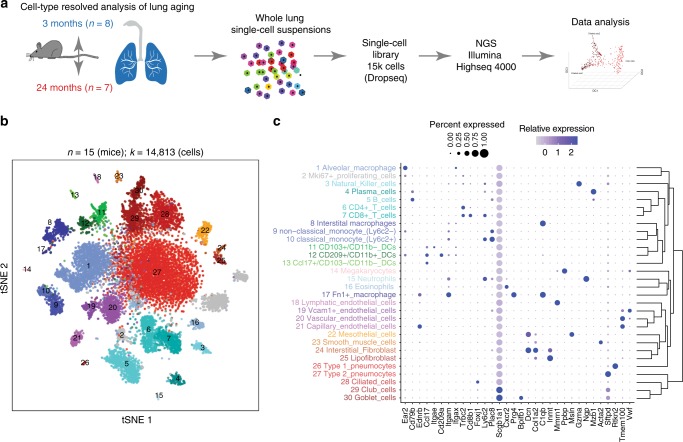
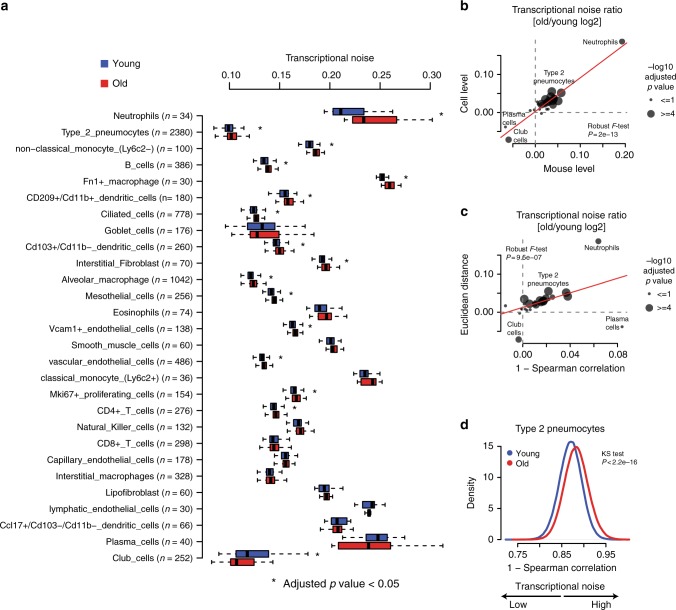
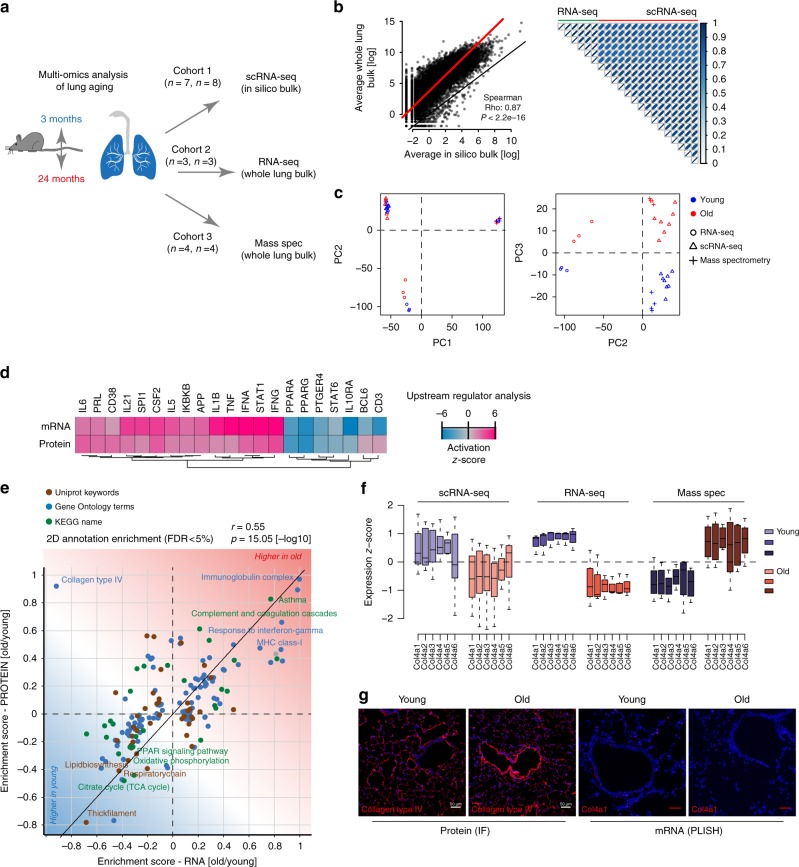
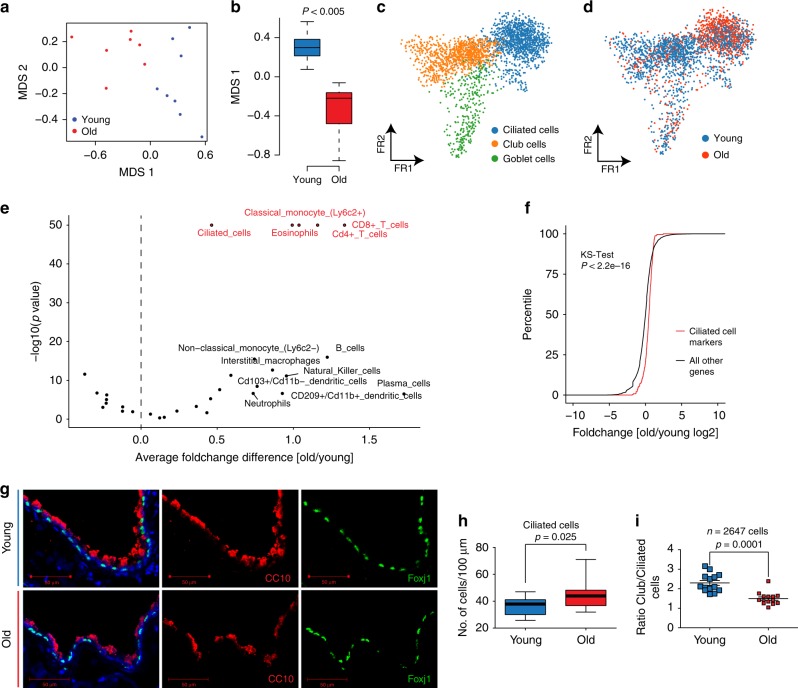
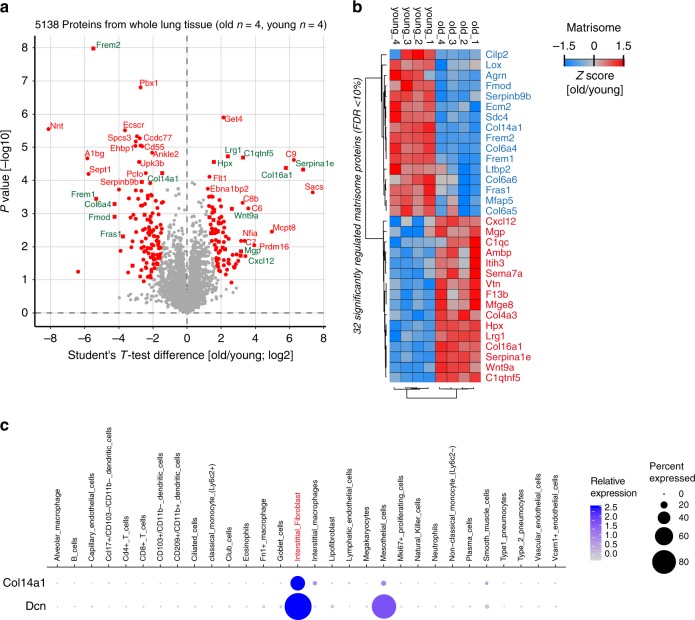
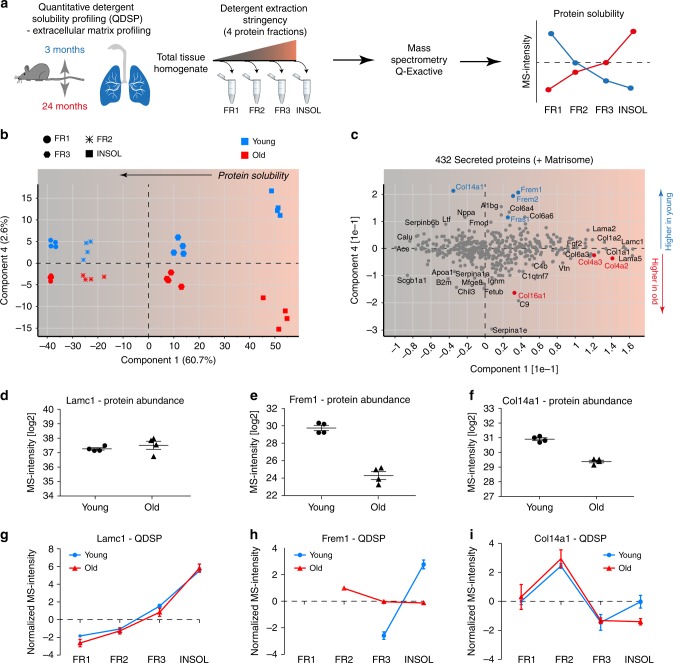
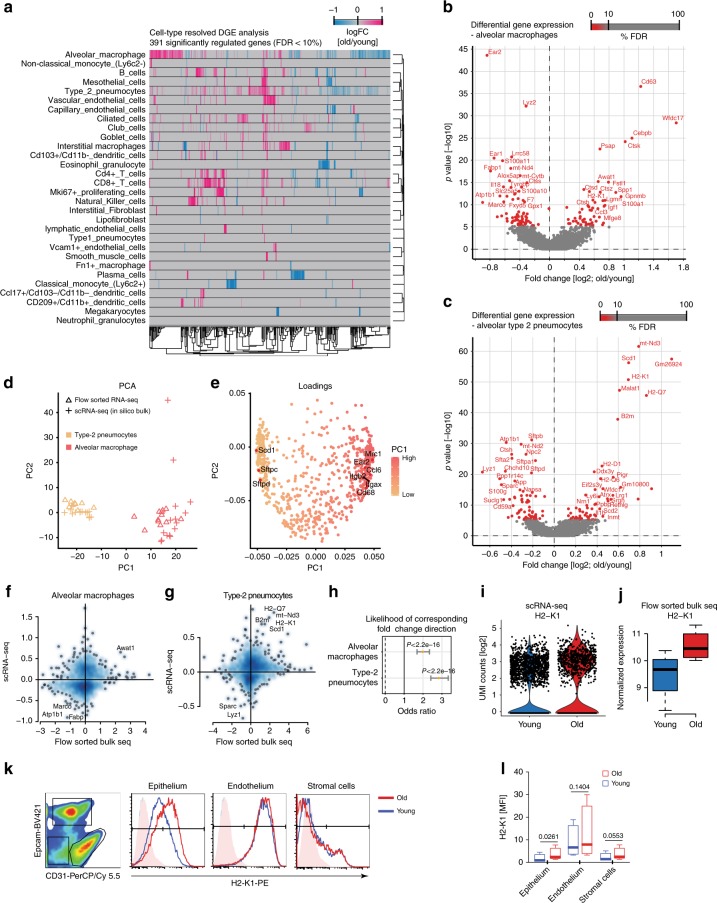
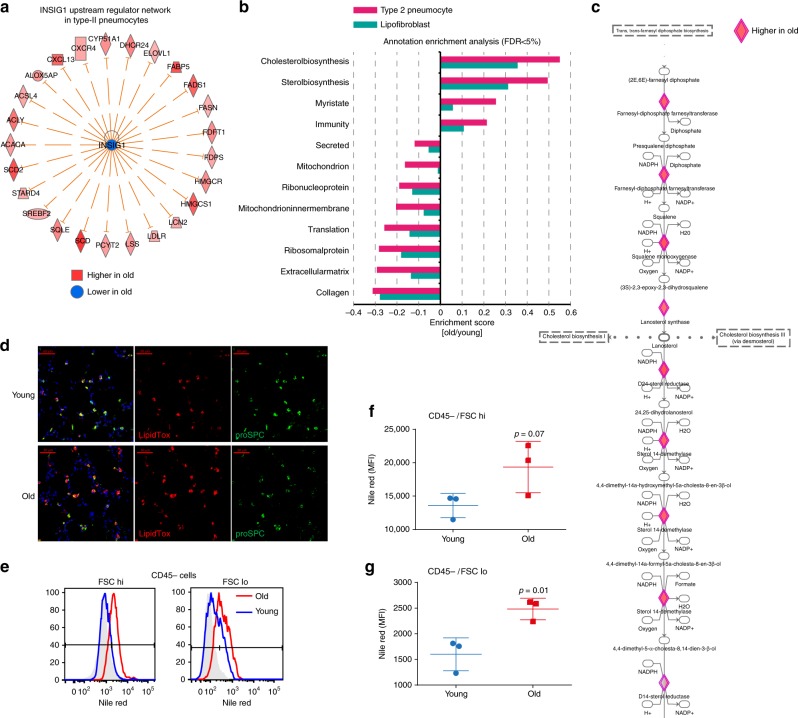
Aging promotes lung function decline and susceptibility to chronic lung diseases, which are the third leading cause of death worldwide. Here, we use single cell transcriptomics and mass spectrometry-based proteomics to quantify changes in cellular activity states across 30 cell types and chart the lung proteome of young and old mice. We show that aging leads to increased transcriptional noise, indicating deregulated epigenetic control. We observe cell type-specific effects of aging, uncovering increased cholesterol biosynthesis in type-2 pneumocytes and lipofibroblasts and altered relative frequency of airway epithelial cells as hallmarks of lung aging. Proteomic profiling reveals extracellular matrix remodeling in old mice, including increased collagen IV and XVI and decreased Fraser syndrome complex proteins and collagen XIV. Computational integration of the aging proteome with the single cell transcriptomes predicts the cellular source of regulated proteins and creates an unbiased reference map of the aging lung.


Conflict of interest statement

The authors declare no competing interests.

Figures

Fig. 1
Fig. 1
A single-cell atlas of mouse lung reveals major cell-type identities. a Experimental design—whole lung single-cell suspensions of young and old mice were analyzed using the Dropseq workflow. b The t-distributed stochastic neighbor embedding (tSNE) visualization shows unsupervised transcriptome clustering, revealing 30 distinct cellular identities. c The dotplot shows (1) the percentage of cells expressing the respective selected marker gene using dot size and (2) the average expression level of that gene based on unique molecular identifier (UMI) counts. Rows represent hierarchically clustered cell types, demonstrating similarities of transcriptional profiles
Fig. 2
Fig. 2
Most cell types show increased transcriptional noise with aging. a Boxplot illustrates transcriptional noise by age and cell type for the indicated number of cells. For all boxplots, the box represents the interquartile range, the horizontal line in the box is the median, and the whiskers represent 1.5 times the interquartile range. Blue and red colors indicate young and old cells, respectively. Asterisk indicates significant changes (Wilcoxon’s rank sum test, adjusted p value < 0.05). Cell types are ordered by decreasing transcriptional noise ratio between old and young cells. b Scatterplot shows the log2 ratio of transcriptional noise between old and young samples as calculated using mouse averages (n = 15) and single cells on the X and Y axes, respectively. c Scatterplot depicts the log2 ratio of transcriptional noise between old and young samples as calculated using 1–Spearman correlation and the Euclidean distance between cells on the X and Y axes, respectively. For both panels, the size of the dots corresponds to the negative log10 adjusted p value of the cell type-resolved differential transcriptional noise test and the red lines correspond to the robust linear model regression fit. d As an example, the distribution of 1–Spearman correlation coefficients between all pairs of young and old cells is shown for type-2 pneumocytes. Larger values represent increased transcriptional noise. Blue and red colors indicate young and old samples
Fig. 3
Fig. 3
Multi-omic data integration uncovers uncoupled regulation of RNA and protein. a Experimental design—three independent cohorts of young and old mice were analyzed by single-cell RNA-sequencing (scRNA-seq), bulk RNA-seq, and mass spectrometry-driven proteomics respectively. b On the left, gene expression profiles from whole lung bulk samples (n = 6) and in silico bulk samples (n = 15) were averaged and plotted on X and Y axes, respectively. Red and black lines indicate linear model fit and the diagonal. On the right, correlation heatmap shows Pearson's correlation between all bulk and in silico bulk samples. c Normalized bulk (RNA-seq) and in silico bulk (scRNA-seq) data were merged with proteome data (mass spectrometry) and quantile normalized. The first two principal components show clustering by data modality. The third principal component separates young from old samples across all three data modalities. Blue and red colors indicate young and old samples, respectively. d Gene expression and protein abundance fold changes were used to predict upstream regulators that are known to drive gene expression responses similar to the ones experimentally observed. Upstream regulators could be cytokines or transcription factors. The color-coded activation z-score illustrates the prediction of increased or decreased activity upon aging. e The scatter plot shows the result of a two-dimensional annotation enrichment analysis based on fold changes in the transcriptome (x-axis) and proteome (y-axis), which resulted in a significant positive correlation of both datasets. Types of databases used for gene annotation are color coded as depicted in the legend. f Expression of collagen IV genes in the in silico bulk (scRNA-seq), bulk (RNA-seq), and proteome (mass spec) experiments, respectively. The box represents the interquartile range, the horizontal line in the box is the median, and the whiskers represent 1.5 times the interquartile range. g Immunofluorescence image of collagen type IV using confocal microscopy at ×25 magnification and proximity ligation in situ hybridization (PLISH) staining of Col4a1 mRNA. Note the increased fluorescence intensity of the protein around vessels in old mice along with the decreased mRNA expression (scale bar: 50 µm)
Fig. 4
Fig. 4
Cell-type deconvolution reveals increase of ciliated cells in airways of old mice. a The multidimensional scaling (MDS) plot shows the mouse-wise euclidean distances of cell-type proportions for the two age groups. b The box plot shows the significant difference in the multidimensional scaling component 1 of cell-type proportions between young (n = 8) and old (n = 7). The box represents the interquartile range, the horizontal line in the box is the median, and the whiskers represent 1.5 times the interquartile range. c The Fruchterman–Reingold (FR) embedding of the airway epithelial cells in the dataset reveals distinct clusters of airway cell identity. d The indicated color code shows the distribution of young and old cells to the three clusters presented in (c). Note the increased density of old cells in the ciliated cell cluster. e The volcano plot shows negative log10 enrichment p values of cell-type marker signatures in the differential expression results of the bulk RNA-seq data from young and old mice. f The empirical density plot shows significant enrichment for ciliated cell-type marker genes (red line) compared to all other genes (black line) in the distribution of fold changes derived from the bulk differential expression analysis. g Club and ciliated cells were stained using a CC10 and Foxj1 antibody respectively (scale bar: 50 µm). h The boxplot depicts the quantification of ciliated cells from counting a total of 2647 club and ciliated cells in 14 individual airways of n = 2 mice of each indicated age group. i Ratio of ciliated to club cells in 14 individual airways of two mice for each indicated age group. The p values are derived from an unpaired, two-tailed t-test using Welch’s correction
Fig. 5
Fig. 5
Single-cell RNA-sequencing (scRNA-seq) predicts cellular origin of age-dependent protein alterations. a Proteins regulated with a false discovery rate < 10% are highlighted in red in the volcano plot showing the indicated fold changes and p values derived from t-test statistic. Matrisome proteins are labeled with green gene names. b The z-score values of 32 significantly regulated extracellular matrix proteins were grouped by unsupervised hierarchical clustering (Pearson's correlation). c The dot plot shows mRNA expression specificity of Col14a1 and its binding partner Decorin (Dcn) in the scRNA-seq data
Fig. 6
Fig. 6
Proteome-wide detergent solubility profiling reveals changes in the extracellular matrix (ECM) architecture. a Experimental design—extraction of proteins from whole lung homogenates with increasing detergent stringency results in four distinct protein fractions, which are analyzed by mass spectrometry (MS). b The projections of a principal component analysis (PCA) of 432 proteins with the annotation ‘secreted' in the Uniprot and/or Matrisome database separate the four protein fractions, indicated by symbol shape, in component 1 and the age groups, as indicated by color, in component 4. c The loadings of the PCA are shown. df Relative differences in MS intensity (abundance) of the indicated proteins. gi The normalized MS intensity across the four protein fractions from differential detergent extraction highlights changes in protein solubility between young and old mice for the indicated proteins. Error bars represent the standard error of the means (n = 4)
Fig. 7
Fig. 7
Single-cell RNA-sequencing (scRNA-seq) enables cell type-resolved differential expression analysis. a Heatmap displays fold changes derived from the cell type-resolved differential expression analysis. Rows and columns correspond to cell types and genes, respectively. Negative fold change values (blue) represent higher expression in young compared to old. Positive fold change values are colored in pink. b, c Volcano plots visualize the differential gene expression results in b alveolar macrophages and c type-2 pneumocytes. X and Y axes show average log2 fold change and −log10 p value, respectively. d Scatterplot illustrates principal component analysis (PCA) of in silico bulk samples of alveolar macrophages and type-2 pneumocytes and the projected flow-sorted bulk samples. Color and shape indicate cell-type identity and data modality. PCA loadings show that well-known marker genes define the first principal component corresponding to cell-type identity (e). Fold changes derived from the flow-sorted bulk samples and the cell type-resolved differential expression analysis are depicted on the X and Y axes respectively for alveolar macrophages (f) and type-2 pneumocytes (g). The likelihood of corresponding fold change direction was highly enriched between the scRNA-seq and flow-sorted bulk data for both cell types (h). X-axis shows the odds ratio including 95% confidence interval. Black vertical line illustrates an odd ratio of one representing equal likelihood. Increased expression of H2-K1 in old compared to young mice was observed for type-2 pneumocytes in the scRNA-seq (i) and flow-sorted bulk (j) data (n = 4 young and n = 4 old mice). For (j), the box represents the interquartile range, the horizontal line in the box is the median, and the whiskers represent 1.5 times the interquartile range. k The indicated cell lineages were gated by flow cytometry as shown in the left panel in a CD31 and Epcam co-staining and evaluated for H2-K1 expression on protein level. The histograms show fluorescence intensity distribution of the H2-K1 cell surface staining for the indicated lineages and age groups. l Boxplot shows mean fluorescence intensity for H2-K1 in the indicated cell types taken from 4 young and 4 old mice. The p values are from a two-sided t-test. The box represents the interquartile range, the horizontal line in the box is the median, and the whiskers represent 1.5 times the interquartile range
Fig. 8
Fig. 8
Aging increases cholesterol biosynthesis in type-2 pneumocytes and lipofibroblasts. a The graph shows genes known to be negatively regulated by Insig1 that were found to be upregulated in type-2 pneumocytes of old mice. b Selected gene categories found to be significantly (false discovery rate (FDR) < 5%) upregulated (positive enrichment scores) or downregulated (negative enrichment scores) in the indicated cell types. c Segment of the cholesterol biosynthesis pathway. Diamond-shaped nodes represent enzymes that were found to be upregulated in type-2 pneumocytes of old mice. The biochemical intermediates are named in between the enzyme nodes. d Immunofluorescence staining of lung sections of young and old mice shows type-2 pneumocytes expressing pro-SPC and neutral lipids marked by LipidTox staining (scale bar: 50 µm). e Quantification of Nile red stainings using flow cytometry. Histograms show flow cytometry analysis of Nile red in aged (red) and young (blue) mice; unstained control is represented in gray. Cells were stratified by size in bins of large (FSC hi) and small (FSC lo) cells using the forward scatter. f, g Nile red mean fluorescence intensity (MFI) quantification across three individual mice for f CD45-negative and forward scatter (FSC) high, and g FSC low cells. The p values are from an unpaired, two-sided t-test

References

    1. Hogan BL, et al. Repair and regeneration of the respiratory system: complexity, plasticity, and mechanisms of lung stem cell function. Cell Stem Cell. 2014;15:123–138. doi: 10.1016/j.stem.2014.07.012. - DOI - PMC - PubMed
    1. Lopez-Otin C, Blasco MA, Partridge L, Serrano M, Kroemer G. The hallmarks of aging. Cell. 2013;153:1194–1217. doi: 10.1016/j.cell.2013.05.039. - DOI - PMC - PubMed
    1. Meiners S, Eickelberg O, Konigshoff M. Hallmarks of the ageing lung. Eur. Respir. J. 2015;45:807–827. doi: 10.1183/09031936.00186914. - DOI - PubMed
    1. Lowery EM, Brubaker AL, Kuhlmann E, Kovacs EJ. The aging lung. Clin. Interv. Aging. 2013;8:1489–1496. - PMC - PubMed
    1. Bailey KL, et al. Aging causes a slowing in ciliary beat frequency, mediated by PKCepsilon. Am. J. Physiol. Lung Cell. Mol. Physiol. 2014;306:L584–L589. doi: 10.1152/ajplung.00175.2013. - DOI - PMC - PubMed

Publication types