. 2019 Feb 27;9(1):2903.
doi: 10.1038/s41598-019-39562-y.

Inactivation of Ppp1r15a minimises weight gain and insulin resistance during caloric excess in female mice

Affiliations

Inactivation of Ppp1r15a minimises weight gain and insulin resistance during caloric excess in female mice

Vruti Patel et al. Sci Rep. .

Abstract

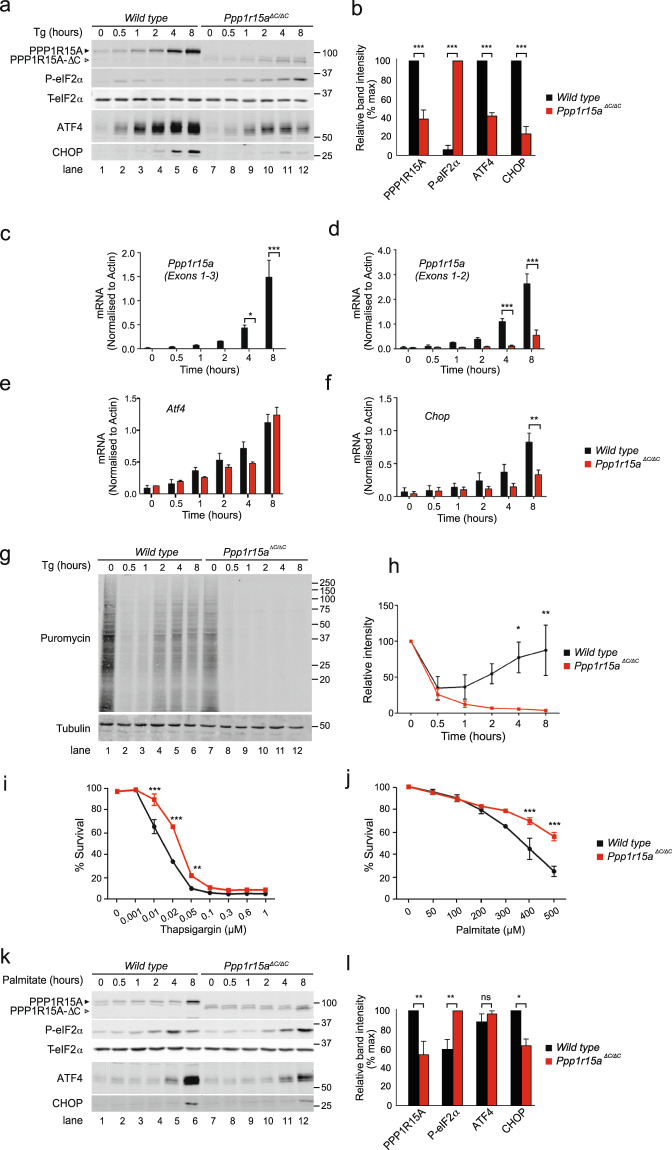
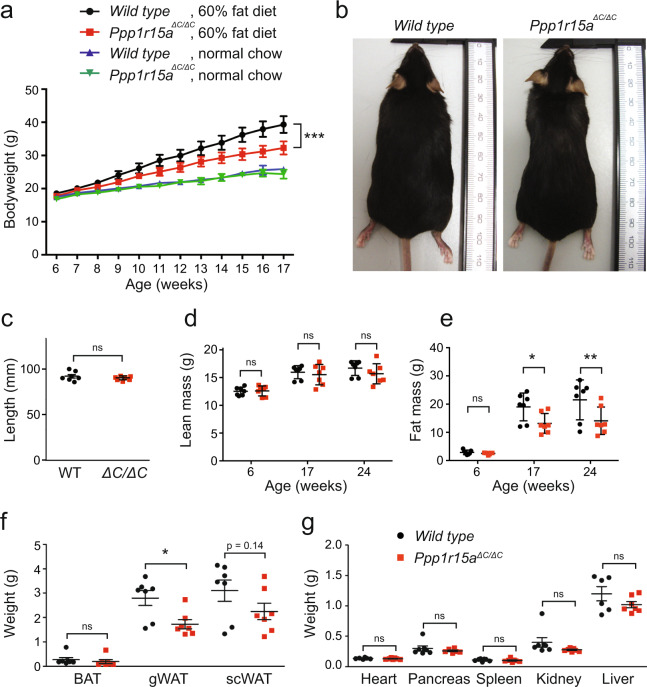
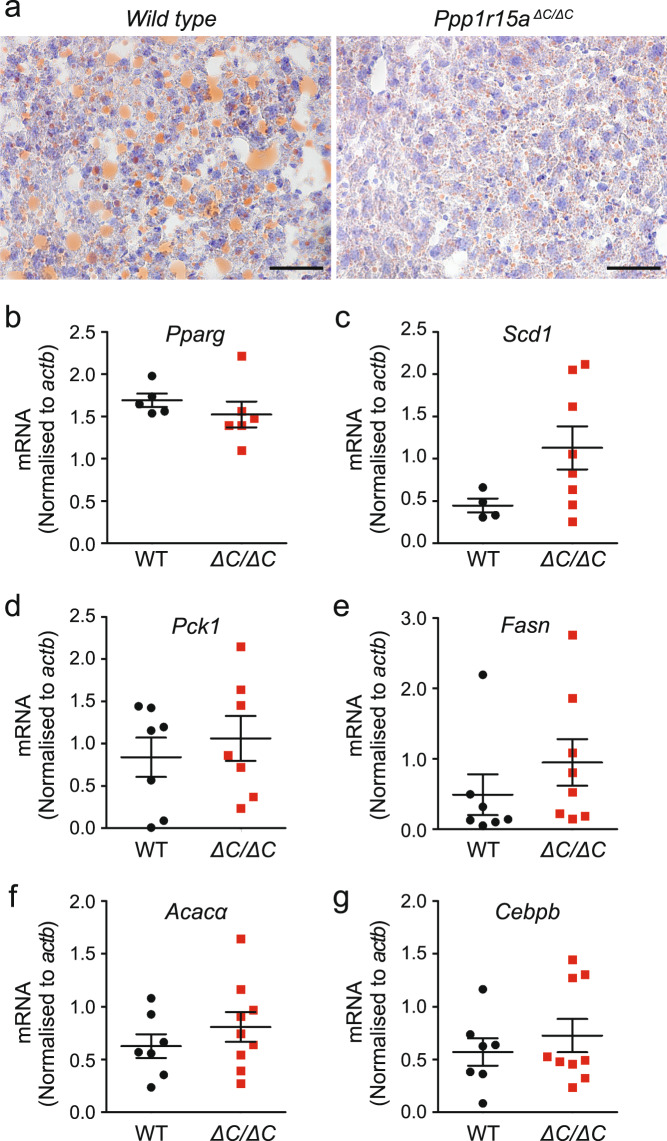
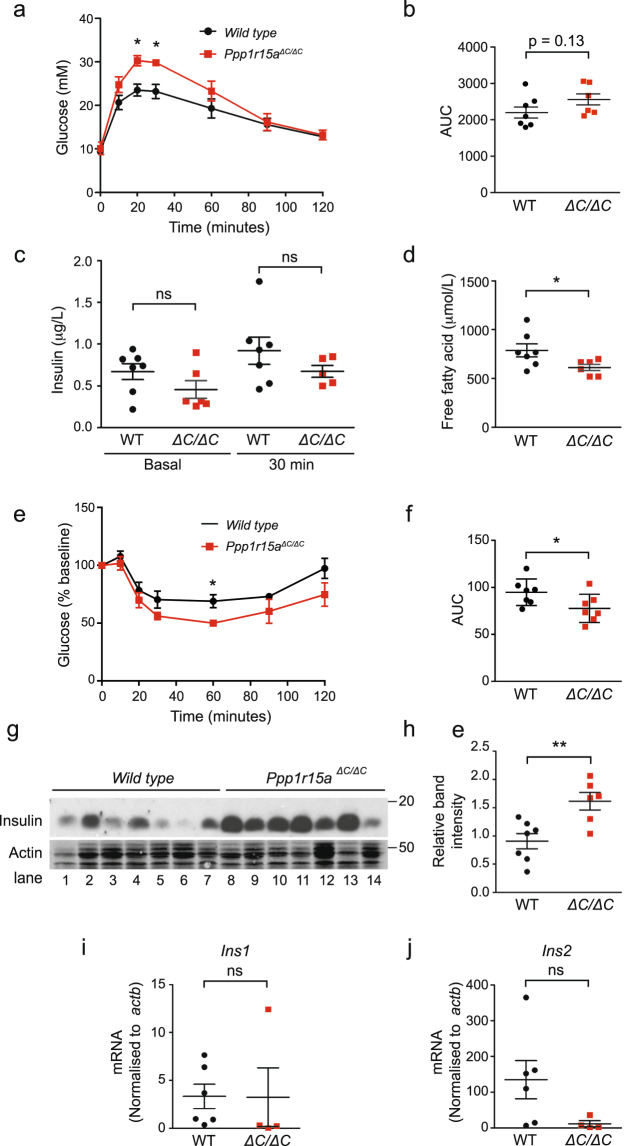
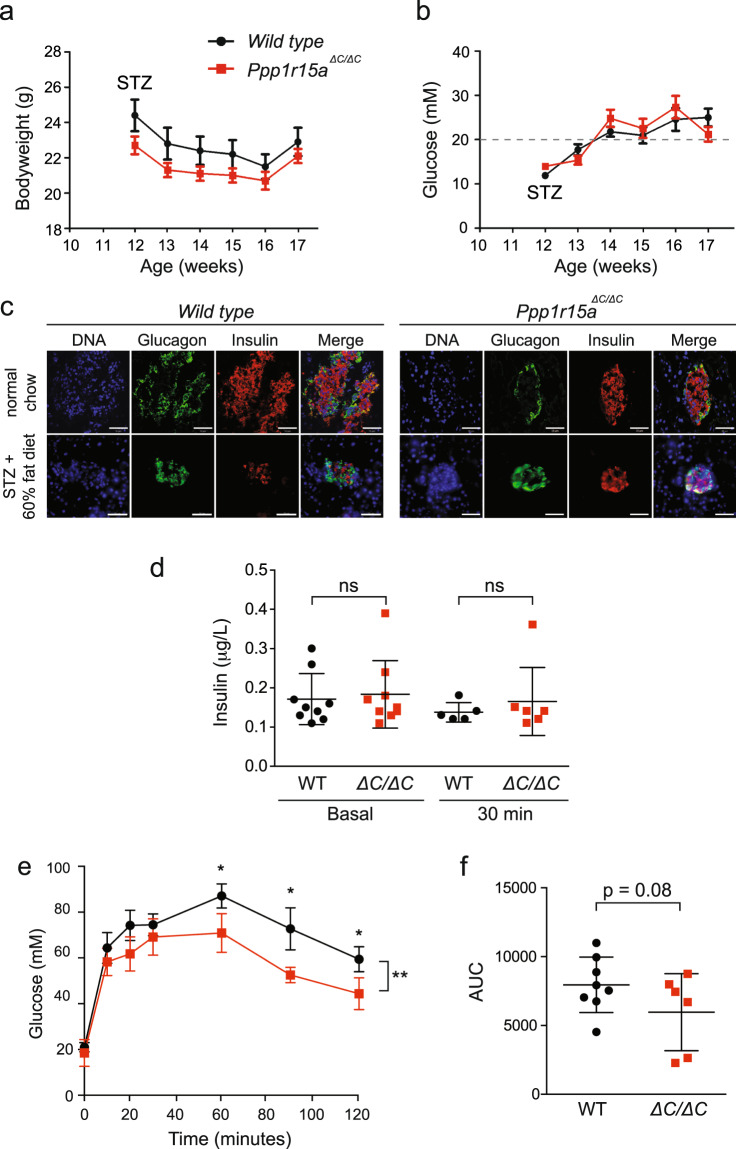
Phosphorylation of the translation initiation factor eIF2α within the mediobasal hypothalamus is known to suppress food intake, but the role of the eIF2α phosphatases in regulating body weight is poorly understood. Mice deficient in active PPP1R15A, a stress-inducible eIF2α phosphatase, are healthy and more resistant to endoplasmic reticulum stress than wild type controls. We report that when female Ppp1r15a mutant mice are fed a high fat diet they gain less weight than wild type littermates owing to reduced food intake. This results in healthy leaner Ppp1r15a mutant animals with reduced hepatic steatosis and improved insulin sensitivity, albeit with a possible modest defect in insulin secretion. By contrast, no weight differences are observed between wild type and Ppp1r15a deficient mice fed a standard diet. We conclude that female mice lacking the C-terminal PP1-binding domain of PPP1R15A show reduced dietary intake and preserved glucose tolerance. Our data indicate that this results in reduced weight gain and protection from diet-induced obesity.


Conflict of interest statement

The authors declare no competing interests.

Figures

Figure 1
Figure 1
Inactivation of PPP1R15A reduces ER stress and protects against lipotoxicity in vitro. (a) Immunoblot for PPP1R15A, phosphorylated eIF2α (P-eIF2α), total eIF2α (T-eIF2α), ATF4 and CHOP in lysates of wild type and Ppp1r15aΔC/ΔC mouse embryonic fibroblasts (MEFs) following treatment with thapsigargin (Tg) 300 nM for indicated times. Proteins of the expected sizes are marked with a solid triangle for PPP1R15A or an open triangle for PPP1R15A-ΔC. Molecular size markers shown in kDa. (b) Quantification of (a) using ImageJ software. N = 3; mean ± SEM; P value calculated by two-way ANOVA. (cf) Wild type and Ppp1r15aΔC/ΔC MEFs were treated with thapsigargin 300 nM for indicated times and RNA was prepared. Ppp1r15a (Exons 1–3), Ppp1r15a (Exons 1–2), Atf4, Chop mRNA were quantified relative to beta-actin by qRT-PCR. N = 3; mean ± SEM; P value calculated by two-way ANOVA. (g) Immnoblot for puromycin (indicating rate of translation) and tubulin in lysates of wild type or Ppp1r15aΔC/ΔC MEFs following treatment with thapsigargin (Tg) 300 nM for indicated times. Ten minutes prior to harvesting, puromycin was added to the culture medium at a final concentration of 10 ng/mL. Molecular size markers shown in kDa. (h) Immunoreactivity to puromycin within lysates served as a marker of protein translation and was quantified using ImageJ software. N = 3; mean ± SEM; P value calculated by two-way ANOVA with Bonferroni post hoc test. Molecular size markers shown in kDa. (i) MTT assays were carried out to measure cell viability of wild type or Ppp1r15aΔC/ΔC MEFs following treatment with the indicated concentrations of thapsigargin for 48 hours. N = 3; mean ± SEM; P value calculated by two-way ANOVA with Bonferroni post hoc test. (j) MTT assays were carried out to measure cell viability of wild type or Ppp1r15aΔC/ΔC MEFs following treatment with the indicated concentrations of palmitate for 48 hours. N = 3; mean ± SEM; P value calculated by two-way ANOVA with Bonferroni post hoc test. (k) Immunoblot for PPP1R15A, P-eIF2α, T-eIF2α, ATF4 and CHOP in lysates of wild type and Ppp1r15aΔC/ΔC mouse embryonic fibroblasts (MEFs) following treatment with palmitate 400 µm for indicated times. Proteins of the expected sizes are marked with a solid triangle for PPP1R15A or an open triangle for PPP1R15A-ΔC. (l) Quantification of (A) using ImageJ software. N = 3; mean ± SEM; P value calculated by two-way ANOVA. ***p < 0.001, **p < 0.01, *p < 0.05.
Figure 2
Figure 2
Inactivation of PPP1R15A reduces weight gain following a 60% high-fat diet in vivo: (a) At 6 weeks of age, wild type and Ppp1r15aΔC/ΔC mice were fed either standard chow diet or 60% high-fat diet and their bodyweights measured. P value calculated by two-way ANOVA. (b) Representative images of wild type and Ppp1r15aΔC/ΔC mice fed a 60% high-fat diet for 18 weeks. (c) Length of each mouse was measured at time of harvest. (d,e) Using time domain nuclear magnetic resonance (TD-NMR), the (d) lean mass, and (e) fat mass of the mice were measured prior to high-fat feeding (6-weeks), during high-fat feeding (17-weeks) and at the end of the study (24-weeks). (f) The wet weights of each adipose tissue were measured at harvest. Brown adipose tissue (BAT); gonadal white adipose tissue (gWAT) and subcutaneous white adipose tissue (scWAT). (g) The organs of each mouse were also harvested at the end of the study and wet weights measured. N = 7; mean plotted ± SEM; unpaired Student’s unpaired t-test used for statistical analysis. ***p < 0.001, **p < 0.01, *p < 0.05.
Figure 3
Figure 3
Ppp1r15aΔC/ΔC mice show reduced hepatic steatosis following high-fat feeding but no changes in expression of hepatic lipogenic enzymes. (a) To determine hepatic liver content, liver dissected from wild type and Ppp1r15aΔC/ΔC mice was frozen in liquid nitrogen. Fifteen-micrometre sections of liver were cut using a cryostat and stained using Oil Red O lipid stain and counterstained with haematoxylin (OROH). Representative images are shown. Scale bar: 50 μm. (bg) RNA was prepared from liver taken from wild type (WT) and Ppp1r15aΔC/ΔC (∆C/∆C) mice fed a high-fat diet for 12 weeks. Pparg, Scd1, Pck1, Fasn, Acaca, and Cebpb mRNA were quantified relative to actb by qRT-PCR. N = 4–9; mean plotted ± SEM; none of the mRNA levels were significantly different by unpaired Student’s unpaired t-test.
Figure 4
Figure 4
Metabolic phenotyping of wild type and Ppp1r15aΔC/ΔC mice indicate reduced food intake following high-fat feeding. (a) Mice were single housed at 17-weeks old and food intake was measured three times a week, for 2-weeks. Following food intake measurements, indirect calorimetry was carried out over 48 hours. Food intake, fat mass gain and energy expenditure were calculated. RNA was prepared from brown adipose tissue taken from wild type (WT) and Ppp1r15aΔC/ΔC (∆C/∆C) mice fed a high-fat diet for 18 weeks. P value calculated by unpaired Student’s t-test. (bd) Pgc1a, Elovl3 and Dio2 mRNA were quantified relative to the geometrical mean of actb, 36b4, 18S and B2M by qRT-PCR referred to as BestKeeper (BK). RNA was prepared from subcutaneous brown adipose tissue taken from wild type and Ppp1r15aΔC/ΔC mice fed a high-fat diet for 18 weeks. (eg) Pgc1a, Elovl3 and Dio2 mRNA were quantified relative to the geometrical mean of actb, 36b4, 18S and B2M by qRT-PCR referred to as BK analysis. RNA was prepared from white adipose tissue taken from wild type and Ppp1r15aΔC/ΔC mice fed a high-fat diet for 18 weeks. (h) RNA was prepared from subcutaneous white adipose tissue taken from wild type and Ppp1r15aΔC/ΔC mice fed a high-fat diet for 18 weeks and Ucp1 mRNA was quantified relative to actb, 36b4, 18S and B2M by qRT-PCR referred to as BK. (i) RNA was prepared from brown adipose tissue taken from wild type and Ppp1r15aΔC/ΔC mice fed a high-fat diet for 18 weeks and Ucp1 mRNA expression was quantified relative to actb, 36b4, 18S and B2M by qRT-PCR and BK analysis. (j) Immunoblot for UCP1 and GAPDH of tissue lysates prepared from brown adipose tissue harvested from wild type and Ppp1r15aΔC/ΔC mice fed a high-fat diet for 18 weeks. Molecular size markers shown in kDa. (k) Quantification of (D) using ImageJ software. N = 4–7, mean band intensity plotted ± SEM; unpaired Student’s t-test used for statistical analysis. (l,m) Indirect calorimetry was also used to measure the (l) respiratory exchange ratio and (m) activity of the mice over 48 hours. N = 7; mean plotted ± SEM; unpaired Student’s t-test used for statistical analysis. ***p < 0.001, *p < 0.05.
Figure 5
Figure 5
Glucose tolerance and insulin tolerance testing of wild type and Ppp1r15aΔC/ΔC mice. (a) At age 22 weeks (16 weeks on high-fat diet), the mice were fasted for 16 hours, after which mice were intraperitoneally injected with 1 g/kg glucose, where the dose used was calculated using the average bodyweight of the full cohort of mice. Glucose levels were then measured at 10, 20, 60, 90 and 120 minutes post- injection. P value was calculated by two-way ANOVA with post hoc Bonferroni test. (b) Quantification of the glucose tolerance test (GTT) carried out using the area under the curve (AUC). (c) Blood samples were collected at 0 minutes (basal), prior to glucose injection and at 30 minutes post-injection. Serum was separated out and measured for insulin. P value calculated by unpaired Student’s t-test. (d) Free fatty acid levels in the basal serum sample were also measured. P value calculated by unpaired Student’s t-test. (e) At age 23 weeks (17 weeks on high-fat diet), the mice were fasted for 4 hours, after which mice were intraperitoneally injected with 0.75 U/kg insulin, where the dose used was calculated using the average bodyweight of the full cohort of mice. Glucose levels were then measured at 10, 20, 60, 90 and 120 minutes post-injection. P value was calculated by two-way ANOVA with post hoc Bonferroni test. (f) Quantification of the insulin tolerance test (ITT) was carried out using the AUC. P value calculated by unpaired Student’s t-test. (g) Immunoblot for insulin and actin in protein lysates prepared from whole pancreas extracted from wild type and Ppp1r15aΔC/ΔC mice fed a high-fat diet for 18 weeks. (h) Quantification of (g) using ImageJ software. P value calculated by unpaired Student’s t-test. Molecular size markers shown in kDa. (ij) Total RNA was extracted from whole pancreas of wild type and Ppp1r15aΔC/ΔC mice fed a high-fat diet for 18 weeks. Ins1 and Ins2 mRNA were quantified relative to actb by qRT-PCR. N = 4–7; mean plotted ± SEM; unpaired Student’s unpaired t-test used for statistical analysis.
Figure 6
Figure 6
Induction of diabetes and measurement of pancreas function following high-fat feeding and streptozotocin treatment in wild type and Ppp1r15aΔC/ΔC mice. (a) Six-week old mice were put on a 60% high-fat diet for six weeks. At age 12 weeks, mice were injected with 50 mg/kg streptozotocin (STZ) on 5 consecutive days. Bodyweights of the mice were recorded for 5 weeks post STZ treatment. (b) Non-fasted blood glucose of the mice was measured for 5 weeks post STZ treatment. Clinical signs of diabetes assessed as mice with blood glucose levels above 20 mM (marked with grey dashed line). (c) Fluorescence microscopy images of pancreas sections taken from wild type and Ppp1r15aΔC/ΔC mice fed either a normal chow diet (top panel) or 60% high-fat diet and streptozotocin treated (bottom panel). Fixed tissue sections were probed with antibodies against glucagon (green) and insulin (red), and counterstained with Hoescht (blue) and imaged by confocal microscopy. Scale bar = 50 µm. (d) Circulating insulin levels of STZ-treated mice fed on a high-fat diet and shown compared to results from Fig. 5c. (e) Glucose tolerance test (GTT) was carried out on 17-week, HFD + STZ treated mice. Mice were fasted overnight, and then injected with 1 g/kg glucose. Blood glucose was measured at 0,10, 20, 30, 60, 90 and 120 minutes. N = 7–9; two-way ANOVA and Bonferroni post-hoc test used for statistical analysis. (f) Quantification of the GTT carried out using the area under the curve (AUC). P value calculated by unpaired Student’s t-test. *p < 0.05.

References

    1. Chambers JE, Marciniak SJ. Cellular mechanisms of endoplasmic reticulum stress signaling in health and disease. 2. Protein misfolding and ER stress. Am J Physiol Cell Physiol. 2014;307:C657–670. doi: 10.1152/ajpcell.00183.2014. - DOI - PubMed
    1. Marciniak SJ, Ron D. Endoplasmic reticulum stress signaling in disease. Physiol Rev. 2006;86:1133–1149. doi: 10.1152/physrev.00015.2006. - DOI - PubMed
    1. Ron D, Walter P. Signal integration in the endoplasmic reticulum unfolded protein response. Nat Rev Mol Cell Biol. 2007;8:519–529. doi: 10.1038/nrm2199. - DOI - PubMed
    1. Delepine M, et al. EIF2AK3, encoding translation initiation factor 2-alpha kinase 3, is mutated in patients with Wolcott-Rallison syndrome. Nat Genet. 2000;25:406–409. doi: 10.1038/78085. - DOI - PubMed
    1. Harding H, et al. Diabetes Mellitus and excocrine pancreatic dysfunction in Perk−/− mice reveals a role for translational control in survival of secretory cells. Mol Cell. 2001;7:1153–1163. doi: 10.1016/S1097-2765(01)00264-7. - DOI - PubMed

Publication types

Substances

LinkOut - more resources