. 2019 Feb 27;9(1):2923.
doi: 10.1038/s41598-019-39634-z.

Quantitative assessment of regional variation in tissue clearing efficiency using optical coherence tomography (OCT) and magnetic resonance imaging (MRI): A feasibility study

Affiliations

Quantitative assessment of regional variation in tissue clearing efficiency using optical coherence tomography (OCT) and magnetic resonance imaging (MRI): A feasibility study

Kwangyeol Baek et al. Sci Rep. .

Abstract

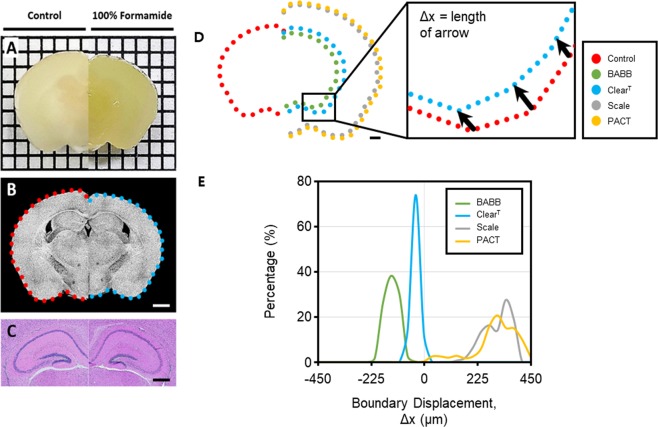
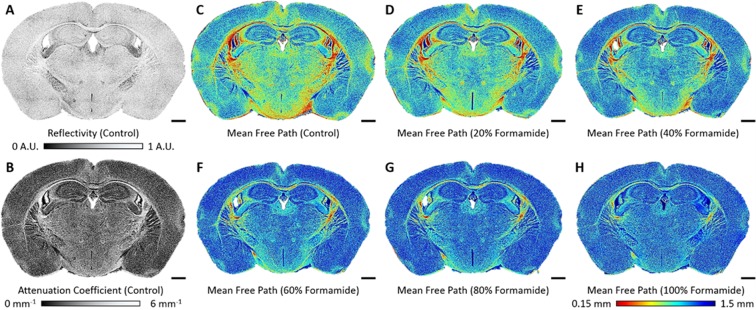
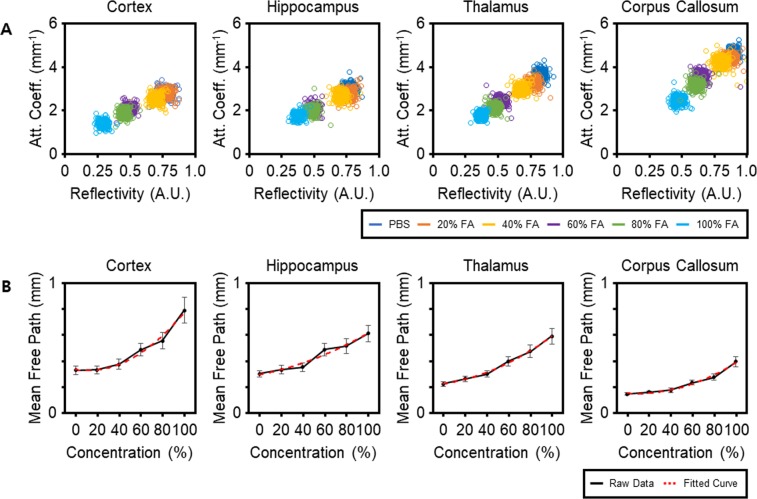
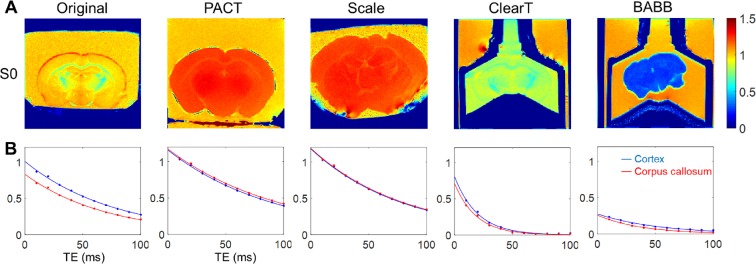
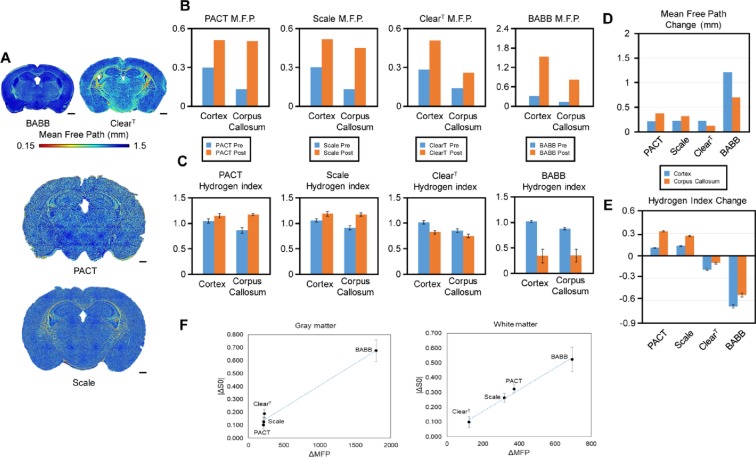
Tissue clearing has gained attention as a pioneering research tool for imaging of large tissue samples. This technique improves light transmission by reducing light scattering within tissues, either by removing lipids or by replacing water with a high refractive index solution. Although various clearing techniques have been developed, quantitative assessments on clearing efficacy depending on tissue properties are rare. In this study, we developed the quantitative mapping of regional clearing efficacy using mean free path in optical coherence tomography (OCT) and proton density in magnetic resonance imaging (MRI), and demonstrated its feasibility in the brain sample with four representative clearing techniques (benzyl alcohol and benzyl benzoate [BABB], ClearT, Scale, and passive CLARITY technique [PACT]). BABB (solvent-based clearing), involving both refractive index matching and lipid removal, exhibited best optical clearing performance with the highest proton density reduction both in gray and white matter. Lipid-removing techniques such as Scale (aqueous hyperhydration) and PACT (hydrogel embedding) showed higher clearing efficiency in white matter than gray matter in accordance with larger proton density increase in white matter. For ClearT (aqueous-based simple immersion), we observed lowest clearing efficiency in the white matter as well as poor lipid removal reflected in low proton density reduction. Our results showed the feasibility of the regional mapping of clearing efficacy and correlating optical transparency and proton density changes using OCT and MRI from existing tissue clearing techniques. This novel quantitative mapping of clearing efficacy depending on tissue types and clearing methods may be helpful in the development of optimized clearing methods for different biological samples.


Conflict of interest statement

The authors declare no competing interests.

Figures

Figure 1
Figure 1
Images of a coronal brain slice (left, control; right, formamide treated) taken by (A) digital camera, (B) optical coherence tomography (OCT), and (C) wide field microscope (hematoxylin and eosin histological staining). In (A), the tick marks represent 2 mm. In (B,C), scale bars represent 2 mm and 1 mm, respectively. (D) Illustration of the overlapped boundaries of brain slices after three different clearing techniques: benzyl alcohol and benzyl benzoate (BABB), ClearT and Scale. Scale bar represents 2 mm. (E) Histogram of the relative tissue volume changes after each of the four clearing techniques.
Figure 2
Figure 2
Visualization of the changes in optical properties as tissue clearing renders brain slices transparent: (A) reflectivity, (B) attenuation coefficient, and (C–H) color map of the MFPs. Scale bars represent 1 mm. A.U., arbitrary units.
Figure 3
Figure 3
Plots illustrating the changes in optical properties varying with the degree of tissue clearing: (A) reflectivity versus attenuation coefficient, and (B) the concentration of clearing solutions versus mean free path (MFP). Each circle in (A) represents the data obtained from a single position within the regions of interest (ROIs). Red dashed lines in (B) are the second-order fitted curves showing the increasing trend of the MFPs. The MFPs were obtained from the averaged OCT signals of the corresponding rectangular ROIs, indicated by the red rectangle for cortex for example, shown in Supplementary Fig. 2B for each region upon ClearT treatment. Values on plots in (B) represent means ± standard deviation (SD). A.U., arbitrary units; FA, formamide; PBS, phosphate buffered saline.
Figure 4
Figure 4
Magnetic resonance imaging (MRI) measurements in the brain samples before and after tissue clearing (Representative samples). (A) Hydrogen density index, i.e., proton density signal normalized to the signal of reference 1.5% agarose gel, reflects the relative water content in the samples. (B) T2 decay characteristics in the cortex and the corpus callosum ROIs. TE, echo time.
Figure 5
Figure 5
Changes in the optical and chemical properties of the brain samples after tissue clearing. (A) Tissue transparency (MFP) across brain regions upon the four different clearing protocols. Scale bars represent 1 mm. (B) MFPs before and after application of each of the four tissue clearing methods. (C) Proton densities before and after application of each of the four tissue clearing methods. (D) Comparison of MFP changes between gray and white matter among the four tissue clearing methods. (E) Comparison of proton density changes between gray and white matter among the four tissue clearing methods. (F) Scatter plot of MFP versus proton density changes. Hydrogen index refers to normalized proton density with respect to the signal measured in the 1.5% agarose gel. Representative ROIs for gray matter and white matter are shown in Supplementary Fig. 4. The values used in the graphs in (C,E,F) represent means ± S.E.M.

References

    1. Dodt H-U, et al. Ultramicroscopy: three-dimensional visualization of neuronal networks in the whole mouse brain. Nat. Methods. 2007;4:331–336. doi: 10.1038/nmeth1036. - DOI - PubMed
    1. Sharpe J, et al. Optical Projection Tomography as a Tool for 3D Microscopy and Gene Expression Studies. Science. 2002;296:541–545. doi: 10.1126/science.1068206. - DOI - PubMed
    1. Richardson DS, Lichtman JW. Clarifying Tissue Clearing. Cell. 2015;162:246–257. doi: 10.1016/j.cell.2015.06.067. - DOI - PMC - PubMed
    1. Orsini MW. Technique of preparation, study and photography of benzoate cleared material for embryological studies. J. Reprod. Fertil. 1962;3:283–287. doi: 10.1530/jrf.0.0030283. - DOI - PubMed
    1. Kuwajima T, et al. ClearT: a detergent- and solvent-free clearing method for neuronal and non-neuronal tissue. Development. 2013;140:1364–1368. doi: 10.1242/dev.091844. - DOI - PMC - PubMed

Publication types