. 2019 Feb 27;9(1):2964.
doi: 10.1038/s41598-019-39920-w.

Understanding carbon utilization routes between high and low starch-producing cultivars of cassava through Flux Balance Analysis

Affiliations

Understanding carbon utilization routes between high and low starch-producing cultivars of cassava through Flux Balance Analysis

Porntip Chiewchankaset et al. Sci Rep. .

Abstract

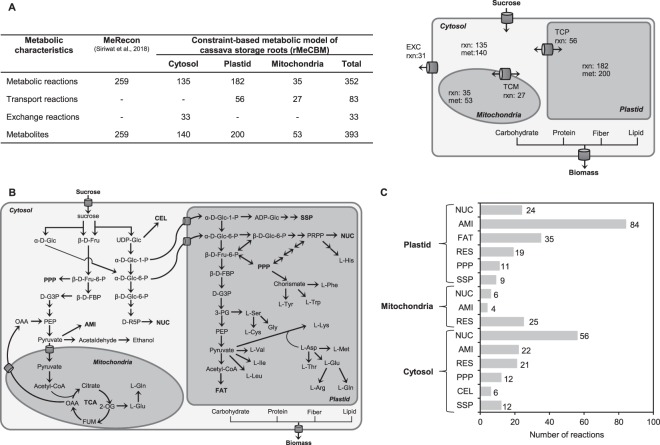
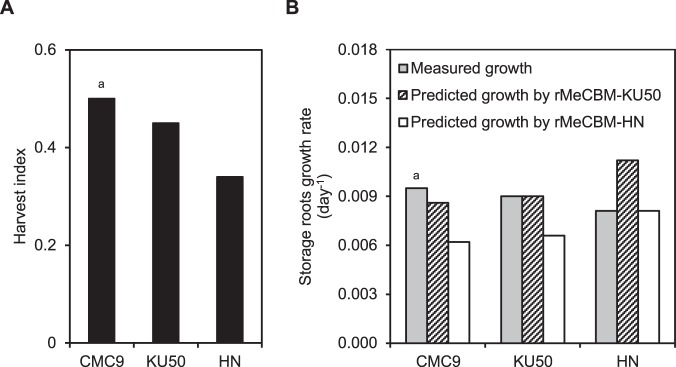
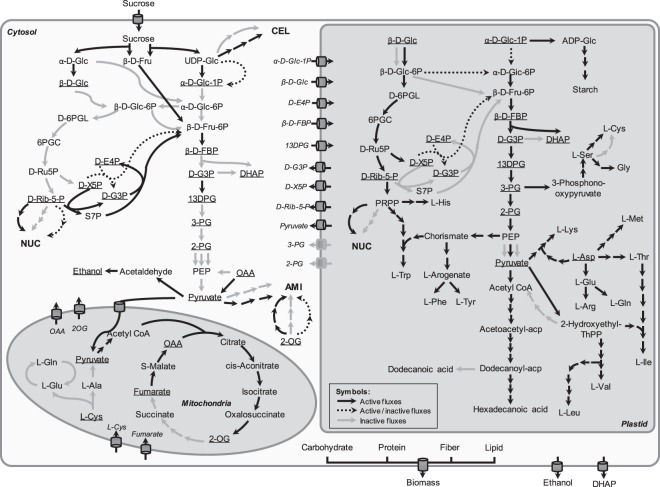
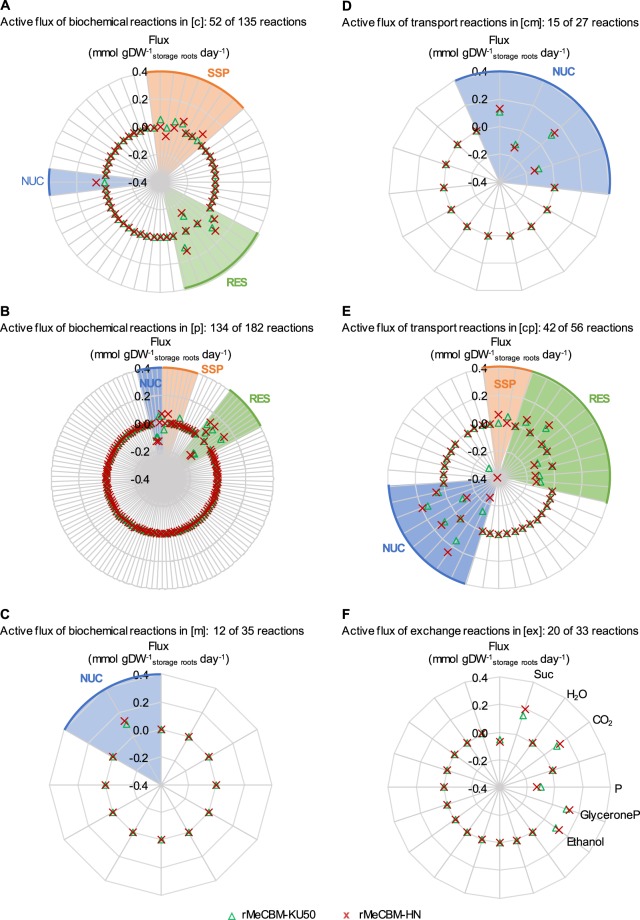
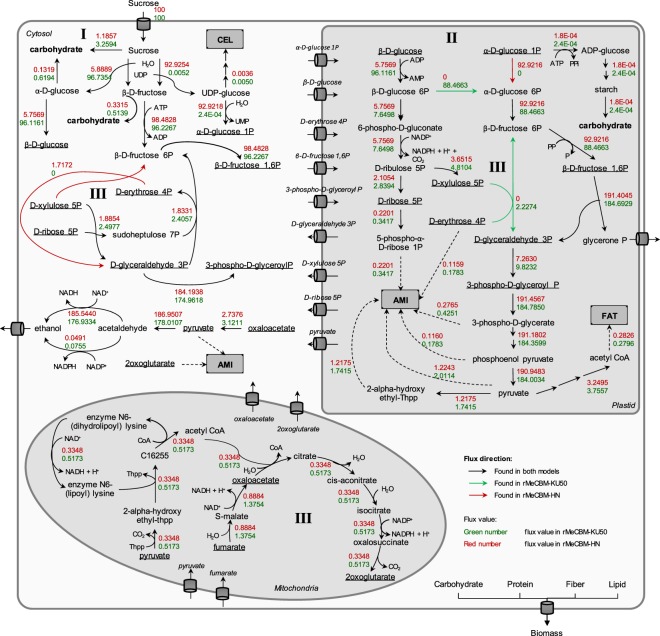
Analysis of metabolic flux was used for system level assessment of carbon partitioning in Kasetsart 50 (KU50) and Hanatee (HN) cassava cultivars to understand the metabolic routes for their distinct phenotypes. First, the constraint-based metabolic model of cassava storage roots, rMeCBM, was developed based on the carbon assimilation pathway of cassava. Following the subcellular compartmentalization and curation to ensure full network connectivity and reflect the complexity of eukaryotic cells, cultivar specific data on sucrose uptake and biomass synthesis were input, and rMeCBM model was used to simulate storage root growth in KU50 and HN. Results showed that rMeCBM-KU50 and rMeCBM-HN models well imitated the storage root growth. The flux-sum analysis revealed that both cultivars utilized different metabolic precursors to produce energy in plastid. More carbon flux was invested in the syntheses of carbohydrates and amino acids in KU50 than in HN. Also, KU50 utilized less flux for respiration and less energy to synthesize one gram of dry storage root. These results may disclose metabolic potential of KU50 underlying its higher storage root and starch yield over HN. Moreover, sensitivity analysis indicated the robustness of rMeCBM model. The knowledge gained might be useful for identifying engineering targets for cassava yield improvement.


Conflict of interest statement

The authors declare no competing interests.

Figures

Figure 1
Figure 1
(A) The proportion of cassava root type (n = 4), (B) storage roots yield, and (C) root starch content, on dry weight basis, at various developmental stages of KU50 and HN cassava cultivars. Data are shown as means ± SE (n = 3). Statistical significance, based on one-sided student’s t-test, is denoted by *(p ≤ 0.10) or **(p ≤ 0.05). DAP, days after planting; DW, dry weight.
Figure 2
Figure 2
The characteristics of the constraint-based metabolic model of carbon metabolism in cassava storage roots (rMeCBM) including (A) summary of model components; (B) the carbon metabolic network; (C) the distribution of reactions in subcellular compartments. EXC, exchange reaction; met, number of metabolite; rxn, number of reaction; TCM, transport reaction between cytosol and mitochondria; TCP, transport reaction between cytosol and plastid. Pathway abbreviation is defined as follows: AMI, amino acid biosynthesis pathway; CEL, cell wall biosynthesis pathway; FAT, fatty acid biosynthesis pathway; NUC, nucleotide biosynthesis pathway; PPP, pentose phosphate pathway; RES, respiration pathway; SSP, starch and sucrose biosynthesis pathway. Metabolite abbreviations not defined in the text are as follows: 2-OG, 2-oxoglutarate; 3-PG, 3-phospho-D-glycerate; β-D-FBP, β-D-Fru-1,6-bisP; D-G3P, D-glyceraldehyde-3-P; D-R5P, D-ribulose-5-P; FUM, fumarate; OAA, oxaloacetate; PEP, phosphoenolpyruvate; PRPP, phosphoribosyl pyrophosphate.
Figure 3
Figure 3
(A) Harvest index of CMC9, KU50, and HN cassava cultivars, on fresh weight basis. (B) The comparison of measured and rMeCBM-predicted storage roots growth rate of CMC9, KU50, and HN cultivars. adata from Mahon et al..
Figure 4
Figure 4
Mapping of all reaction flux distributions of rMeCBM-KU50 and rMeCBM-HN. Active fluxes, denoted by black bold lines, represent reactions containing non-zero fluxes found in both models; active/inactive fluxes, denoted by black dotted lines, represent dissimilar reactions fluxes found in both models; and inactive fluxes denoted by gray lines, represent reactions that contain zero fluxes found in both models. The underlined metabolites represent the metabolites that could transport or exchange across compartments. Metabolite abbreviations not defined in the text as follows: 13DPG, 3-phospho-D-glyceroyl-P; 2-OG, 2-oxoglutarate; 2-PG, 2-phospho-D-glycerate; 3-PG, 3-phospho-D-glycerate; 6PGC, 6-phospho-D-gluconate; β-D-FBP, β-D-Fru-1,6-bisP; D-6PGL, D-glucono-1,5-lactone-6-P; D-E4P, D-erythrose-4-p; D-G3P, D-glyceraldehyde-3-P; D-Ru5P, D-ribulose-5-P; D-X5P, D-xylulose-5-P; DHAP, glycerone-P; OAA, oxaloacetate; PEP, phosphoenolpyruvate; PRPP, phosphoribosyl pyrophosphate; S7P, sedoheptulose-7-P.
Figure 5
Figure 5
Set of active reactions distributed in (A) cytosol (c), (B) plastid (p), (C) mitochondria (m), (D) transport reactions between cytosol and mitochondria (cm), (E) transport reactions between cytosol and plastid (cp), and (F) exchange reactions (ex), in the rMeCBM-KU50 and rMeCBM-HN model. Each radar graph, the radial axes is the flux value (mmol gDW−1storage roots day−1). Each line is an active reaction flux, and highlighted regions correspond to the predominant reaction fluxes in pathways. The optimal flux values were represented in green triangle for the rMeCBM-KU50 model and in red cross for the rMeCBM-HN model. Pathway abbreviation is defined as follows: AMI, amino acid biosynthesis pathway; CEL, cell wall biosynthesis pathway; FAT, fatty acid biosynthesis pathway; NUC, nucleotide biosynthesis pathway; PPP, pentose phosphate pathway; RES, respiration pathway; SSP, starch and sucrose biosynthesis pathway.
Figure 6
Figure 6
The flux sum analysis of the carbon flux distribution in the rMeCBM models of KU50 and HN. Black arrows represent flux reactions in both models; green arrows and numbers represent flux reactions and flux sum values in rMeCBM-KU50; red arrows and numbers represent flux reactions and flux sum values in rMeCBM-HN; and underlined metabolites are transport metabolites. The differences in carbon flux partitioning in both models include carbon flux channeling to carbohydrate biomass (I), carbon supplied for biomass biosynthesis in plastid (II), and metabolic balance of energy and redox in PPP and non-cyclic TCA (III).

References

    1. Howeler, R. H., Lutaladio, N. & Thomas, G. Cassava, a 21st century crop. In Save and grow cassava: A guide to sustainable production intensification (eds Howeler, R. H., Lutaladio, N. & Thomas, G.) 1–18 (FAO, 2013).
    1. Burns A, Gleadow R, Cliff J, Zacarias A, Cavagnaro T. Cassava: the drought, war and famine crop in a changing world. Sustainability. 2010;2:3572–3607. doi: 10.3390/su2113572. - DOI
    1. Nuwamanya E, Baguma Y, Kawuki R, Rubaihayo P. Quantification of starch physicochemical characteristics in a cassava segregating population. African Crop Science Journal. 2008;16:191–202.
    1. El-Sharkawy MA. Cassava biology and physiology. Plant Mol Biol. 2004;53:481–501. doi: 10.1007/s11103-005-2270-7. - DOI - PubMed
    1. Howeler, R. H. Cassava cultivation and soil productivity. In Achieving sustainable cultivation of cassava (ed. Hershey, C.) 285–300 (Burleigh Dodds Science Publishing Limited, 2017).

Publication types