. 2019 Apr;568(7750):117-121.
doi: 10.1038/s41586-019-0977-x. Epub 2019 Feb 27.

Breast cancer cells rely on environmental pyruvate to shape the metastatic niche

Affiliations

Breast cancer cells rely on environmental pyruvate to shape the metastatic niche

Ilaria Elia et al. Nature. 2019 Apr.

Abstract

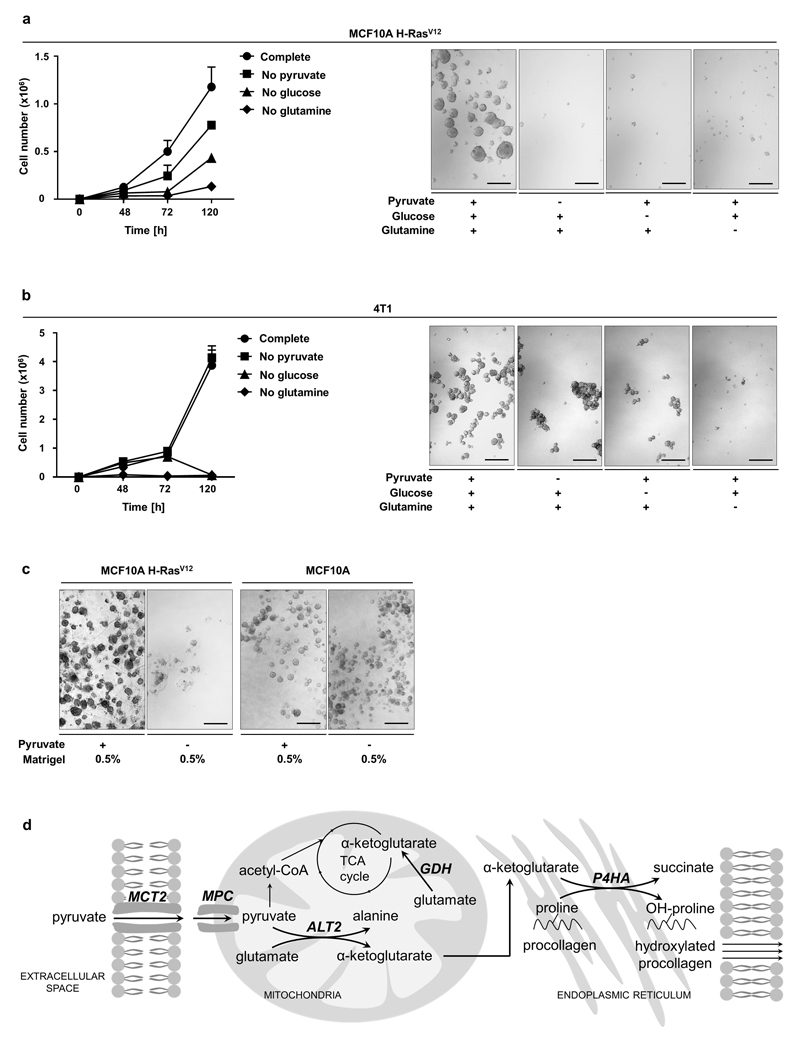
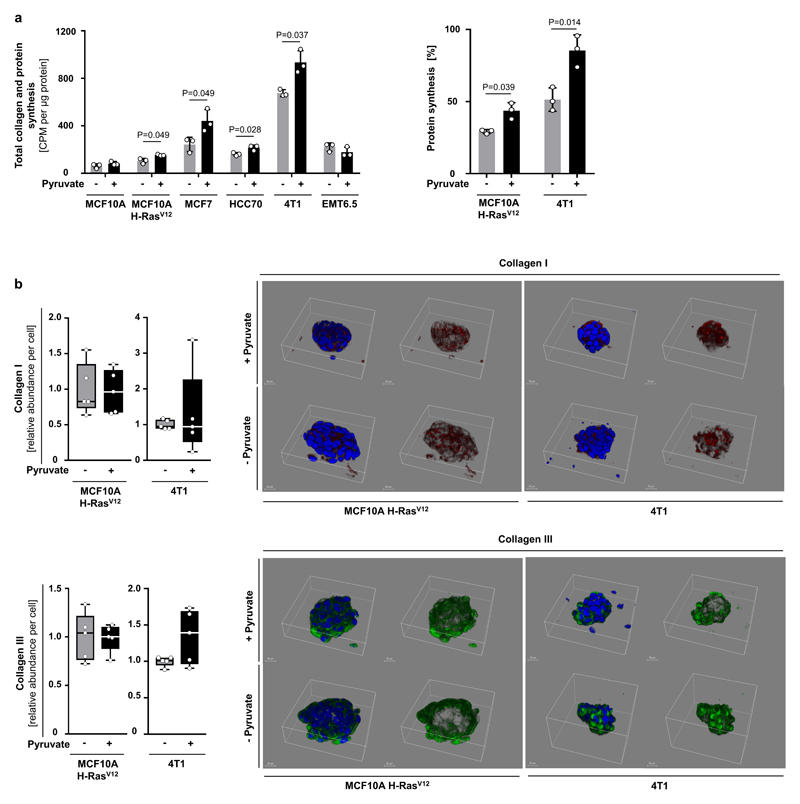
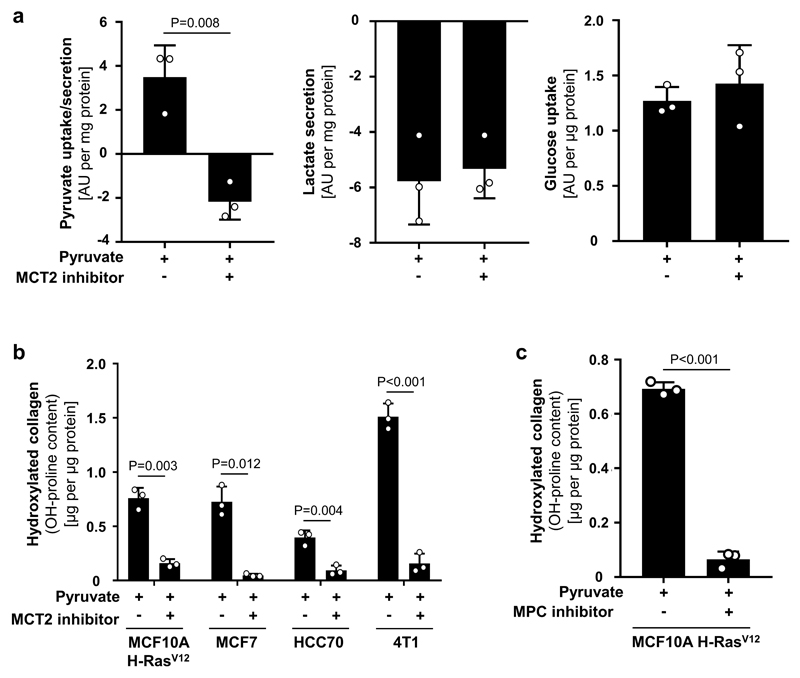
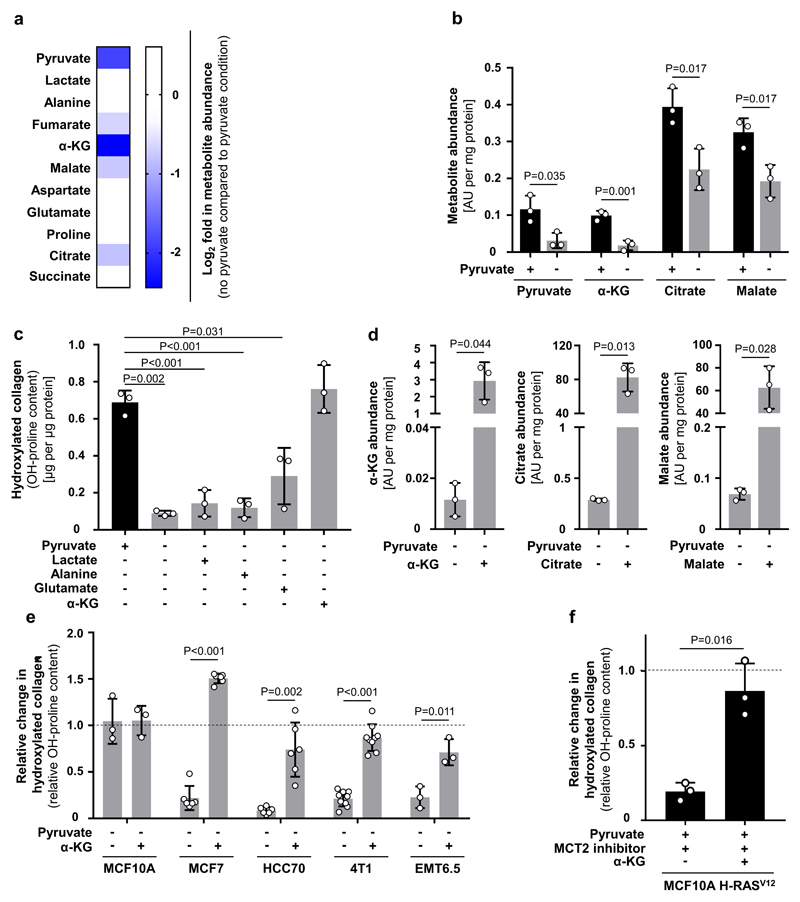
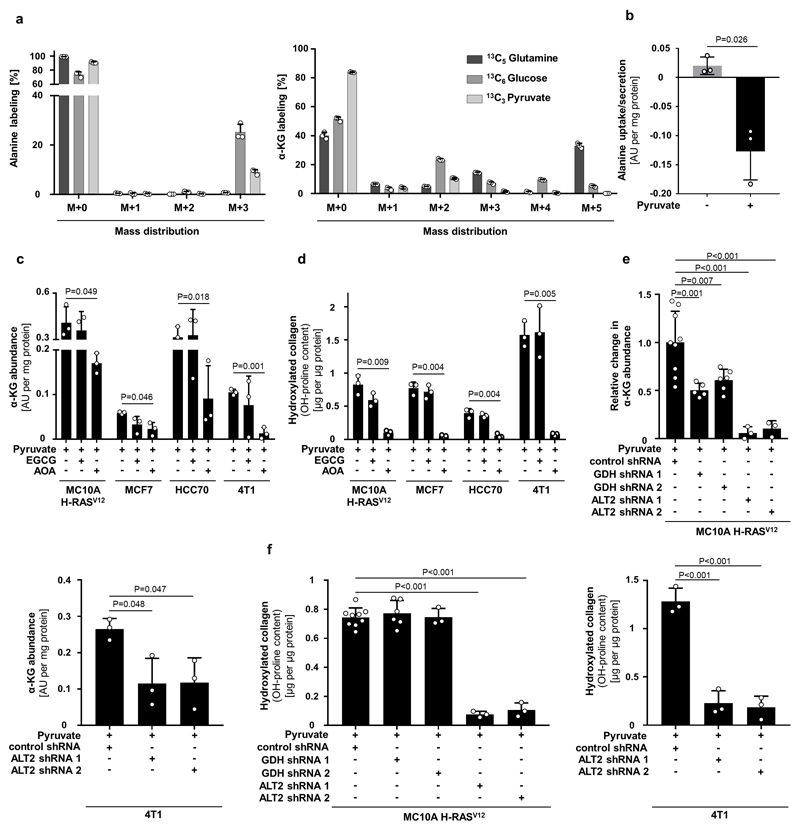
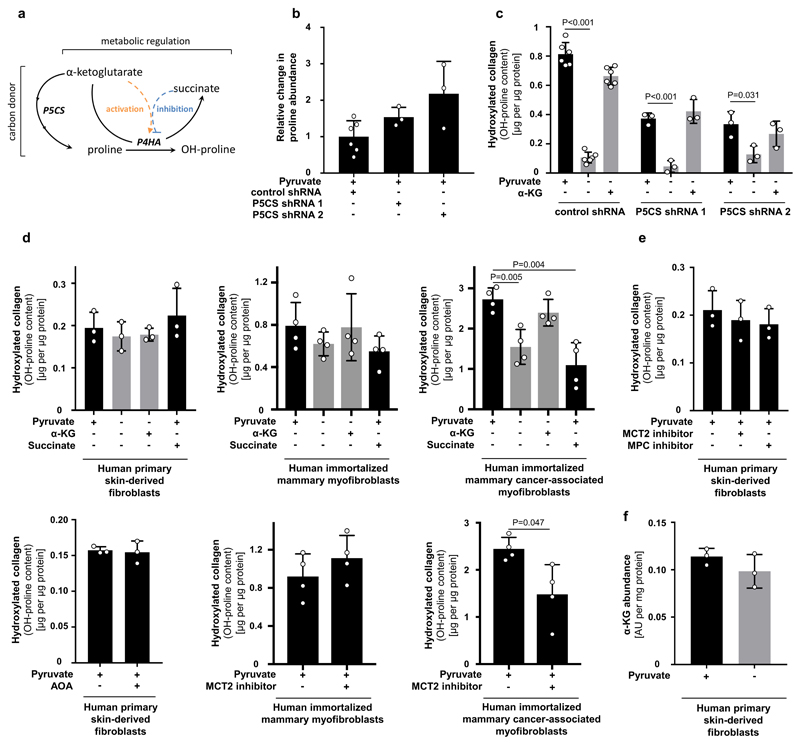
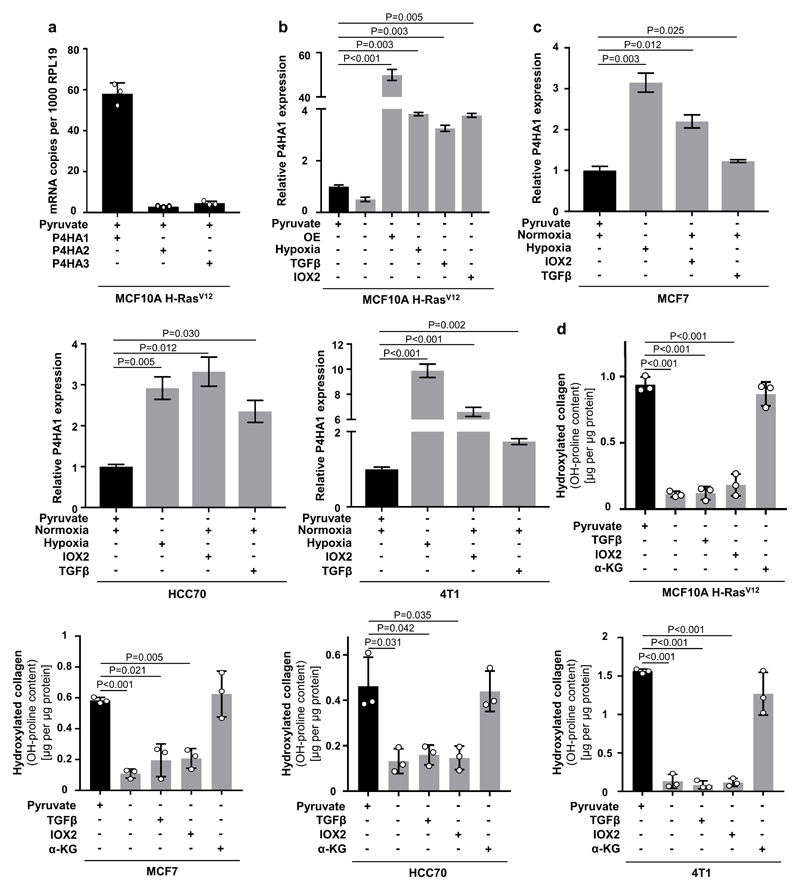
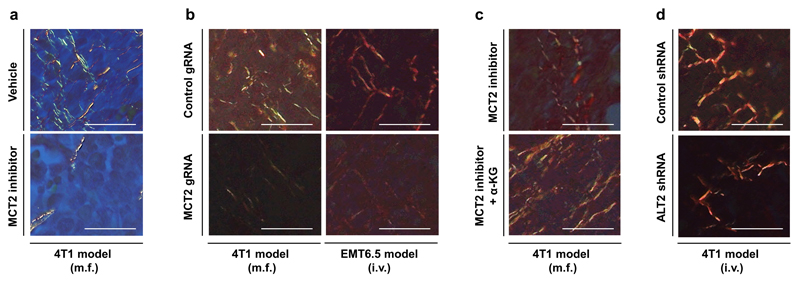
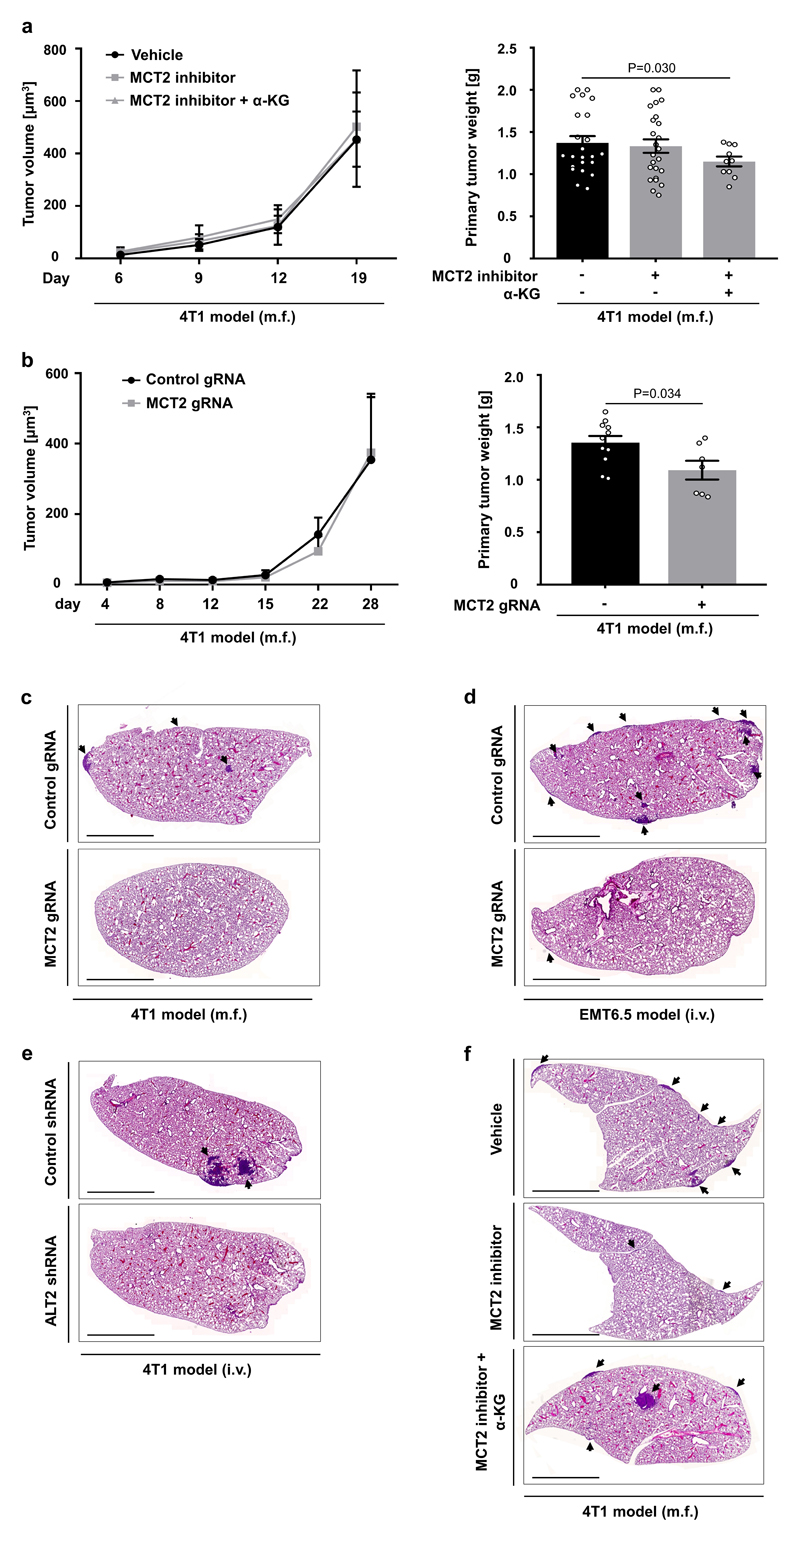
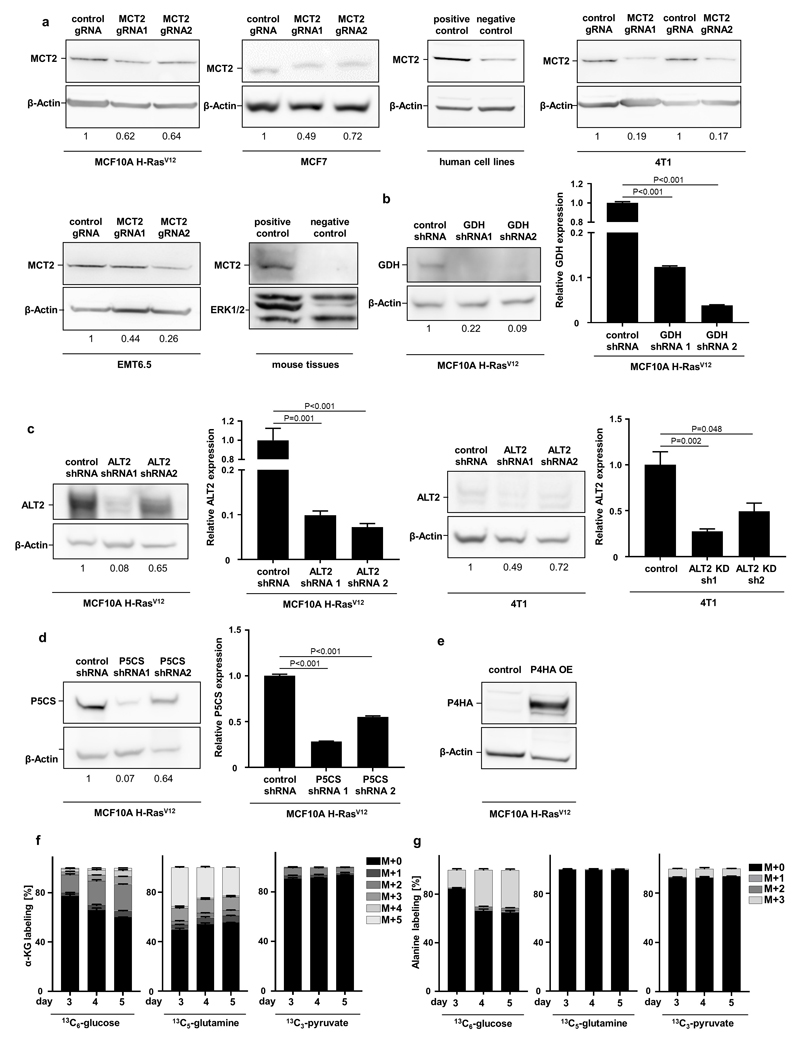
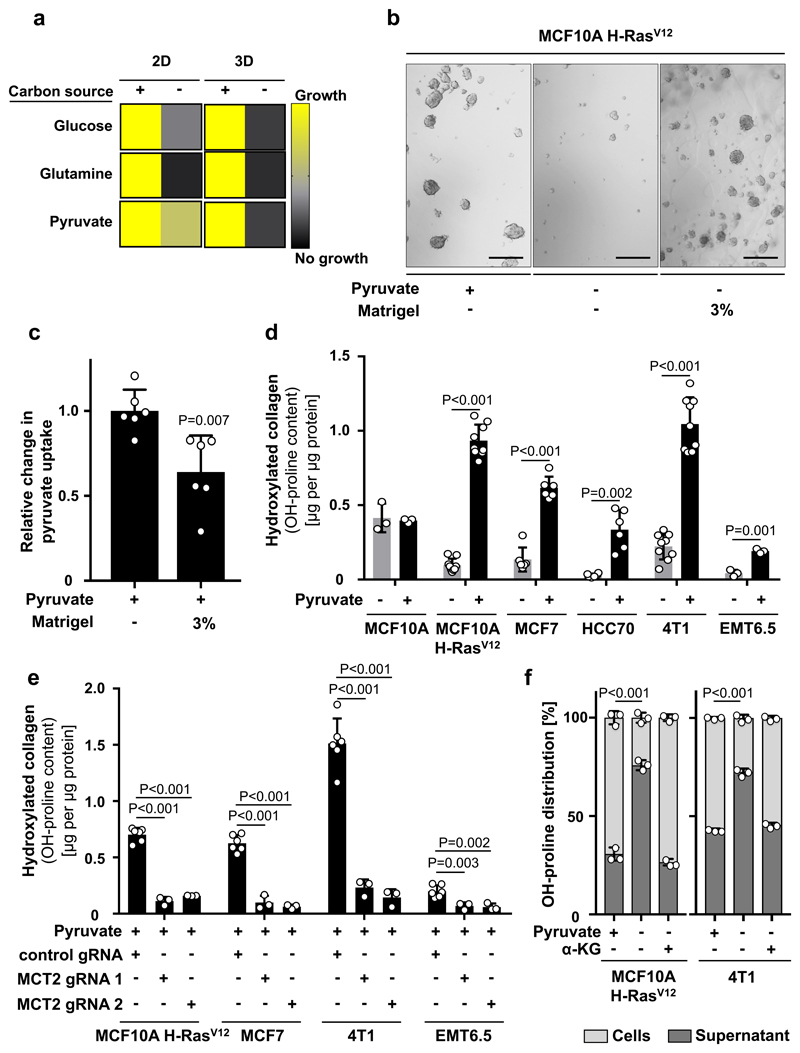
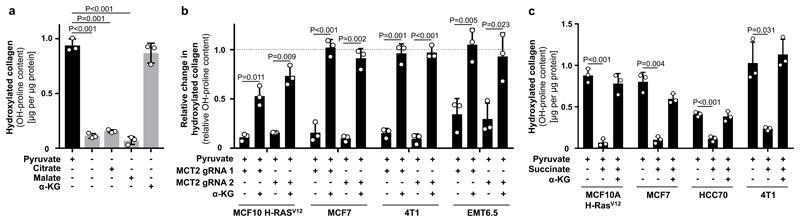
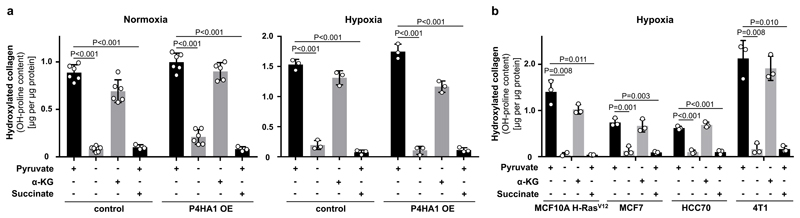
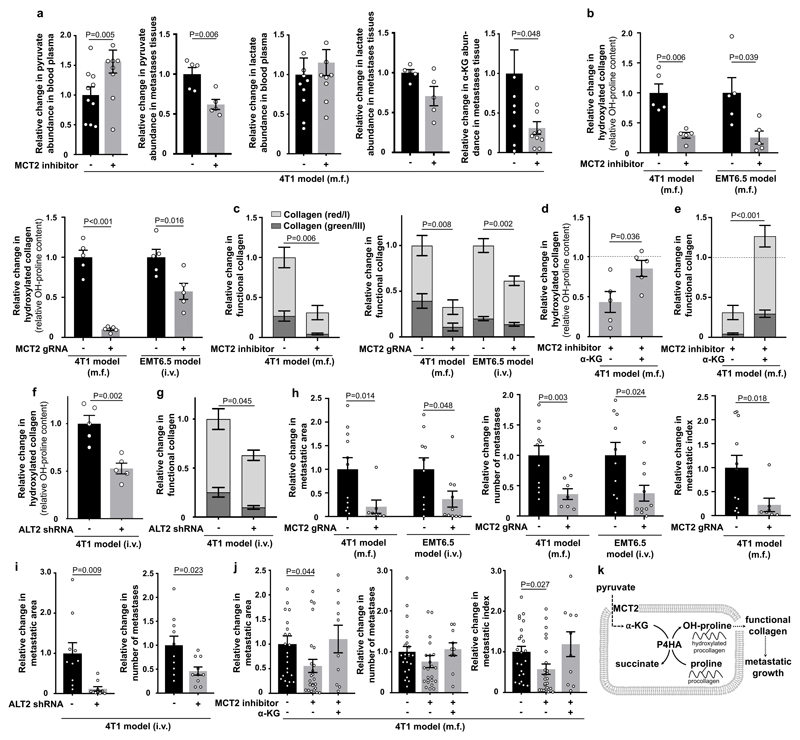
The extracellular matrix is a major component of the local environment-that is, the niche-that determines cell behaviour1. During metastatic growth, cancer cells shape the extracellular matrix of the metastatic niche by hydroxylating collagen to promote their own metastatic growth2,3. However, only particular nutrients might support the ability of cancer cells to hydroxylate collagen, because nutrients dictate which enzymatic reactions are active in cancer cells4,5. Here we show that breast cancer cells rely on the nutrient pyruvate to drive collagen-based remodelling of the extracellular matrix in the lung metastatic niche. Specifically, we discovered that pyruvate uptake induces the production of α-ketoglutarate. This metabolite in turn activates collagen hydroxylation by increasing the activity of the enzyme collagen prolyl-4-hydroxylase (P4HA). Inhibition of pyruvate metabolism was sufficient to impair collagen hydroxylation and consequently the growth of breast-cancer-derived lung metastases in different mouse models. In summary, we provide a mechanistic understanding of the link between collagen remodelling and the nutrient environment in the metastatic niche.


Conflict of interest statement

Author Information

The authors declare to have no financial or non-financial competing interest. SMF has received research funding from Bayer AG and Merck.

Figures

Extended Data Figure 1
Extended Data Figure 1. Pyruvate is required for 3D but not 2D growth of breast cancer cells
(a-b) Growth curves (2D, left panels) and representative pictures (3D, right panels) of human MCF10A H-RasV12 and mouse 4T1 cells cultured in media with or without pyruvate or glucose or glutamine. (c) Representative pictures of MCF10A H-RasV12 and MCF10A spheroids in the presence or absence of pyruvate or 0.5% supplemented ECM (Matrigel). Analysis was performed at day 5. Scale bar: 150 µm. (d) Cellular pyruvate, α-ketoglutarate and hydroxyproline metabolism. Enzymes are depicted in italics. ALT2 refers to mitochondrial alanine aminotransferase. GDH refers to glutamate dehydrogenase. MCT2 refers to monocarboxylate transporter 2. MPC refers to mitochondrial pyruvate carrier. P4HA refers to collagen prolyl-4-hydroxylase. OH-proline refers to hydroxyproline. Only selected reactions are depicted. The number of biological replicates for each experiment was n=3. Error bars represent SD of mean from biological independent samples. Scale bar: 150 μm.
Extended Data Figure 2
Extended Data Figure 2. Pyruvate depletion does not affect collagen synthesis
(a) Total collagen + protein synthesis (left panel) as well as protein synthesis (right panel) in human and mouse breast cancer spheroids with and without pyruvate. Total collagen + protein synthesis was assessed by incorporation of radioactive proline into collagen and protein, while sole protein synthesis was assessed by fluorescent labeled methionine incorporation into protein. The latter is more specific towards protein synthesis since methionine is only to a minor extent incorporated into collagen. Changes that occur in both parameters indicate alterations in protein synthesis, while changes that occur only in total collagen + protein synthesis indicate alterations in collagen synthesis. Our data indicate that collagen synthesis was not altered by pyruvate depletion, because either total collagen + protein synthesis is not altered or both parameters are altered to a similar extent in the tested cell lines. n=3. (b) Relative collagen I and III abundance and representative 3D reconstruction in human MCF10A H-RASV12 and mouse 4T1 breast cancer spheroids with and without pyruvate measured by immunofluorescence. n=5. Collagen I/III are major collagen species in breast cancer. Blue indicates DAPI-stained nuclei, red indicates collagen I, and green indicates collagen III. The total fluorescence intensity was measured in each microscopy field and normalized over cell number, scored as number of DAPI-stained nuclei. Five microscopy fields were averaged for each sample. Relative fluorescence intensities per cell are depicted, normalized to control condition. Solid line indicates median, the box extends are the 25th to 75th percentiles, the whiskers span between the smallest and the largest value. Error bars represent SD of mean from biological independent samples unless otherwise noted. Two-tailed unpaired student’s T-test.
Extended Data Figure 3
Extended Data Figure 3. Pyruvate drives collagen hydroxylation
(a) Pyruvate, lactate and glucose uptake/secretion in human MCF10A H-RASV12 breast cancer spheroids treated with MCT2 inhibitor (α-cyano-hydroxycinnamic acid; 1.5mM). This data show that the used inhibitor impairs pyruvate uptake, but not lactate or glucose secretion and uptake, respectively. (b-c) Hydroxylated collagen assessed via measurement of hydroxyproline (OH-proline) in human (MCF10A H-RASV12, MCF7, HCC70) and mouse (4T1) breast cancer spheroids treated with a MCT2 inhibitor (α-cyano-hydroxycinnamic acid; 1.5 mM), or treated with the MPC inhibitor UK5099 (50 μM) in the presence of pyruvate. The number of biological replicates for each experiment was n=3. Error bars represent SD of mean from biological independent samples. Two-tailed unpaired student’s T-test.
Extended Data Figure 4
Extended Data Figure 4. Pyruvate drives collagen hydroxylation via α-ketoglutarate
(a) Heat map representing metabolite changes in MCF10A H-RasV12 spheroids in the presence or absence of pyruvate measured by mass spectrometry. Blue indicates significantly reduced metabolites upon pyruvate depletion. n=3. (b) Intracellular abundance of pyruvate, α-ketoglutarate (α-KG), citrate and malate in human MCF10A H-RASV12 breast cancer spheroids with and without pyruvate. n=3. (c) Hydroxylated collagen assessed via measurement of hydroxyproline (OH-proline) in MCF10A H-RasV12 spheroids in the presence or absence of pyruvate upon addition of either lactate (2 mM), alanine (2 mM), glutamate (2 mM) or cell permeable α-ketoglutarate (dimethyl 2-oxoglutarate; α-KG; 1.5 mM). n=3. (d) Intracellular abundance of α-ketoglutarate (α-KG), citrate and malate in human MCF10A H-RASV12 breast cancer spheroids upon supplementation of cell permeable α-KG (dimethyl 2-oxoglutarate; 1.5 mM), citrate (5 mM) or malate (5 mM). n=3. (e) Relative change in hydroxylated collagen assessed via measurement of hydroxyproline (OH-proline) in human (MCF10A, MCF7, HCC70) and mouse (4T1, EMT6.5) breast cancer spheroids in the absence of pyruvate with or without cell permeable α-ketoglutarate (dimethyl 2-oxoglutarate; α-KG; 1.5 mM). Data are normalized to controls. Dashed line indicates the level of hydroxylated collagen in control conditions with pyruvate. n=3 for MCF10A and EMT6.5; n=6 for MCF7 and HCC70; n=9 for MCF10A H-RasV12 and 4T1. (f) Relative change in hydroxylated collagen assessed via measurement of hydroxyproline (OH-proline) in MCF10A H-RASV12 spheroids treated with the MCT2 inhibitor α-cyano-4-hydroxycinnamic acid (1.5 mM) upon addition of cell permeable α-ketoglutarate (dimethyl 2-oxoglutarate; α-KG; 1.5 mM) in the presence of pyruvate. Data are normalized to control. Dashed line indicates the level of hydroxylated collagen in control condition. n=3. Error bars represent SD of mean from biological independent samples. Two-tailed unpaired student’s T-test.
Extended Dataure Fig 5
Extended Dataure Fig 5. Pyruvate to alanine conversion drives α-ketoglutarate production
(a) Carbon contribution of 13C5 glutamine, 13C6 glucose, and 13C3 pyruvate to alanine and α-ketoglutarate (α-KG) assessed by 13C tracer analysis. n=3. (b) Alanine uptake/secretion in MCF10A H-RasV12 spheroids with and without pyruvate measured by the mass spectrometry analysis of the media. n=3. (c-f) Intracellular abundance of α-ketoglutarate (α-KG) and hydroxylated collagen in human and mouse breast cancer spheroids upon treatment with the transaminase inhibitor aminooxyacetate (AOA; 0.8 mM), the glutamate dehydrogenase inhibitor epigallocatechin gallate (EGCG; 50 µM), transduced with a lentiviral vector with shRNA for either mitochondrial ALT2 (KD), GDH (KD) or scrambled control sequence in the presence of pyruvate. n=3 for EGCG and AOA treatment (c-d); n=9 for control shRNA, n=6 for GDH shRNA 1 and 2 and n=3 for ALT2 shRNA1 and 2 (MCF10A H-RasV12, e-f); n=3 for control shRNA and ALT2 shRNA 1 and 2 (4T1, e-f). In case ALT activity majorly contributs to α-ketoglutarate generation, ECGC (which inhibits the pyruvate independent conversion of glutamate to α-ketoglutarate via the enzyme glutamate dehydrogenase (GDH)), should have a minor effect on α-ketoglutarate abundance and hydroxylated collagen. Indeed, we found that this was the case. Error bars represent SD of mean from biological independent samples. Two-tailed unpaired student’s T-test.
Extended Data Figure 6
Extended Data Figure 6. α-ketoglutarate metabolically regulates P4HA activity in cancer cells
(a) Schematic representation of the metabolic regulation and carbon donor mechanisms by which α-ketoglutarate can regulate collagen hydroxylation. Solid lines indicate metabolite conversion, while dashed lines indicate metabolic regulation. Enzymes are depicted in italics. P4HA refers to collagen prolyl-4-hydroxlase. P5CS refers to pyrroline-5-carboxylate synthase. (b-c) Relative change in intracellular abundance of proline and hydroxylated collagen in MCF10A H-RasV12 spheroids transduced with a lentiviral vector with shRNA for either P5CS (KD) or scrambled control sequence with or without cell permeable α-ketoglutarate (dimethyl 2-oxoglutarate; α-KG; 1.5 mM) in the presence or absence of pyruvate normalized to control condition. If the carbon donor mechanism occurs, it is expected that proline abundance decreases in P5CS knockdown spheroids and that they no longer respond to the α-ketoglutarate rescue upon pyruvate depletion. However, we observed that proline abundance did not significantly change in P5CS knockdown spheroids. Moreover, α-ketoglutarate addition still significantly increased hydroxylated collagen to a similar extent as pyruvate. n=3 (b); n=6 (control shRNA); n=3 (P5CS shRNA 1 and 2 (c)). (d) Hydroxylated collagen assessed via measurement of hydroxyproline (OH-proline) in human (myo)fibroblasts in presence or absence of pyruvate with or without cell permeable α-ketoglutarate (dimethyl 2-oxoglutarate; α-KG; 1.5 mM) and/or cell permeable succinate (dimethyl succinate; 1.5 mM). n=3 (human primary skin-derived fibroblasts); n=4 (human immortalized mammary and cancer associated myofibroblasts). (e) Hydroxylated collagen assessed via measurement of hydroxyproline (OH-proline) in human (myo)fibroblasts treated with the MCT2 inhibitor α-cyano-4-hydroxycinnamic acid (1.5 mM), the MPC inhibitor UK5099 (50 μM) or the transaminase inhibitor AOA (0.8 mM) in the presence of pyruvate. n=3. (f) Intracellular abundance of α-ketoglutarate (α-KG) in the presence or absence of pyruvate in human fibroblasts. n=3. Error bars represent SD of mean from biological independent samples. Two-tailed unpaired student’s T-test.
Extended Data Figure 7
Extended Data Figure 7. Metabolic regulation of P4HA activity is independent of it's known transcriptional regulation.
(a) Absolute levels of P4HA1, P4HA2 and P4HA3 in human MCF10A H-RASV12 breast cancer spheroids in presence of pyruvate. (b) Relative change in P4HA1 expression upon pyruvate depletion as well as P4HA1 overexpression (OE) in normoxia, P4HA1 expression in hypoxia (1 % oxygen), upon 12 ng per ml TGFβ addition and 50 µM IOX2 treatment normalized to the control condition with pyruvate. (c) Relative P4HA1 expression in human (MCF7, HCC70) and mouse (4T1) breast cancer spheroids in the presence (normoxia) or absence (hypoxia (1 % oxygen); IOX2 (50 µM); TGFβ (12 ng per ml)) of pyruvate normalized to the normoxia condition with pyruvate. (d) Hydroxylated collagen assessed via measurement of hydroxyproline (OH-proline) in human (MCF10A H-RasV12, MCF7, HCC70) and mouse (4T1) breast cancer spheroids treated with TGFβ (12 ng per ml) or IOX2 (50 µM) with or without pyruvate or upon addition of cell permeable α-ketoglutarate (dimethyl 2-oxoglutarate; α-KG; 1.5 mM). The number of biological replicates for each experiment was n=3. Error bars represent SD of mean from biological independent samples. Two-tailed unpaired student’s T-test.
Extended Data Figure 8
Extended Data Figure 8. Functional collagen deposition decreases in the lung metastatic niche upon pyruvate metabolism inhibition
Representative pictures of functional collagen of lung metastases tissue based on Picro-Sirius Red staining and polarized light microscopy. Red predominantly indicates tick collagen I fibers and green predominately indicates thin collagen III fibers. (a) 4T1 model (m.f.) upon pharmacologic inhibition of MCT2 (α-cyano-4-hydroxycinnamic acid; 60 mg per kg, i.p.). (b) 4T1 (m.f.) and EMT6.5 (i.v.) model upon genetic inhibition of MCT2. (c) 4T1 model (m.f.) upon pharmacologic inhibition of MCT2 (α-cyano-4-hydroxycinnamic acid; 60 mg per kg, i.p.) with or without treatment with cell permeable α-ketoglutarate (dimethyl 2-oxoglutarate; α-KG; 50 mg per kg; i.p.). (d) 4T1 model (i.v.) upon genetic inhibition of ALT2. m.f. refers to mammary fat pad injection. i.v. refers to intra venous injection. i.p. refers to intra peritoneal injection. Scale bar: 50 μm.
Extended Data Figure 9
Extended Data Figure 9. Metastatic burden decreases independently of primary tumor volume upon pyruvate metabolism inhibition
(a) Primary tumor volume over time and final tumor weight upon pharmacologic inhibition of MCT2 (α-cyano-4-hydroxycinnamic acid, 60 mg per kg, i.p.) with or without treatment with cell permeable α-ketoglutarate (dimethyl 2-oxoglutarate; α-KG; 50 mg per kg; i.p.) in the 4T1 model (m.f.). n=23 (vehicle, 3 cohorts), n=24 (MCT2 inhibitor, 2 cohorts), n=10 (MCT2 inhibitor + αKG). (b) Primary tumor volume over time and final tumor weight upon genetic inhibition of MCT2 in the 4T1 model (m.f.). n=11 (4T1 control), n=7 (4T1 MCT2 gRNA). (c) Representative pictures of lung metastases tissue upon genetic inhibition of MCT2 in the 4T1 model (m.f.) based on Hematoxylin and Eosin staining. (d) Representative pictures of lung metastases tissue upon genetic inhibition of MCT2 in the EMT6.5 model (i.v.) based on Hematoxylin and Eosin staining. (e) Representative pictures of lung metastases tissue upon genetic inhibition of ALT2 in the 4T1 model (i.v.) based on Hematoxylin and Eosin staining. (f) Representative pictures of lung metastases tissue upon pharmacologic inhibition of MCT2 (α-cyano-4-hydroxycinnamic acid; 60 mg per kg; i.p.) with or without treatment with cell permeable α-ketoglutarate (dimethyl 2-oxoglutarate; α-KG; 50 mg per kg; i.p.) in the 4T1 model (m.f.) based on Hematoxylin and Eosin staining. The much milder impact of MCT2 inhibition compared to the previously described P4HA inhibition on primary tumor growth could be explained by our previous observation that pyruvate is less available to primary breast cancers than to lung metastases. m.f. refers to mammary fat pad injection. i.v. refers to intra venous injection. i.p. refers to intra peritoneal injection. Arrow heads indicate metastases tissue. Error bars represent SEM of mean from different mice. Two-tailed unpaired student’s T-test. Scale bar: 0.5 cm.
Extended Data Figure 10
Extended Data Figure 10. Protein and RNA expression of genetically modified breast cancer cells
(a) Western blot analysis for MCT2 in human (MCF10A H-RASV12, MCF7) and mouse (4T1, EMT6.5) breast cancer cells infected with either a control gRNA or two different MCT2 gRNA normalized to control condition. Human positive/negative control: H460/MDA-MB-468; mouse positive/negative control: testis/lung. (b) Western blot analysis and relative gene expression for GDH in human MCF10A H-RASV12 breast cancer cells infected with either a control shRNA or two different GDH shRNA normalized to control condition. (c) Western blot analysis and relative gene expression for ALT2 in human (MCF10A H-RASV12) and mouse (4T1) breast cancer cells infected with either a control shRNA or two different ALT2 shRNA normalized to control condition. (d) Western blot analysis and relative gene expression for P5CS in human MCF10A H-RASV12 breast cancer cells infected with either a control shRNA or two different P5CS shRNA. (e) Western blot analysis for P4HA in human MCF10A H-RASV12 breast cancer cells infected with either a control or an overexpressing P4HA vector. (f-g) Time resolved contribution of 13C6-glucose, 13C5-glutamine and 13C3-pyruvate to α-ketoglutarate (α-KG) and alanine in human MCF10A H-RASV12 breast cancer spheroids. The number of biological replicates for each experiment was n=3. Error bars represent SD of mean from biological independent samples. Two-tailed unpaired student’s T-test. For gel source data, see Supplementary Figure 1.
Figure 1
Figure 1. Pyruvate drives ECM remodeling via collagen hydroxylation
(a) Growth response of MCF10A H-RasV12 2D and 3D culture with or without glucose (17.5 mM), glutamine (2.5 mM) or pyruvate (0.5 mM). Growth was assessed based on cell number (2D, n=6) or spheroid size (3D, n=3). (b) Representative pictures of MCF10A H-RasV12 spheroids with or without pyruvate and supplemented with ECM (Matrigel). Analysis was performed at day 5. Scale bar: 150 µm. (c) Relative change in pyruvate uptake in MCF10A H-RasV12 spheroids with or without supplemented ECM (Matrigel) normalized to the condition with pyruvate. n=6. (d) Hydroxylated collagen based on hydroxyproline (OH-proline) in human (MCF10A, MCF10A H-RASV12, MCF7, HCC70) and mouse (4T1, EMT6.5) breast cancer spheroids with or without pyruvate. n=3 for MCF10A and EMT6.5; n=6 for MCF7 and HCC70; n=9 for MCF10A H-RasV12 and 4T1. (e) Hydroxylated collagen based on hydroxyproline (OH-proline) in breast cancer spheroids transduced with lentiviral CRISPR with or without guide for MCT2 in the presence of pyruvate. n=6 for control gRNA; n=3 for MCT2 gRNA1 and 2. (f) Collagen stability based on the hydroxyproline (OH-proline) distribution between MCF10A H-RasV12 cells and supernatant upon MMP 8 digestion with or without pyruvate or cell permeable α-ketoglutarate (dimethyl 2-oxoglutarate; α-KG; 1.5 mM). n=3. Error bars represent SD of mean from biological independent samples. Two-tailed unpaired student’s T-test.
Figure 2
Figure 2. Pyruvate drives availability of α-ketoglutarate which metabolically regulates P4HA activity
(a) Hydroxylated collagen based on hydroxyproline (OH-proline) in MCF10A H-RASV12 spheroids in the presence or absence of pyruvate in combination with cell permeable α-ketoglutarate (dimethyl 2-oxoglutarate; α-KG; 1.5 mM), citrate (5 mM), or malate (5 mM). (b) Relative change in hydroxylated collagen based on hydroxyproline (OH-proline) in human (MCF10A H-RASV12, MCF7) and mouse (4T1, EMT6.5) breast cancer spheroids transduced with lentiviral CRISPR with or without guide for MCT2 upon addition of cell permeable α-ketoglutarate (dimethyl 2-oxoglutarate; α-KG; 1.5 mM) in the presence of pyruvate. Data are normalized to the corresponding conditions without genetic MCT2 inhibition. Dashed line indicates the level of hydroxylated collagen in the corresponding conditions without genetic MCT2 inhibition. (c) Hydroxylated collagen based on hydroxyproline (OH-proline) in human (MCF10A H-RasV12, MCF7, HCC70) and mouse (4T1) breast cancer spheroids in the presence of pyruvate upon addition of 1.5 mM (MCF10A H-RasV12, 4T1) or 2 mM (MCF7, HCC70) cell permeable α-ketoglutarate (dimethyl 2-oxoglutarate; α-KG) and/or 1.5 mM cell permeable succinate (dimethyl succinate). Error bars represent SD of mean from biological independent samples (n=3). Two-tailed unpaired student’s T-test.
Figure 3
Figure 3. Pyruvate is a - transcriptionally independent - regulator of collagen hydroxylation
(a) Hydroxylated collagen based on hydroxyproline (OH-proline) in MCF10A H-RasV12 spheroids transduced with an overexpressing vector (OE) with or without P4HA1 sequence cultured in normoxia or hypoxia (1 % oxygen) in the presence or absence of pyruvate and addition of cell permeable α-ketoglutarate (dimethyl 2-oxoglutarate; α-KG; 1.5 mM) and/or cell permeable succinate (dimethyl succinate; 1.5 mM). A two-way Anova with Tukey multiple comparisons was performed to compare across conditions. Significance of control versus OE in normoxia p=0.0003 and in hypoxia p=0.9042. Significance of pyruvate or α-ketoglutarate versus no pyruvate or succinate in normoxia/hypoxia p<0.0001. n=6 for +/- pryruvate, – pyruvate + α-KG and n=3 for + pyruvate + succinate in normoxia. n=3 for all conditions in hypoxia. (b) Hydroxylated collagen based on hydroxyproline (OH-proline) in human (MCF10A H-RasV12, MCF7, HCC70) and mouse (4T1) breast cancer spheroids cultured in hypoxia (1 % oxygen) with or without pyruvate upon addition of cell permeable α-ketoglutarate (dimethyl 2-oxoglutarate; α-KG; 1.5 mM) and/or cell permeable succinate (dimethyl succinate; 1.5 mM). n=3. Error bars represent SD of mean from biological independent samples. Two-tailed unpaired student’s T-test unless otherwise noted.
Figure 4
Figure 4. Pyruvate drives in vivo collagen hydroxylation and metastatic growth
(a) Metabolite abundances in 4T1 mice treated upon MCT2 inhibition (α-cyano-4-hydroxycinnamic acid; 60 mg per kg; i.p.). Plasma n=10 exception pyruvate with MCT2 inhibitor n=9; tissue pyruvate/lactate n=5 and α-KG n=10. (b) Hydroxylated collagen in 4T1 and EMT6.5 lung metastases upon pharmacologic (α-cyano-4-hydroxycinnamic acid; 60 mg per kg; i.p.) and genetic MCT2 inhibition (n=5). (c) Functional collagen in the same models as described in (b). Significance collagen red/green reduction: 0.009/0.006 (4T1 inhibitor), 0.01/0.006 (4T1 genetic) and 0.001/0.04 (EMT6.5 genetic). n=10 (4T1 vehicle), n=7 (4T1 inhibitor), n=11 (4T1 control), n=6 (4T1 MCT2 gRNA), n=20 (EMT6.5 control), n=12 (EMT6.5 MCT2 gRNA). (d) Hydroxylated collagen in 4T1 lung metastases upon MCT2 inhibition (α-cyano-4-hydroxycinnamic acid; 60 mg per kg; i.p.) with(out) cell permeable α-ketoglutarate (dimethyl 2-oxoglutarate; α-KG; 50 mg per kg; i.p.; n=5). (e) Functional collagen in the same models as described in (d). Significance collagen red/green increase: 0.0008/0.0005. n=7 (inhibitor), n=9 (inhibitor + α-KG). (f) Hydroxylated collagen in 4T1 lung metastases upon genetic inhibition of ALT2 (n=5). (g) Functional collagen in the same models as described in (f). Significance collagen red/green reduction: 0.10/0.02. n=7 (control), n=4 (ALT2 shRNA). (h-i) Metastatic burden in 4T1 and EMT6.5 lungs upon genetic MCT2 or ALT2 inhibition. n=11 (4T1 control; two cohorts), n=7 (4T1 MCT2 gRNA; two cohorts), n=10 (EMT6.5 control), n=10 (EMT6.5 MCT2 gRNA or shALT2). (j) Metastatic burden in the same models as described in (d). n=23 (vehicle; three cohorts), n=24 (inhibitor; two cohorts), n=10 (inhibitor + α-KG). (k) Role of pyruvate in ECM remodeling. m.f. : mammary fat pad; i.v. : intra venous; i.p. : intra peritoneal. Dashed lines indicate level without treatment. Data are normalized to no treatment condition. Error bars represent SEM of mean from different mice. Two-tailed unpaired student’s T-test.

Comment in

  • Renovation in progress.
    Harjes U. Harjes U. Nat Rev Cancer. 2019 May;19(5):246. doi: 10.1038/s41568-019-0131-y. Nat Rev Cancer. 2019. PMID: 30890773 No abstract available.

References

    1. Bonnans C, Chou J, Werb Z. Remodelling the extracellular matrix in development and disease. Nat Rev Mol Cell Biol. 2014;15:786–801. - PMC - PubMed
    1. Gilkes DM, et al. Collagen Prolyl Hydroxylases are Essential for Breast Cancer Metastasis. Cancer research. 2013;73:3285–3296. - PMC - PubMed
    1. Xiong G, Deng L, Zhu J, Rychahou PG, Xu R. Prolyl-4-hydroxylase α subunit 2 promotes breast cancer progression and metastasis by regulating collagen deposition. BMC cancer. 2014;14:1. - PMC - PubMed
    1. Elia I, Fendt S-M. In vivo cancer metabolism is defined by the nutrient microenvironment. Translational Cancer Research. 2016;5:S1284–S1287.
    1. Elia I, Doglioni G, Fendt S-M. Metabolic Hallmarks of Metastasis Formation. Trends in Cell Biology. 2018 - PubMed

MeSH terms