. 2019 Mar;567(7749):525-529.
doi: 10.1038/s41586-019-0979-8. Epub 2019 Feb 27.

Genome-wide analysis identifies NR4A1 as a key mediator of T cell dysfunction

Affiliations

Genome-wide analysis identifies NR4A1 as a key mediator of T cell dysfunction

Xindong Liu et al. Nature. 2019 Mar.

Abstract

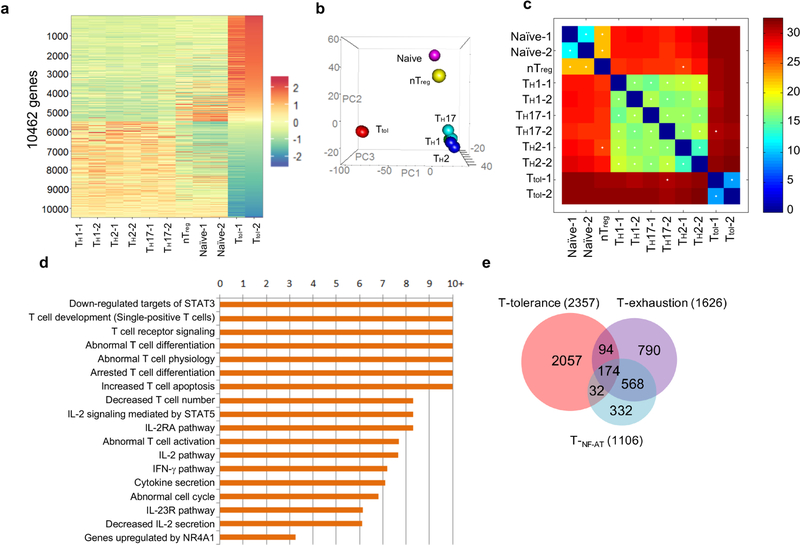
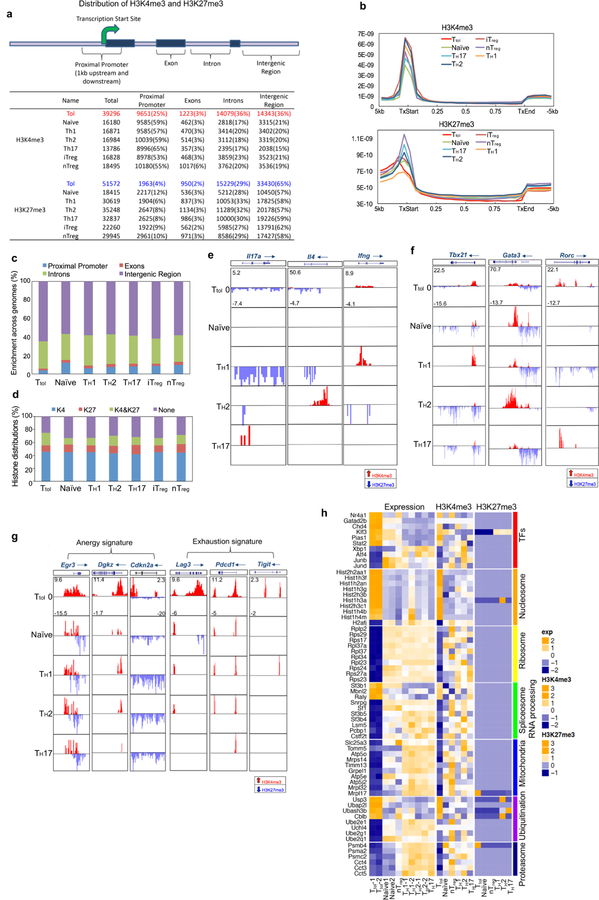
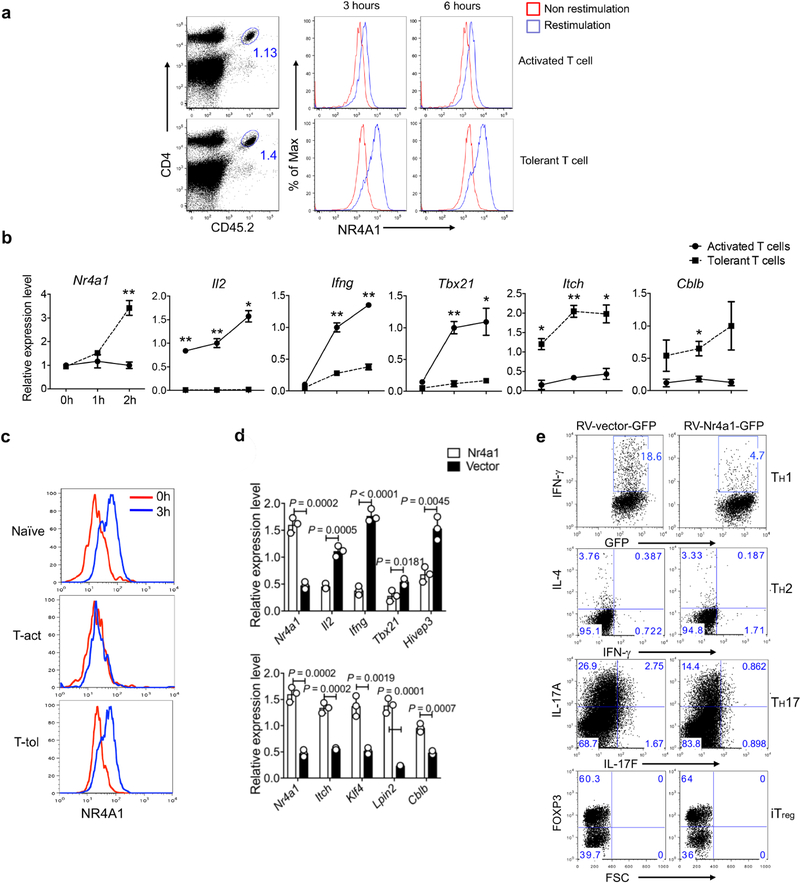
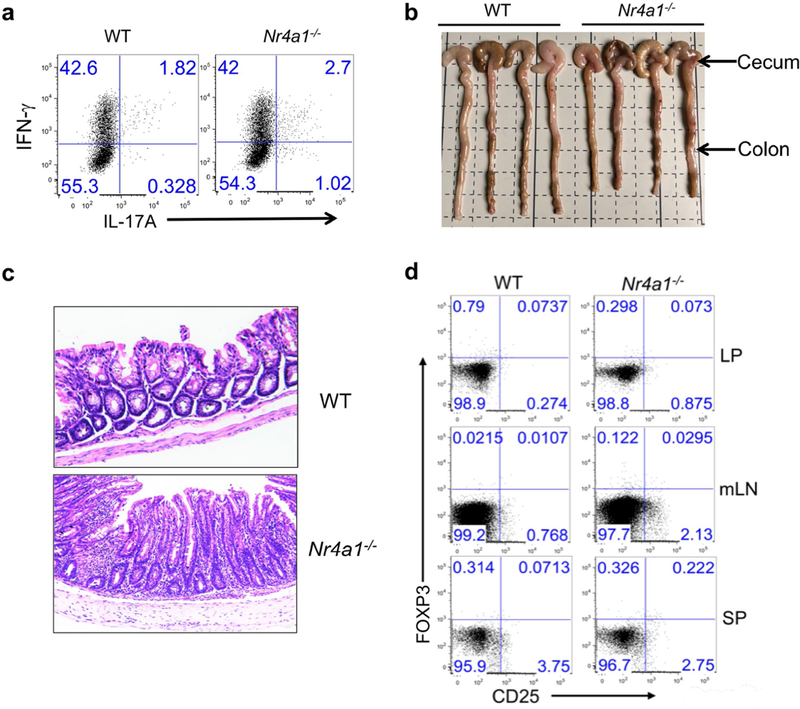
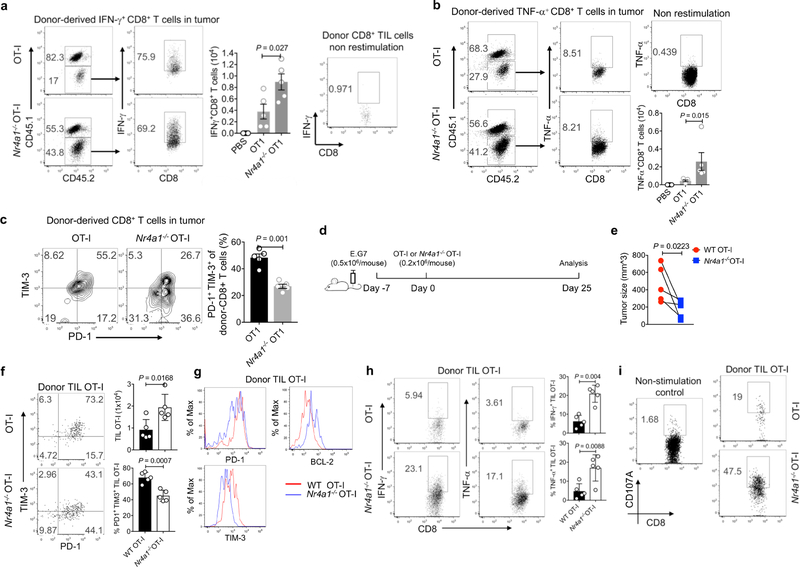
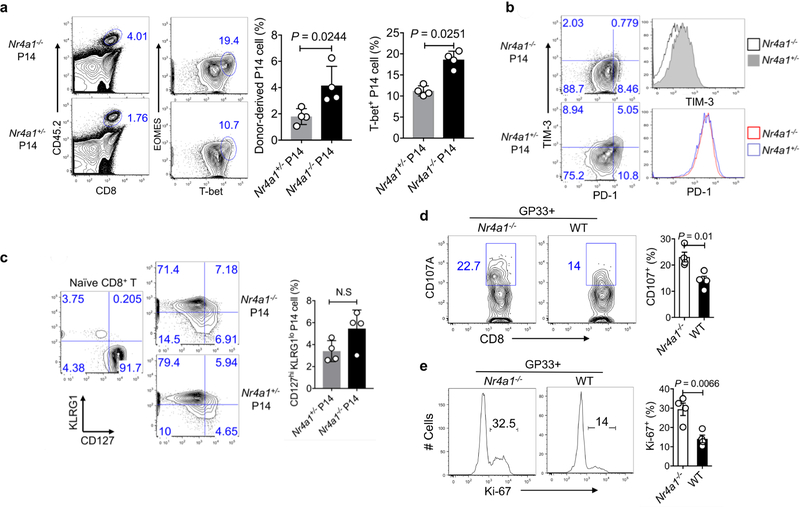
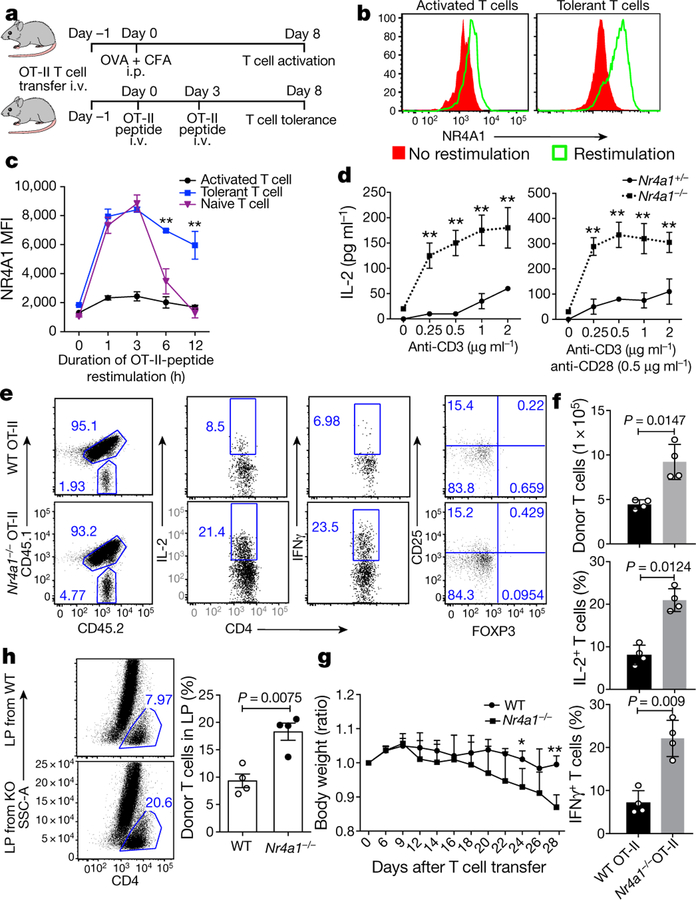
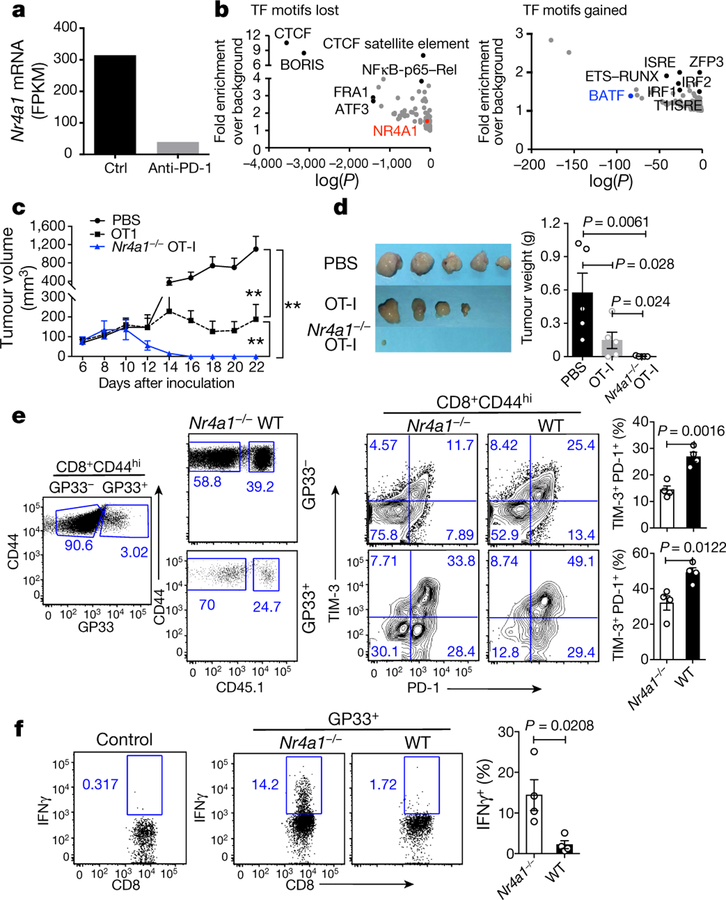
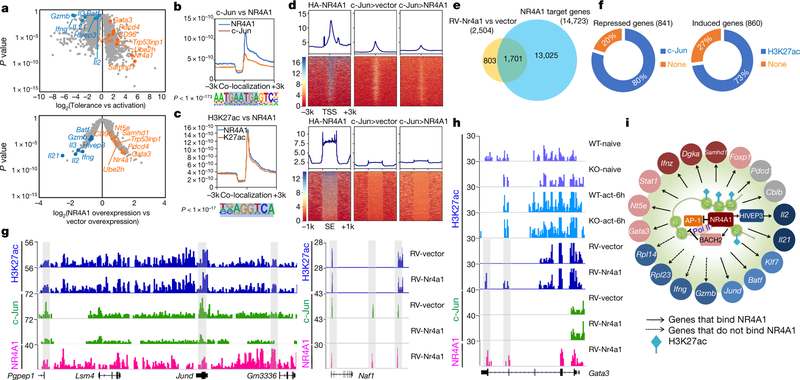
T cells become dysfunctional when they encounter self antigens or are exposed to chronic infection or to the tumour microenvironment1. The function of T cells is tightly regulated by a combinational co-stimulatory signal, and dominance of negative co-stimulation results in T cell dysfunction2. However, the molecular mechanisms that underlie this dysfunction remain unclear. Here, using an in vitro T cell tolerance induction system in mice, we characterize genome-wide epigenetic and gene expression features in tolerant T cells, and show that they are distinct from effector and regulatory T cells. Notably, the transcription factor NR4A1 is stably expressed at high levels in tolerant T cells. Overexpression of NR4A1 inhibits effector T cell differentiation, whereas deletion of NR4A1 overcomes T cell tolerance and exaggerates effector function, as well as enhancing immunity against tumour and chronic virus. Mechanistically, NR4A1 is preferentially recruited to binding sites of the transcription factor AP-1, where it represses effector-gene expression by inhibiting AP-1 function. NR4A1 binding also promotes acetylation of histone 3 at lysine 27 (H3K27ac), leading to activation of tolerance-related genes. This study thus identifies NR4A1 as a key general regulator in the induction of T cell dysfunction, and a potential target for tumour immunotherapy.


Figures

Extended Data Fig. 1
Extended Data Fig. 1. Comparison of gene expression profiles among CD4+ T cell subsets including Ttol, TH1, TH2, T H17, nTreg, naive T, TNF-AT and Texh cells.
a, Hierarchical clusters for six groups of CD4+ T cells. The colour coding indicates the expression level of 10,462 genes, with 0 as the median. All of the samples, except nTreg cells, were duplicated. b, Hierarchical clustering and principal component analysis of six types of CD4+ T cells (Ttol , naive, TH1, TH2, TH17 and nTreg). n = 2 (naive, TH1, TH2, TH17 and Ttol); n = 1 (nTreg). c, Correlation analysis of CD4+ T cell subsets using a k shared nearest neighbours classification algorithm. d, Ingenuity pathway analysis (IPA) of differentially expressed genes in Ttol cells, with twofold as the cut-off. e, Venn diagram comparison of Ttol cell-relevant genes with TNF-AT cell-and Texh cell-relevant genes.
Extended Data Fig. 2
Extended Data Fig. 2. Distribution of H3K4me3 and H3K27me3 peaks in mouse CD4+ T cells.
a, Summaries of H3K4me3 and H3K27me3 peaks in mouse CD4+ T cells including Ttol, TH1, TH2, TH17, nTreg, iTreg and naive T cells. The mouse genome (mm9) is divided into four regions: promoter (1 kb upstream and downstream of the TSS), exon, intron and intergenic regions. For each sample, the total number of identified islands is listed, followed by the number of islands for each genomic region (with the percentage of the total). b, Distribution of H3K4me3 and H3K27me3 modifications within gene bodies in mouse CD4+ T cells. TxStart, start of transcription; TxEnd, end of transcription. c, Comparison of global distribution of H3K27me3 modifications at promoter, exon, intron and intergenic regions among different T cell subsets. d, Percentage of genes associated with H3K4me3 alone (K4), H3K27me3 alone (K27), both H3K4me3 and H3K27me3 (K4&K27), or neither (None), for each T cell subset as indicated. e, H3K4me3 and H3K27me3 histone modifications across the Ifng, Il4 and Il17a gene loci in indicated T cell subsets. f, Genome-wide H3K4me3 and H3K27me3 histone modifications across the gene loci for three master transcription factors (Tbx21, Gata3 and Rorc) for indicated T cell subsets. g, H3K4me3 and H3K27me3 histone modifications across the T cell-anergy-related genes Egr3, Dgkz and Cdkn2a, and the T cell-exhaustion-related genes Lag3, Pdcd1 and Tigit, for indicated T cell subsets. h, H3K4me3 and H3K27me3 modifications as well as gene expression profiles were normalized separately with GeneSpring software. Hierarchical clusters of gene modules of transcription factors, nucleosomes, ribosomes, spliceosome/RNA processing, mitochondria, ubiquitination and proteasome are shown. The colour coding depicts the normalized value for each gene based on the following scales: expression (−2 to +2), H3K4me3 (−2 to +3) and H3K27me3 (−1 to +3), with 0 as the median.
Extended Data Fig. 3
Extended Data Fig. 3. NR4A1 is stably overexpressed in Ttol cells.
ac, Naive OT-II cells were transferred into naive CD45.1+ (B6SJL) recipient mice, followed by either intraperitoneal injection of OVA emulsified in CFA (activated group), or intravenous injection of soluble OT-II peptide (500 μg per mouse) twice at day 0 and day 3 (tolerant group). Eight days later, donor-derived T cells were sorted from spleens and assessed. a, Sorted donor-derived T cells from the activated and tolerant groups of mice were restimulated with plate-coated anti-CD3 for different periods of time (3 h or 6 h). Flow cytometry analysis of NR4A1 expression. b, qRT–PCR measurement of T cell activation-related and tolerance-related genes. *P < 0.05, **P < 0.01. c, Sorted donor-derived T cells and naive OT-II cells were restimulated with peptide-loaded APCs in vitro for 3 h. Flow cytometry analysis of NR4A1 expression. d, qRT–PCR measurement of gene expression in RV-Nr4a1-GFP-and empty vector-transduced CD4+ T cells under neutral polarization conditions. e, Flow cytometry analysis of IFNγ, IL-4, IL-17A and FOXP3 in RV-vector-GFP-or RV-Nr4a1-GFP-infected CD4+ T cells under TH1, TH2, TH17 and iTreg cell polarization conditions. n = 3 mice per group. P values were calculated using a two-sided unpaired Student’s t-test. All data are representative of two independent experiments and graphs show mean ± s.d.
Extended Data Fig. 4
Extended Data Fig. 4. Deletion of NR4A1 in T cells results in overexpression of IL-2 and IFN γ.
a, qRT–PCR measurement of expression of Nr4a1, Il2 and Ifng in wild-type and Nr4a1−/− CD4+ and CD8+ T cells stimulated with plate-coated anti-CD3 and anti-CD28 at indicated time points. b , Flow cytometry analysis of IFNγ and IL-17A expression in wild-type and Nr4a1−/ − CD4+ and CD8+ T cells from lymph nodes (LN) and spleens (SP). c, ELISA measurement of IFNγ and IL-2 expression in splenocytes from wild-type and Nr4a1−/ − mice in the context of food oral tolerance. PBS-treated mice were used as a control group. *P < 0.05. OD, optical density. d, Equal amounts of CD45.1+ wild-type and CD45.2+Nr4a1−/− bone marrow cells (4 × 10⁶ per mouse) were transferred into Rag1−/− mice. Flow cytometry analysis of CD4+FOXP3+ Treg cells in thymus, spleen and lymph nodes (LN) from chimeric mice two months after reconstitution. Six-week-old mice; n = 3 per group (ac); n = 4 per group (d). P values were calculated using a two-sided unpaired Student’s t-test. N.S., not significant. All data are representative of two independent experiments and graphs show mean ± s.d.
Extended Data Fig. 5
Extended Data Fig. 5. Deletion of NR4A1 in T cells exacerbates colitis.
a, Wild-type and Nr4a1−/− CD4+CD45RBhi T cells (4 × 10 5 per mouse) were transferred into Rag1−/− mice. Mice were euthanized four weeks after T cell transfer. Donor-derived T cells were collected from the lamina propria and analysed for IFNγ and IL-17A expression by flow cytometry. n = 4 per group. b, Caeca and colons were collected from Rag1−/− mice with wild-type or Nr4a1−/− CD4+ T cells. n = 4 per group. c, Haematoxylin and eosin staining of colon tissues. d. Flow cytometry analysis of donor-derived CD25+FOXP3+ Treg cells in lamina propria (LP), mesenteric lymph nodes (mLN) and spleens (SP) 28 days after T cell transfer. All data are representative of two independent experiments with similar results.
Extended Data Fig. 6
Extended Data Fig. 6. Deletion of NR4A1 in CD8+ T cells enhances immunity against tumours.
ac, CD45.1+CD45.2+ (B6SJL × C57BL6) recipient mice were injected subcutaneously with E.G7 tumour cells (5 × 10⁵ cells per mouse) in one flank. Six days later, the mice were adoptively transferred with PBS, wild-type or Nr4a1− /− OT-I cells (3 × 10⁶ cells per mouse) intravenously. Mice were euthanized 6 days after T cell transfer. Donor-derived T cells were collected from tumour, draining lymph nodes and spleens, and subjected to flow cytometry analysis. a, b, Flow cytometry analysis and quantification of IFNγ expression (a ) and TNF expression (b ) in donor-derived T cells from tumours. c, Flow cytometry analysis and quantification of the T cell exhaustion surface markers PD-1 and TIM-3 in tumour-infiltrating donor T cells. d, Experimental strategy for assay of adoptively transferred T cells in tumour-bearing mice. e, Sizes of E.G7 tumour. f, Flow cytometry analysis of PD-1 and TIM-3 expression in tumour-infiltrating donor cells, and quantification of total cellularity of tumour infiltrating donor cells. g, Histogram showing PD-1, TIM-3 and BCL-2 expression in tumour-infiltrating donor T cells. h, Flow cytometry analysis and quantification of IFNγ and TNF expression in tumour-infiltrating donor cells after OT-I peptide restimulation. i, Flow cytometry analysis and quantification of CD107A expression in tumour-infiltrating donor cells. n = 5 mice (8 weeks old) per group. P values were calculated using a two-sided unpaired Student’s t-test. Data are representative of three individual experiments and graphs show mean ± s.d.
Extended Data Fig. 7
Extended Data Fig. 7. NR4A1 deficiency promotes CD8+ T cell effector function during viral infection.
ac, Congenic CD45.1+B6SJL mice received equal amounts of CD45.2+ Nr4a1− /− cells or Nr4a1+/− P14 cells (1 × 10⁴ per mouse) and were infected with LCMV-Armstrong at the dosage of 2 × 10 5 PFU. Eight days after infection, mice were euthanized and donor cells were assessed. a, Flow cytometry analysis and quantification of EOMES and T-bet expression in Nr4a1−/− and Nr4a1+/− P14 cells in the spleen. b, Flow cytometry analysis and quantification of PD-1 and TIM-3 expression in Nr4a1−/ − and Nr4a1+/− P14 cells in the spleen. c, Flow cytometry analysis and quantification of KLRG1 and CD127 expression in Nr4a1−/− and Nr4a1+/ P14 cells in the spleen. d, e, Chimeric mice were generated by transferring equal amounts of CD45.1+ wild-type and CD45.2+ Nr4a1−/− bone marrow cells into Rag1−/− mice. Eight weeks after reconstitution, mice were infected with LCMV-clone 13. Four weeks after infection, wild-type and Nr4a1−/− CD8+ T cells in the spleen were analysed by flow cytometry. d, Flow cytometry analysis of CD107A in splenic wild-type and Nr4a1−/− GP33+CD8+ T cells after GP33 peptide restimulation. e, Flow cytometry analysis of Ki-67 in splenic wild-type and Nr4a1−/− GP33 +CD8+ T cells after GP33 peptide restimulation. n = 4 per group. P values were calculated using a two-sided unpaired Student’s t-test. Data are representative of two individual experiments and graphs show mean ± s.d.
Extended Data Fig. 8
Extended Data Fig. 8. ChIP–seq and data analysis of NR4A1 and H3K27ac in CD4+ T cells.
a, Venn diagram shows the numbers of genes that were significantly upregulated or downregulated in Ttol cells and RV-Nr4a1-GFP-transduced CD4+ T cells. b, RV-vector-and RV-Nr4a1-transduced CD4+ T cells were subjected to intracellular staining by primary rabbit monoclonal anti-HA antibody and secondary Alexa Fluor 647-conjugated goat anti-rabbit IgG antibody. Data are representative of two individual experiments. c , ChIP–seq dataset for NR4A1 in RV-Nr4a1-transduced CD4 + T cells was generated using anti-HA antibody. Pie chart represents the genome-wide distribution of NR4A1 occupancy in promoter, exon, intron and intergenic regions in RV-Nr4a1-transduced CD4+ T cells, after peak calling and subtraction of IgG control peaks. d, Venn diagram of NR4A1-regulated genes, Ttol cell-related genes and NR4A1-targeted genes. e, NR4A1-binding consensus in CD4+ T cells. SICER v.1.1 was used to identify significant peaks (FDR of 5%), with input DNA (ChIP–seq) as the control. The library was screened (using hypergeometric enrichment calculations in the HOMER program) for reliable NR4A1 motifs; each enriched motif with a specific P value. Top, the most representative NR4A1 motifs in CD4+ T cells based on the P values. Bottom, the classical NR4A1-binding consensus sequence. Detailed information for ChIP–seq samples is provided in Supplementary Table 5. n = 1 for ChIP–seq samples. f, Genome-wide co-localization of c-Jun with NR4A1-binding sites in CD4+ T cells. Histogram indicates the number of peaks at various distances from NR4A1 to c-Jun peak summits. Binomial tests were used to determine peak significance within ChIP–seq data, and a threshold of FDR < 0.01 was used for peak calling. g, ChIP–seq for H3K27ac (K27ac) was performed on naive (0 h) and six-hour (6 h)-activated wild-type and Nr4a1−/− (KO) CD4+ T cells, as well as RV-vector-and RV-Nr4a1-transduced CD4+ T cells. Genome-wide distributions and heatmaps are shown for H3K27ac around TSS and super-enhancer regions.
Extended Data Fig. 9
Extended Data Fig. 9. NR4A1 inhibits recruitment of AP-1 components in CD4+ T cells.
a, Top, EMSA analysis of AP-1 binding. Using the AP-1 consensus motif as a probe, DNA binding was performed on nuclear extracts from empty vector or RV-Nr4a1-GFP-transduced CD4+ T cells stimulated with PMA/ionomycin (PMA/Iono) for the indicated time periods. Super-shift experiments (lane 3) were conducted in the presence of anti-c-Jun antibody. An OCT-1-binding consensus probe was used as a control. Bottom, western blotting (WB) analysis of c-Fos, c-Jun and lamin B1 in nuclear extract. b, Luciferase reporter assay to measure the effect of NR4A1 on AP-1-and NF-AT-mediated transcription. RV-Nr4a1-GFP or empty vector were co-transfected with AP-1 or NF-AT reporter constructs into pre-activated T cells and treated with PMA and ionomycin for 6 h. Cell samples were lysed and luciferase activity was assessed. c, Naive CD4+ T cells were sorted from wild-type and Nr4a1−/− mice and activated with plated anti-CD3 and anti-CD28 for 36 or 72 h. Activated T cells were collected and subjected to ChIP assay using anti-c-Jun antibody, followed by qPCR analysis. Graphs show ChIP–qPCR measurement of c-Jun enrichment at the Jund locus and Pgpep1 and Naf1 promoter regions. Chr, chromosome. d, Distribution of H3K27ac peaks at the Il2 locus in naive and 6-h-activated wild-type and NR4A1 knockout CD4+ T cells, as well as RV-vector-and RV-Nr4a1-transduced CD4+ T cells; and distribution of NR4A1 peaks at the Il2 locus in RV-Nr4a1-transduced CD4+ T cells. e, ChIP–qPCR measurement of c-Jun enrichment at the Il2 locus in wild-type and Nr4a1−/ − CD4+ T cells activated with plated anti-CD3 and anti-CD28 for 36 or 72 h. f, H3K27ac and NR4A1 peaks at the Nr4a1, Bach2 , Nt5e and Samhd1 loci in RV-vector-and RV-Nr4a1-transduced CD4+ T cells. g, H3K27ac and NR4A1 peaks at the Hivep3 locus in naive and 6-h-activated wild-type and NR4A1 knockout CD4+ T cells, as well as RV-vector-and RV-Nr4a1-transduced CD4 + T cells. h , H3K27ac and NR4A1 peaks at Pdcd1, Havcr2 and Lag3 loci. For d , fh, SICER v.1.1 was used to identify significant peaks (FDR of 5%) with input DNA (ChIP– seq) as the control. Detailed information for ChIP–seq samples is provided in Supplementary Table 5. n = 3 (b, c, e); n = 1 (d, fh ). P values were calculated using a two-sided unpaired Student’s t-test; NS, not significant. Data are representative of two individual experiments and graphs show mean ± s.d.
Fig. 1
Fig. 1. Ttol cells exhibit distinct transcriptional and epigenetic features.
a, Experimental strategy for generating activated or tolerant T cells in vitro. WT, wild type. b, Heatmap of 2,357 genes for four groups of T cells (TH1, TH2, TH17 and Ttol). The colour coding indicates the expression level of 2,357 genes, with 0 as the median (gene expression level standardized by z-score). c, Circos plots showing overlapping genes in five gene modules from Ttol, TNF-AT and Texh cells. Line connections indicate shared genes between groups. d, Comparison of global distribution of H3K4me3 modifications at promoter, exon, intron and intergenic regions among Ttol, naive, TH1, T H2, TH17, iTreg and nTreg cells. e, Histone modifications of H3K4me3 and H3K27me3 in the Ttol cell-related genes Tagap1, Clec2i and Nr4a1, among Ttol, naive, TH1, TH 2 and TH17 cells. Experiments or analyses were independently repeated twice with similar results (a, d, e).
Fig. 2
Fig. 2. NR4A1 is required for T cell tolerance formation.
a, Experimental strategy for OT-II peptide-induced CD4+ T cell tolerance in vivo. CFA, complete Freund’s adjuvant; i.p., intraperitoneally; i.v., intravenously. b, Flow cytometry measurement of NR4A1 expression in sorted donor-derived T cells after restimulation with OT-II peptide-loaded APCs for 3 h. c, Quantification of NR4A1 expression (mean fluorescence intensity; MFI) in naive T cells and donor-derived T cells from both activated and tolerant groups, after restimulation with OT-II peptide-loaded APCs. d, ELISA measurement of IL-2 from Nr4a1+/− and Nr4a1−/− CD4+ T cells activated either by anti-CD3 alone or by anti-CD3 and anti-CD28 in a dosage-dependent manner. e, Flow cytometry analysis of IFNγ, IL-2 and FOXP3 expression in wild-type and Nr4a1−/− OT-II T cells in spleens in the context of peptide-induced tolerance. f , Quantification of donor-derived wild-type and Nr4a1−/ − OT-II T cells. g, Body weight measurement (shown as ratio compared with original body weight) of Rag1−/− mice after receiving wild-type or Nr4a1/−/− naive CD4+ CD45RBhi T cells. h, Flow cytometry analysis of donor-derived T cells in lamina propria (LP) four weeks after T cell transfer. KO, knockout. Eight-week-old mice; n = 3 (c, d); n = 4 (fh). *P < 0.05, **P < 0.01 (two-sided unpaired Student’s t-test). Data are representative of at least two individual experiments and are presented as mean ± s.d.
Fig. 3
Fig. 3. Disruption of NR4A1 prevents T cell exhaustion caused by tumour and viral infection.
a, Nr4a1 mRNA levels (measured as fragments per kilobase of exon per million fragments mapped (FPKM) in OVA-specific CD8+ tumour-infiltrating lymphocytes (TILs) from E.G7 tumour cell-bearing mice treated with control (ctrl) or anti-PD-1 antibodies. RNA-seq data were obtained from the GEO accession GSE110249. b, Analysis of open chromatin regions lost (left) or gained (right) in OVA-specific CD8+ TILs following anti-PD-1 treatment. Assay for transposase-accessible chromatin using sequencing (ATAC-seq), combined with assessment of enrichment of transcription factor (TF)-binding motifs. n = 6 mice per group. Data are mean ± s.e.m and P values were calculated using one-way analysis of variance (ANOVA). c, Growth of E.G7 tumour in mice receiving PBS, wild-type or Nr4a1−/− OT-I cells (3 × 10⁶ cells per mouse). d, Representative images of tumours from mice 22 days after transplant. e, Flow cytometry measurement and quantification of TIM-3 and PD-1 expression in splenic wild-type and Nr4a1−/− CD8+ T cells (both GP33+ and GP33) in the context of LCMV-clone 13 infection. f, Flow cytometry analysis of IFNγ expression in splenic wild-type and Nr4a1−/− GP33+CD8+ T cells. n = 5 (c, d); n = 4 (e, f,). *P < 0.05, **P < 0.01 (two-sided unpaired Student’s t-test). Experiments were independently repeated three times (c, d) or twice (a, b, e, f). Data are mean ± s.d.
Fig. 4
Fig. 4. NR4A1-mediated transcriptional regulation of T cell tolerance.
a, Volcano plot comparison of 2,357 Ttol genes with 2,504 NR4A1-regulated genes (retrovirus RV-Nr4a1-GFP versus vector control). Blue, downregulated genes; orange, upregulated genes. Microarray data were analysed with the ‘limma’ package in R. The x axis values represent log2 (gene expression in Ttol/gene expression in activated T cells) (top), and log2(NR4A1 overexpression/vector overexpression) (bottom). n = 2 per group. A false discovery rate (FDR) < 0.05 was used as the threshold for significance. b, c, The library was screened (using hypergeometric enrichment calculations in the HOMER program) for reliable motifs that could be used as targets; each enriched motif with a specific P value. b, Top, genome-wide comparison of c-Jun and NR4A1 binding; bottom, top binding motif for regions of co-localization. c, Top, genome-wide comparison of H3K27ac peaks and NR4A1 binding; bottom, top binding motif for overlapping regions. d, Heatmaps for genome-wide distribution of NR4A1 and c-Jun peaks at TSSs and super-enhancer (SE) regions in RV-vector-and RV-Nr4a1-transduced CD4+ T cells. HA, haemagglutinin. e, Venn diagram of NR4A1-regulated genes and NR4A1-bound genes. f, Left, percentage of genes directly repressed by NR4A1 that showed a reduction of c-Jun recruitment; right, percentage of induced genes that were marked with NR4A1-orchestrated H3K27ac. g, H3K27ac, c-Jun and NR4A1 peaks at the Pgpep1, Jund and Naf1 gene loci in RV-vector-and RV-Nr4a1-transduced CD4+ T cells. h, H3K27ac, c-Jun and NR4A1 peaks at the Gata3 locus in naive and 6-h-activated wild-type and NR4A1 knockout CD4+ T cells, as well as RV-vector-and RV-Nr4a1-transduced CD4+ T cells. i, Integrated network analysis that identifies NR4A1-centred transcriptional modules. Colours indicate expression levels: red, higher; blue, lower; grey, minor or no change. More detail for ChIP–seq samples (bd, fh; n = 1) is provided in Supplementary Table 5. Peaks with FDR of 5% (versus control input DNA) were considered as significant.

Comment in

  • What's driving T cell dysfunction?
    Flemming A. Flemming A. Nat Rev Immunol. 2019 Apr;19(4):199. doi: 10.1038/s41577-019-0152-5. Nat Rev Immunol. 2019. PMID: 30858495 No abstract available.
  • What's driving T cell dysfunction?
    Flemming A. Flemming A. Nat Rev Cancer. 2019 May;19(5):251. doi: 10.1038/s41568-019-0138-4. Nat Rev Cancer. 2019. PMID: 30936467 No abstract available.

References

    1. Wherry EJ & Kurachi M Molecular and cellular insights into T cell exhaustion. Nat. Rev. Immunol 15, 486–499 (2015). - PMC - PubMed
    1. Nurieva R et al. T-cell tolerance or function is determined by combinatorial costimulatory signals. EMBO J 25, 2623–2633 (2006). - PMC - PubMed
    1. Greenwald RJ, Freeman GJ & Sharpe AH The B7 family revisited. Annu. Rev. Immunol 23, 515–548 (2005). - PubMed
    1. Nurieva RI, Liu X & Dong C Molecular mechanisms of T-cell tolerance. Immunol. Rev 241, 133–144 (2011). - PMC - PubMed
    1. Anderson AC, Joller N & Kuchroo VK Lag-3, Tim-3, and TIGIT: co-inhibitory receptors with specialized functions in immune regulation. Immunity 44, 989–1004 (2016). - PMC - PubMed

Publication types

MeSH terms

Substances