. 2019 Mar;567(7747):187-193.
doi: 10.1038/s41586-019-0984-y. Epub 2019 Feb 27.

An integrative systems genetic analysis of mammalian lipid metabolism

Affiliations

An integrative systems genetic analysis of mammalian lipid metabolism

Benjamin L Parker et al. Nature. 2019 Mar.

Abstract

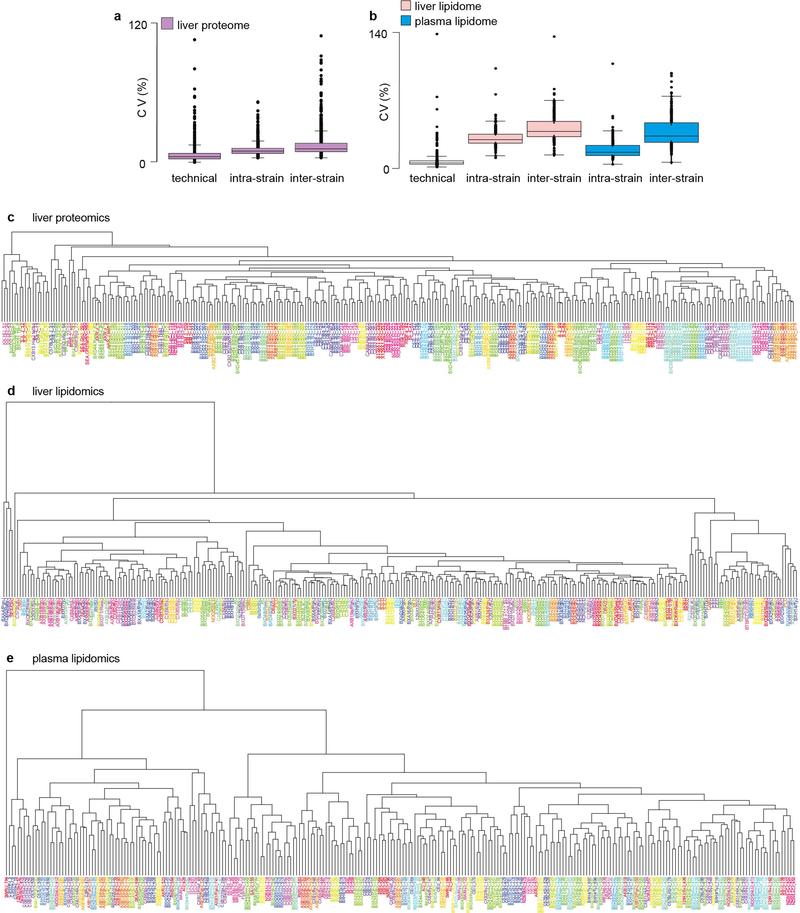
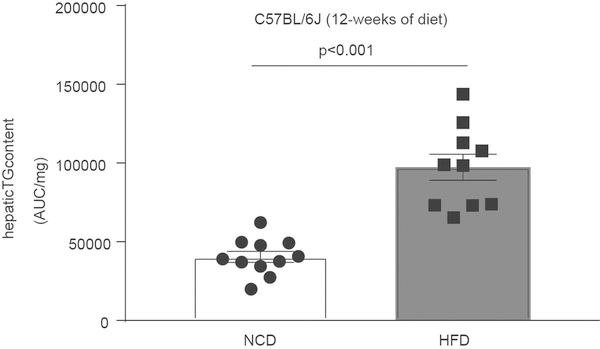
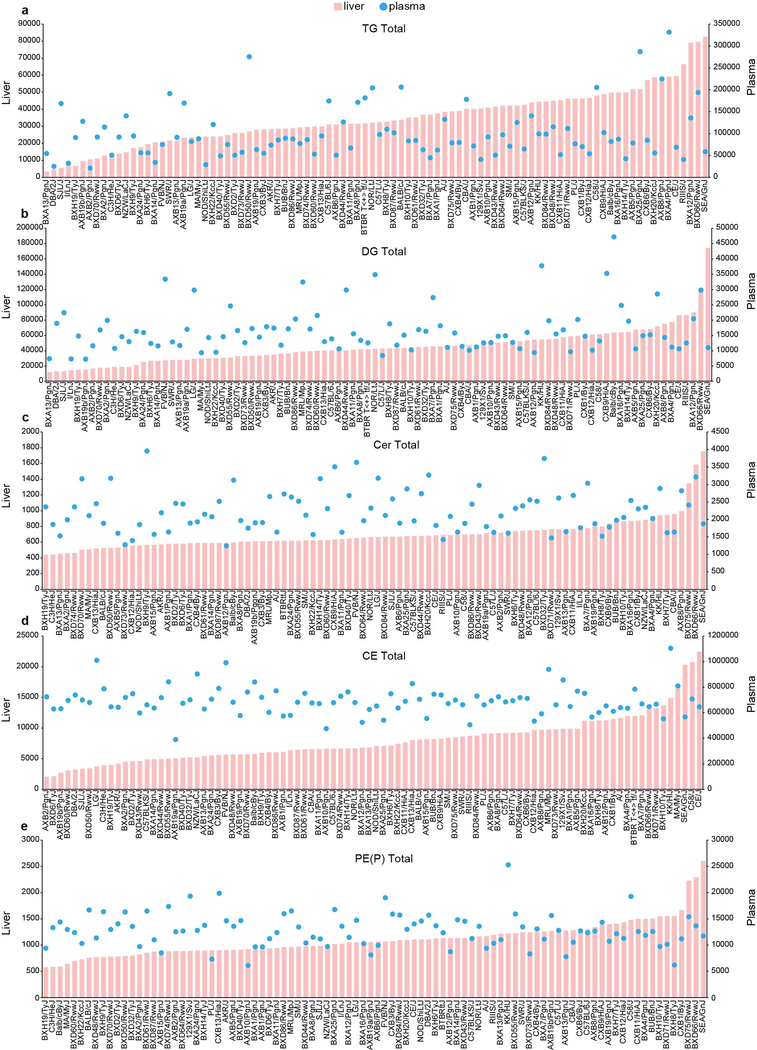
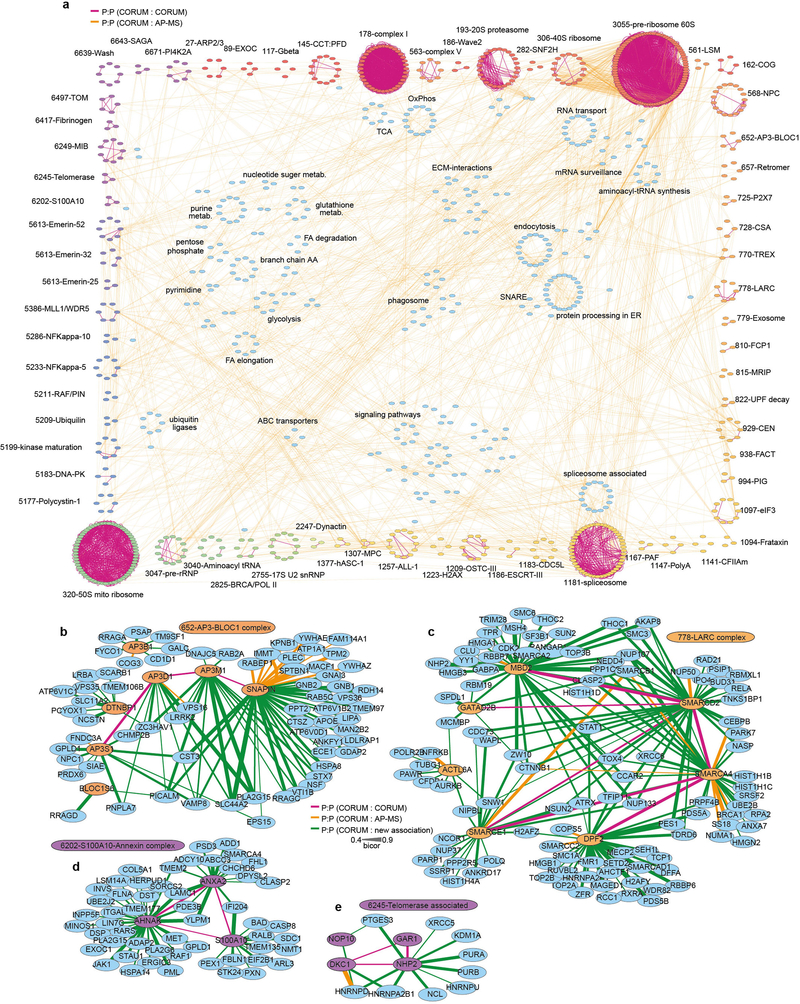
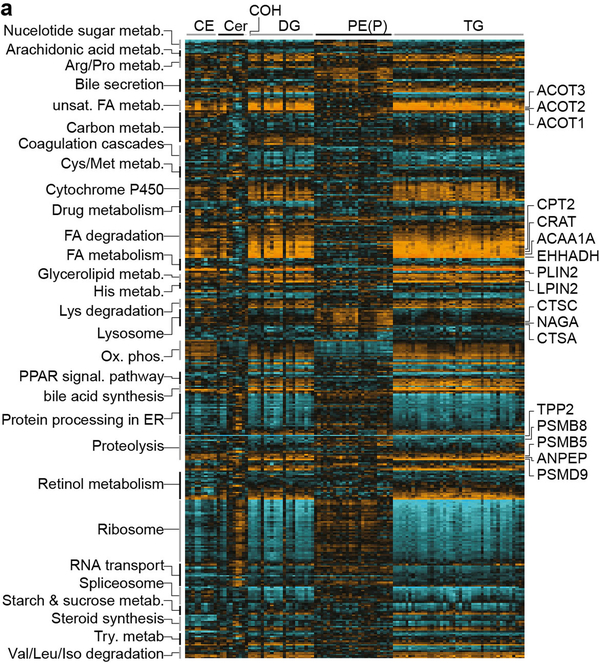
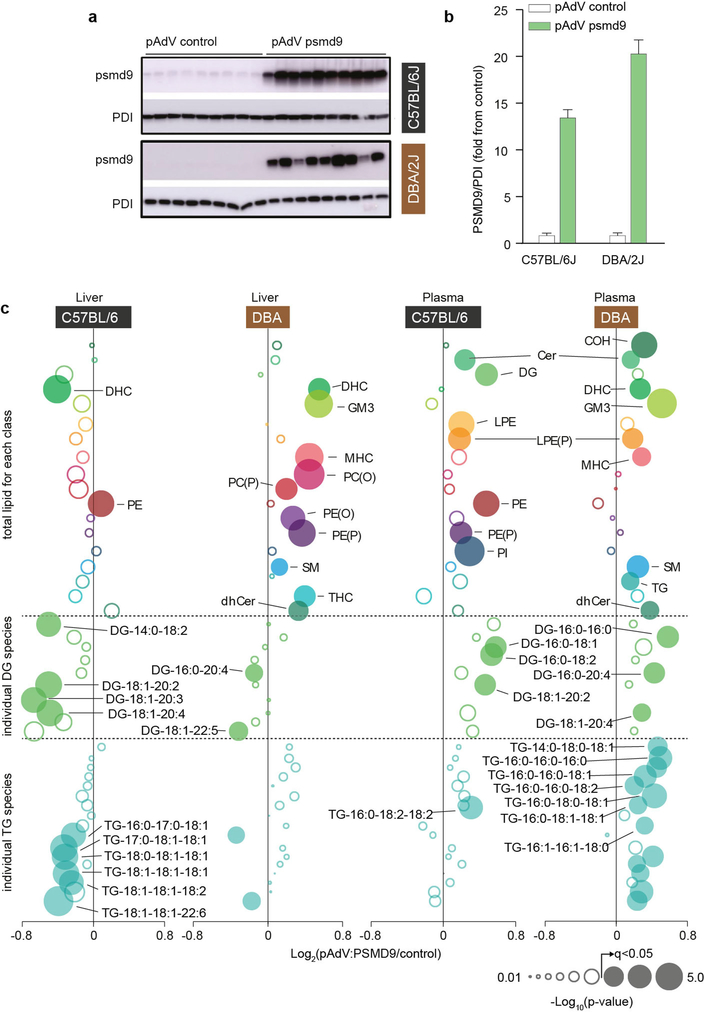
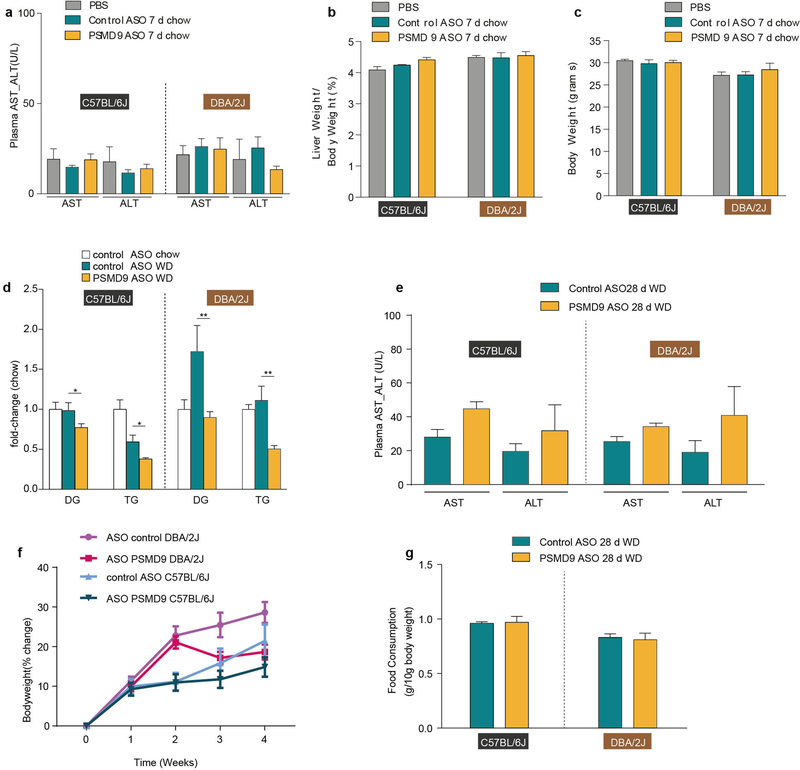
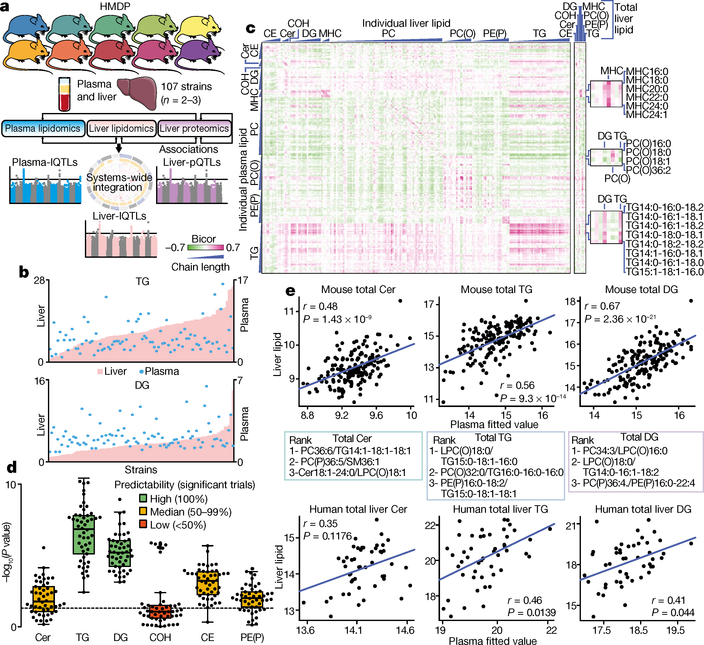
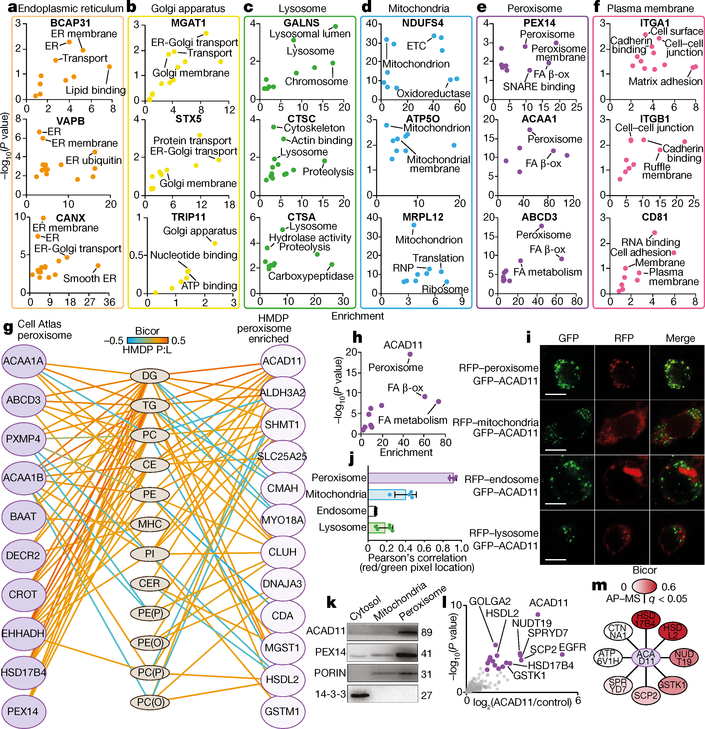
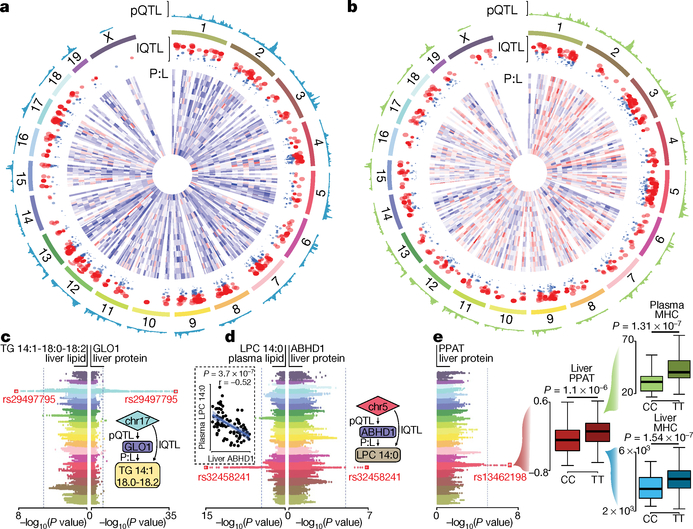
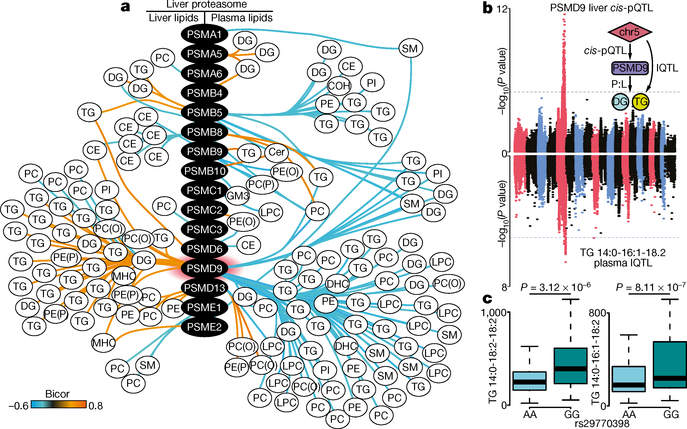
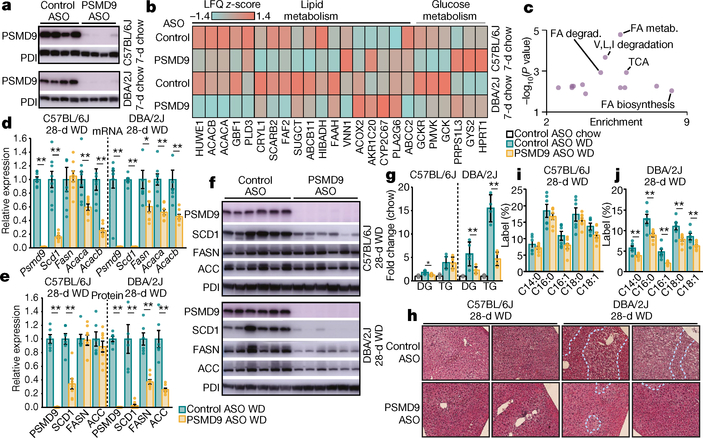
Dysregulation of lipid homeostasis is a precipitating event in the pathogenesis and progression of hepatosteatosis and metabolic syndrome. These conditions are highly prevalent in developed societies and currently have limited options for diagnostic and therapeutic intervention. Here, using a proteomic and lipidomic-wide systems genetic approach, we interrogated lipid regulatory networks in 107 genetically distinct mouse strains to reveal key insights into the control and network structure of mammalian lipid metabolism. These include the identification of plasma lipid signatures that predict pathological lipid abundance in the liver of mice and humans, defining subcellular localization and functionality of lipid-related proteins, and revealing functional protein and genetic variants that are predicted to modulate lipid abundance. Trans-omic analyses using these datasets facilitated the identification and validation of PSMD9 as a previously unknown lipid regulatory protein. Collectively, our study serves as a rich resource for probing mammalian lipid metabolism and provides opportunities for the discovery of therapeutic agents and biomarkers in the setting of hepatic lipotoxicity.


Conflict of interest statement

Competing interests R. Lee holds shares in Ionis Pharmaceuticals. B.G.D., A.C.C., T.Q.d.A.V. and D.E.J. are inventors on patent PCT/AU2019/050033 pertaining to aspects of the PSMD9 work. All other authors declare no competing interests.

Figures

Extended Data Fig. 1 |
Extended Data Fig. 1 |. Assessment of proteomic and lipidomic data reproducibility.
a, b, Coefficient of variation (CV) analysis of the proteomics (a) and lipidomics (b) data. Box-and-whisker plots (described as in Fig. 3e). c–e, Unsupervised hierarchical clustering of the liver proteomics (c), liver lipidomics (d) and plasma lipidomics (e) data.
Extended Data Fig. 2 |
Extended Data Fig. 2 |. Total liver triacylglycerol levels in C57BL/6J mice.
Mice were fed either a normal chow diet (NCD) or a high-fat diet (HFD) for 12 weeks. P value determined by Student’s t-test. Data are mean ± s.e.m., n = 11 chow group; n = 10 HFD group.
Extended Data Fig. 3 |
Extended Data Fig. 3 |. Average strain abundance of designated lipid classes in liver and plasma.
a–e, Abundance is expressed as area under the curve per mg liver protein or per ml of plasma. Liver scale on left, plasma scale on right a, Triacylglycerol. b, Diacylglycerol. c, Ceramide. d, Cholesterol esters. e, PE(P).
Extended Data Fig. 4 |
Extended Data Fig. 4 |. Correlation network analysis of the HMDP liver proteome.
a, Protein:protein (P:P) correlations in the HMDP liver proteome, integrated with CORUM-annotated proteins and protein interactions previously identified by AP–MS. Numbers indicate CORUM accessions, orange lines are HMDP P:P correlations; purple lines are correlations observed in both HMDP and CORUM. b–e, P:P correlations of selected CORUM complexes including associations not previously identified by AP–MS (green lines). Biweight midcorrelation analyses performed using ranked Benjamin–Hochberg multiple comparison test. Purple lines are known CORUM interactions, orange lines are HMDP P:P and CORUM interactions, green lines are previously unidentified interactions from HMDP P:P data. A thicker line represents a higher bicor value (q < 0.05, n > 50 strains).
Extended Data Fig. 5 |
Extended Data Fig. 5 |. Biweight midcorrelation of 108 liver lipid species against 378 liver proteins mapped onto annotated KEGG pathways.
Highlighted are various correlations (orange is positive, aqua is negative) between individual lipid species and proteins in pathways associated with unsaturated fatty acid metabolism, fatty acid degradation and metabolism, lysosomal degradation, and proteolysis. Only proteins containing more than one significant correlation to a lipid and annotated to the KEGG database are shown (biweight midcorrelation using ranked Benjamin–Hochberg multiple comparison test, q < 0.05, n > 50).
Extended Data Fig. 6 |
Extended Data Fig. 6 |. Overexpression of PSMD9 in C57BL/6J and DBA/2J mice.
Adenoviral overexpression of PSMD9 in C57BL/6J and DBA/2J mice (n = 9, 7 days after tail-vein injection of 109 plaque-forming units). a, b, Western blot (a) and densitometry (b) of PSMD9 and PDI (loading control) in the livers of mice treated with either control adenovirus (pAdV) or PSMD9 adenovirus. Data are mean ± s.e.m. c, Liver and plasma lipidomics of adenovirus-treated mice. Top panel (above first dotted line) shows relative fold change of total lipid classes. Middle and bottom panels show relative fold changes of individual diacylglycerol and triacylglycerol lipid species, respectively. P values determined by t-test with permutation-based FDR correction. Filled bubbles are significant (q < 0.05) changes, larger bubbles indicate greater significance.
Extended Data Fig. 7 |
Extended Data Fig. 7 |. ASO knockdown of PSMD9 in C57BL/6J and DBA/2J mice.
a-c, Assessment of hepatotoxicity as measured by plasma levels (U/L) of aspartate transaminase (AST) and alanine transaminase (ALT) (a), percentage of liver weight to body weight (b) and total body weight (c) of mice on a normal chow diet and treated with PBS, control ASO or PSMD9 ASO for 7 days (n = 4 per group, twice-weekly injection at 25 mg kg−1). d, Lipidomic analysis of total diacylglycerols and triacylglycerols in the plasma of mice on a chow diet (n = 4 C57BL/6J, n = 3 DBA/2J mice per group) or a Western diet (n = 6 mice per group, except n = 5 DBA/2J control ASO mice per group) and treated with either control or PSMD9 ASOs (twice-weekly ASO injection at 25 mg kg−1). e–g, Assessment of hepatotoxicity as measured by plasma AST and ALT levels (e), percentage change in body weight from baseline (f), and food consumption normalized to body weight (g) from in vivo de novo lipogenesis experimental animals (n = 6 control ASO, n = 8 PSMD9 ASO, 28 days on diet and weekly injection of ASO injection at 25 mg kg−1). *P < 0.05, **P < 0.01 control ASO versus PSMD9 ASO, t-test. Data are mean ± s.e.m.
Fig. 1 |
Fig. 1 |. Lipidomic analysis of HMDP provides unique insights into lipid regulation and prediction.
a, Study overview depicting integration of systems genetic and correlation analysis in replicate mice from the HMDP. b, Fold change in plasma (blue dots) and liver (pink bars) triacylglycerol (TG) and diacylglycerol (DG) abundance across all strains of the HMDP. Data shown as fold change from the lowest strain = 1. Left, liver scale; right, plasma scale. c, Heat map of biweight midcorrelation of 190 lipid species between plasma (rows) and liver (columns). CE, cholesterol ester; Cer, ceramide; COH, free cholesterol; MHC, monohexosylceramide; PC, phosphatidylcholine; PC(O), alkylphosphatidylcholine; PE(P), alkenylphosphatidylethanolamine. Bicor, biweight midcorrelation; positive values are in purple; negative values are in green. Plots on the right depict correlations between individual plasma lipids and total abundance of liver lipids. Zoomed boxes on the right highlight plasma lipids correlating with total MHC or total diacylglycerol or triacylglycerol. d, Linear model significance of procedure to predict hepatic abundance of indicated lipids (each dot represents an individual trial). Tests were classified into predictability based on the number of trials (n = 50) that passed significance (P < 0.05, dotted line). e, Pearson correlation of the linear model between the three indicated plasma lipid ratios and total liver lipid classes in mouse (HMDP) (top panels, n > 268 mice) and a human cohort of obese individuals (bottom panels; n = 58).
Fig. 2 |
Fig. 2 |. Subcellular co-regulated networks associated with lipid metabolism.
a–f, Enrichment analysis using Fisher’s exact test with Benjamini–Hochberg correction of the co-regulated protein networks associated with organelle-specific proteins validated in the Cell Atlas. g, Biweight midcorrelation analysis of peroxisome protein abundance with liver lipid abundance (red denotes positive; blue denotes negative) (n = 306 mice). Left, peroxisomal proteins annotated from the Cell Atlas; right, proteins highly correlated with the peroxisome in the HMDP network with no previous localization in the Cell Atlas. Edges denote only significant protein:lipid (P:L) correlations (n > 50 strains, q < 0.05). h, Enrichment analysis using Fisher’s exact test with Benjamini–Hochberg correction of the ACAD11 co-regulated proteome (n > 50 strains, q < 0.05) i, Representative confocal microscopy images (from ten images per well, in up to five biologically independent replicates) of green fluorescent protein (GFP)-tagged ACAD11 and red fluorescent protein (RFP)-tagged peroxisomal, mitochondrial, endosomal or lysosomal markers in HEK293 cells. Scale bars, 10 μm. j, Quantification (average of ten images per replicate) of confocal images plotting Pearson’s correlation r value of co-localized green and red pixels (ACAD11–GFP with RFP organelles). Data are mean ± s.e.m., n > 3. k, Western blots on cellular fractions of HEK293 cells for ACAD11, PEX14, PORIN and 14–3-3, representative of three independent experiments. l, Scatter plot showing enrichment of proteins identified by AP–MS of Flag-tagged ACAD11 in HEK293 cells. Purple dots denote significantly enriched (q < 0.05, n = 5 replicate wells). m, ACAD11 interaction network integrating proteins significantly enriched after AP–MS, and those that correlated (bicor) with ACAD11 in the HMDP network.
Fig. 3 |
Fig. 3 |. Systems genetic analysis of proteomic and lipidomic diversity in HMDP mice.
a, b, Circos plots summarizing global genomic regulation of hepatic protein and lipid abundance in liver (a) and plasma (b) of HMDP strains. Tracks from outside-in: (1) pQTL mapping in which height represents increasing −log10(P value) (n = 105 strains); (2) chromosomal coordinates according to mm10 genome; and (3) lQTLs in which all circles are significant (P < 1 × 10⁻⁴), with circle size corresponding to increasing −log10(P value) (n = 105 strains). Red circles meet Bonferroni genome-wide association study significance (P < 4.2 × 10⁻⁶). (4) Heat map showing protein:lipid (P:L) biweight midcorrelation (n = 306 mice) between each pQTL related protein and the indicated lQTL lipid species c, Back-to-back Manhattan plots highlighting a locus significantly (P < 4.2 × 10⁻⁶) associated with liver TG 14:1–18:0–18:2 abundance and liver GLO1 protein (n = 105 strains). Inset summarizes proposed genetic interaction. d, Back-to-back Manhattan plots highlighting a locus significantly associated with both plasma lysophosphatidylcholine (LPC) 14:0 abundance and liver ABHD1 protein levels. Inset (dashed line) shows Pearson correlation between liver ABHD1 and plasma LPC 14:0 (n = 306 mice), inset on right summarizes proposed genetic interaction. e, Manhattan plot highlighting a locus associated with abundance of liver PPAT protein (n = 105 strains), and box-and-whisker plots (black bars denote median; boxes denote upper and lower quartiles; whiskers denote extremes) demonstrating that allelic variation at the lead SNP (rs13462198) within the PPAT cis-pQTL is also associated with the abundance of monohexosylceramides in both the liver and plasma (n = 105 strains).
Fig. 4 |
Fig. 4 |. Proteasomal proteins including PSMD9 are correlated with lipid abundance.
a, Biweight midcorrelation analysis of proteasome-associated proteins against significantly correlated (FDR-corrected, q < 0.05) liver (left) and plasma (right) lipid species (n > 50 strains) (orange denotes positive bicor; aqua denotes negative bicor). PE, phosphatidylethanolamine; SM, sphingomyelin. b, Back-to-back Manhattan plots demonstrating a significant (P < 1 × 10⁻⁴) cis-pQTL for PSMD9 protein abundance on chromosome 5 (top), co-mapping to a significant lQTL (P < 4.2 × 10⁻⁶) for plasma TG 14:0–16:1–18:2 abundance (bottom) (n = 105 strains). Inset summarizes that SNPs on chromosome 5 (chr5) drive variation in PSMD9 protein abundance and plasma triacyl/diacylglycerol abundance, corroborated by a correlation (P:L, biweight midcorrelation, q < 0.05) between hepatic PSMD9 protein and plasma diacyl/triacylglycerol abundance. c, Box-and-whisker plots (described in Fig. 3e) demonstrating that homozygous allelic variation (AA versus GG) at the SNP rs29770398 within the PSMD9 locus significantly associates (P < 3 × 10⁻⁶) with abundance of plasma triacylglycerols TG 14:0–18:2–18:2 and TG 14:0–16:1–18:2 (n = 105 strains).
Fig. 5 |
Fig. 5 |. Modulating PSMD9 regulates hepatic and plasma lipid abundance in mice.
a, Western blots of PSMD9 and protein disulfide isomerase (PDI; loading control) in the livers of C57BL/6J and DBA/2J mice treated for 7 days (7-d) with control or PSMD9 ASOs (25 mg kg−1, n = 4 independent mice). b, Heat map of significantly (P < 0.05, analysis of variance (ANOVA)) regulated proteins from lipid and glucose metabolism pathways in the livers of C57BL/6J and DBA/2J mice treated with control or PSMD9 ASOs for 7 days (n = 4 mice per group). Scale represents average relative abundance (label-free quantification (LFQ) score). Orange denotes high abundance; aqua denotes low abundance. c, Pathway enrichment analysis of the 52 proteins significantly regulated by PSMD9 ASOs in both strains using Fisher’s exact test with Benjamini–Hochberg correction. FA, fatty acid. d, Relative mRNA expression in livers of both mouse strains fed a Western diet (WD) for 28 days and treated with control ASOs (green) or PSMD9 ASOs (yellow) (presented as fold change from control ASO = 1). Data are mean ± s.e.m., n = 8 mice per group. e, f, Quantification of proteins (presented as fold change from control ASO = 1, mean ± s.e.m., n = 6 control ASO; n = 8 PSMD9 ASO mice per group) (e) as determined by western blot (f) in livers of both mouse strains fed a Western diet for 28 days and treated with ASOs. g, Plots (fold change from chow-fed control ASO = 1) of the abundance of hepatic diacylglycerol and triacylglycerol in mice treated with control ASOs on a chow diet (white) or Western diet (green), or treated with PSMD9 ASOs (yellow) on a Western diet. Data are mean ± s.e.m., n = 4 chow, n = 6 all WD except n = 5 DBA/2J control ASO DG, DBA/2J PSMD9 ASO TG and n = 4 DBA/2J control ASO TG mice per group. h, Haematoxylin and eosin staining of liver sections from both strains of mice fed a Western diet and treated with control ASOs (top) or PSMD9 ASOs (bottom) for 28 days. Data are representative of five independent mice. Dotted lines segregate regions of microsteatosis and hepatocyte ballooning. Original magnification, ×200. i, j, Plot (mean ± s.e.m., n = 6 control ASO, n = 8 PSMD9 ASO, mice per group) for synthesis of individual fatty acid species in both strains after a Western diet for 28 days and treatment with control ASOs (green) or PSMD9 ASOs (yellow). Data presented as percentage of hepatic fatty acid pool enriched with deuterium label. *P < 0.05, **P < 0.01, compared to control ASO WD.

Comment in

References

    1. Younossi ZM et al. Global epidemiology of nonalcoholic fatty liver disease-Meta-analytic assessment of prevalence, incidence, and outcomes. Hepatology 64, 73–84 (2016). - PubMed
    1. Sookoian S & Pirola CJ The genetic epidemiology of nonalcoholic fatty liver disease: toward a personalized medicine. Clin. Liver Dis 16, 467–485 (2012). - PubMed
    1. Sookoian S & Pirola CJ Genetic predisposition in nonalcoholic fatty liver disease. Clin. Mol. Hepatol 23, 1–12 (2017). - PMC - PubMed
    1. Mackay TF et al. The Drosophila melanogaster Genetic Reference Panel. Nature 482, 173–178 (2012). - PMC - PubMed
    1. Peirce JL, Lu L, Gu J, Silver LM & Williams RW A new set of BXD recombinant inbred lines from advanced intercross populations in mice. BMC Genet. 5, 7 (2004). - PMC - PubMed

Publication types

MeSH terms