. 2019 Feb 13:10:92.
doi: 10.3389/fmicb.2019.00092. eCollection 2019.

Exposure to Sub-inhibitory Concentrations of the Chemosensitizer 1-(1-Naphthylmethyl)-Piperazine Creates Membrane Destabilization in Multi-Drug Resistant Klebsiella pneumoniae

Affiliations

Exposure to Sub-inhibitory Concentrations of the Chemosensitizer 1-(1-Naphthylmethyl)-Piperazine Creates Membrane Destabilization in Multi-Drug Resistant Klebsiella pneumoniae

João Anes et al. Front Microbiol. .

Abstract

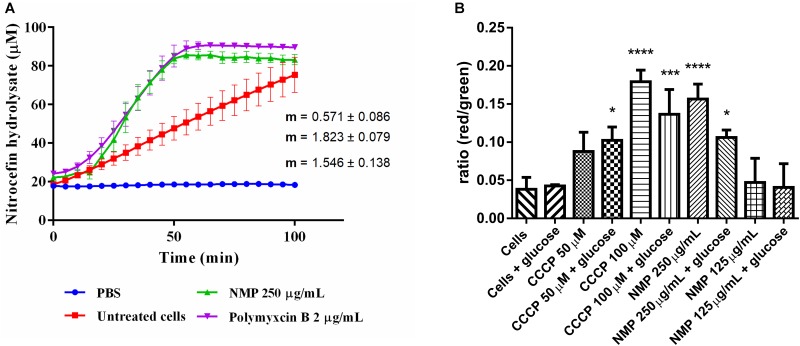
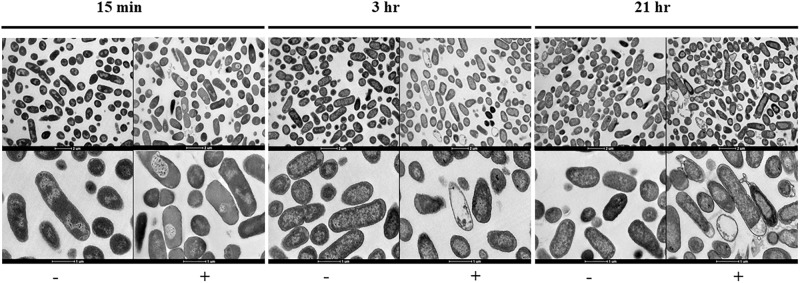
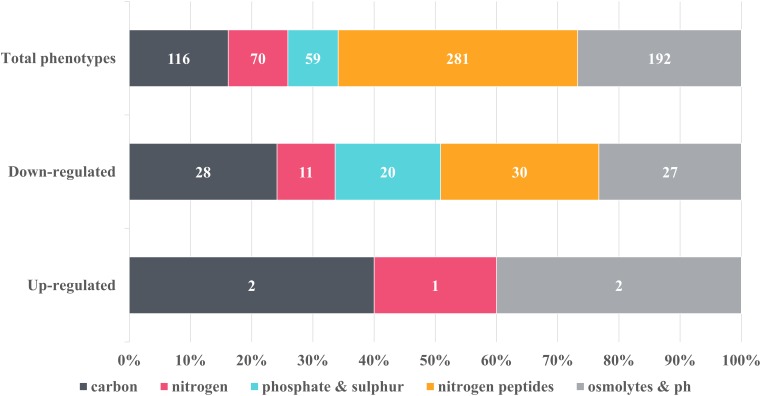
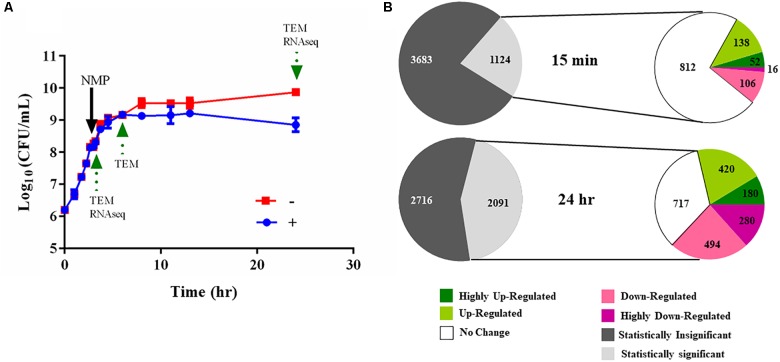
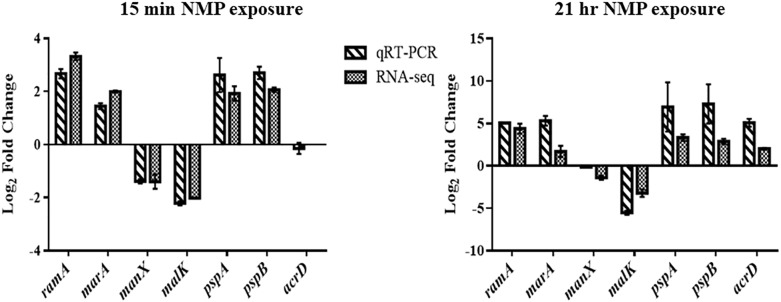
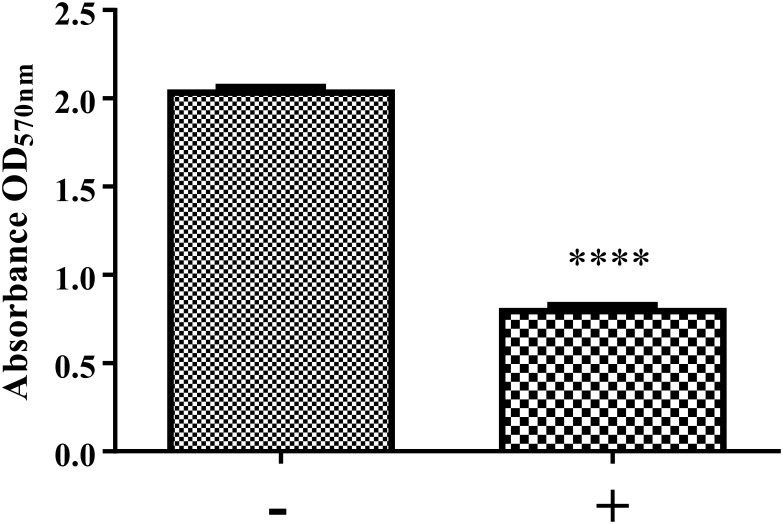
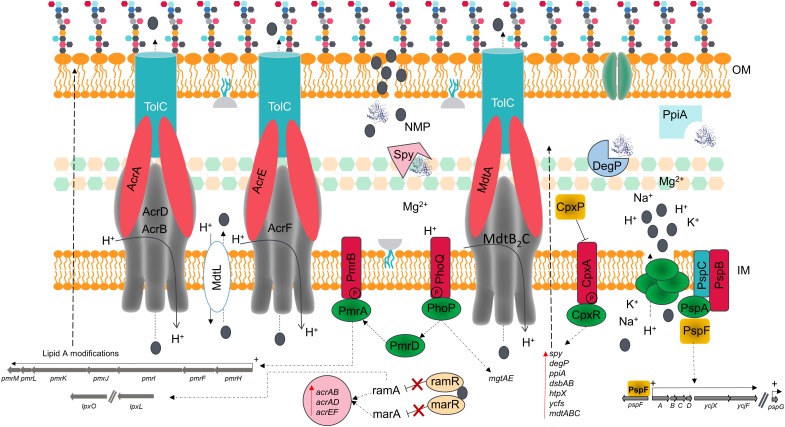
Antimicrobial efflux is one of the important mechanisms causing multi-drug resistance (MDR) in bacteria. Chemosensitizers like 1-(1-naphthylmethyl)-piperazine (NMP) can inhibit an efflux pump and therefore can overcome MDR. However, secondary effects of NMP other than efflux pump inhibition are rarely investigated. Here, using phenotypic assays, phenotypic microarray and transcriptomic assays we show that NMP creates membrane destabilization in MDR Klebsiella pneumoniae MGH 78578 strain. The NMP mediated membrane destabilization activity was measured using β-lactamase activity, membrane potential alteration studies, and transmission electron microscopy assays. Results from both β-lactamase and membrane potential alteration studies shows that both outer and inner membranes are destabilized in NMP exposed K. pneumoniae MGH 78578 cells. Phenotypic Microarray and RNA-seq were further used to elucidate the metabolic and transcriptional signals underpinning membrane destabilization. Membrane destabilization happens as early as 15 min post-NMP treatment. Our RNA-seq data shows that many genes involved in envelope stress response were differentially regulated in the NMP treated cells. Up-regulation of genes encoding the envelope stress response and repair systems show the distortion in membrane homeostasis during survival in an environment containing sub-inhibitory concentration of NMP. In addition, the lsr operon encoding the production of autoinducer-2 responsible for biofilm production was down-regulated resulting in reduced biofilm formation in NMP treated cells, a phenotype confirmed by crystal violet-based assays. We postulate that the early membrane disruption leads to destabilization of inner membrane potential, impairing ATP production and consequently resulting in efflux pump inhibition.

Keywords: 1-(1-naphthylmethyl)-piperazine; Klebsiella pneumoniae; NMP; chemosensitizers; membrane destabilization; secondary effects.


Figures

FIGURE 1
FIGURE 1
(A) Measurements of β-lactamase enzymatic activity in Klebsiella pneumoniae MGH 78578, in the presence of 250 μg/mL NMP. Activity was measured over 100 min at 37°C. Slope values of the activity curves represent the rate of nitrocefin hydrolysis/min. Polymyxin B was used as an internal control for cell wall disruption at a concentration of 2 μg/mL. Background absorbance values for nitrocefin, nitrocefin with NMP and nitrocefin with polymyxin B were subtracted from the corresponding samples. Slopes and standard deviations were calculated from three individual experiments with two technical replicates each. (B) Effect of NMP on the membrane potential of K. pneumoniae MGH 78578. Bacterial membrane potential was measured by flow cytometry using the Baclight kit (Invitrogen). Bacterial cells were diluted in PBS (control) and in PBS containing defined concentrations of the proton-motive force inhibitor CCCP and NMP in presence and absence of glucose. DiOC2(3) was added to all samples and fluorescence emission data collected in the green and red channels. Variations in the membrane potential cause a change in fluorescence of DiOC2(3) from green to red. Results were compared to the control sample [Cells + DiOC2(3)] by one-way ANOVA statistical test – P < 0.05, ∗∗∗P < 0.001, ∗∗∗∗P < 0.0001.
FIGURE 2
FIGURE 2
Transmission electron micrographs sowing the morphological changes observed on NMP treated K. pneumoniae MGH 78578. Images were collected after 15 min, 3- and 21-h of exposure to NMP. The images in the top panel were magnified 6,000X, bottom panel images shown were magnified 16,500X. The sign ‘–’ denotes DMSO and ‘+’ denotes DMSO plus NMP.
FIGURE 3
FIGURE 3
Overview of the metabolic changes detected in NMP-treated K. pneumoniae MGH 78578 as observed in the phenotypic microarray platform. Phenotypes were grouped into classes and the number of representatives contained within each class was indicated on the graph. Control phenotypes were assessed in the presence of DMSO, the solvent used to solubilize NMP. Raw data was analyzed using DuctApe software (v 0.17.4) and significant changes were considered for Δ activities lower and higher than –2 and 2 respectively. Five metabolic pathways were considered to be up-regulated in the presence of 250 μg/mL NMP with 116 being down-regulated.
FIGURE 4
FIGURE 4
Experimental design of the RNA-seq experiments. (A) Typical bacterial growth curve measured at 37°C in MH broth in the presence of the 250 μg/mL NMP and the control solvent DMSO. NMP was added when OD600 nm of the culture reached mid-log phase (0.6 approximately after 3 h of growth). The sign ‘–’ denotes DMSO and ‘+’ denotes DMSO plus NMP. Samples were taken for transmission electron microscopy (TEM) and for RNA purification as indicated by green arrows at time points 15 min, 3 and 21 h following exposure. (B) Overview of the number of the differentially regulated genes identified using RNA-seq. The gray and white colored pie chart [upper] depicts the number of genes for which statistically significant data (Voom, P < 0.05) was obtained from the two time points. The second pie chart [lower] depicts the number of up- and down-regulated genes at the respective time point. The color of each pie represents the relative gene expression based on the color scale given below.
FIGURE 5
FIGURE 5
A figure showing the validation measurements taken comparing RNA-seq data and qRT-PCR.
FIGURE 6
FIGURE 6
Biofilm formation of K. pneumoniae MGH 78578 in the presence and absence of NMP. Bacterial cells were grown statically in M9 minimal media in the presence of NMP at 250 μg/mL for 24 h at 37°C. The sign ‘–’ denotes DMSO and ‘+’ denotes DMSO plus NMP. Biofilm formation was measured by crystal violet method and compared between NMP treated and untreated cultures (∗∗∗∗P < 0.05).
FIGURE 7
FIGURE 7
Schematic model summarizing the effects of NMP of the membrane of K. pneumoniae MGH 78578. The chemosensitizer NMP (indicated by the gray colored circle) crosses the cell membrane by disrupting the integrity of the lipid bilayer [both outer membrane (OM) and inner membrane (IM)]. This disruption causes the leakage of essential ions and cell content components leading to several structural and metabolic changes in a manner reminiscent of the action of similar cationic antimicrobial peptides.

Similar articles

Cited by

References

    1. Anes J., Hurley D., Martins M., Fanning S. (2017). Exploring the genome and phenotype of multi-drug resistant Klebsiella pneumoniae of clinical origin. Front. Microbiol. 8:1913. 10.3389/fmicb.2017.01913 - DOI - PMC - PubMed
    1. Anes J., Martins M., Fanning S. (2018). Reversing antimicrobial resistance in multidrug-resistant Klebsiella pneumoniae of clinical origin using 1-(1-Naphthylmethyl)-Piperazine. Microb. Drug Resist. 10.1089/mdr.2017.0386 [Epub ahead of print]. - DOI - PubMed
    1. Anes J., Mccusker M. P., Fanning S., Martins M. (2015). The ins and outs of RND efflux pumps in Escherichia coli. Front. Microbiol. 6:587 10.3389/fmicb.2015.00587 - DOI - PMC - PubMed
    1. Baugh S., Phillips C. R., Ekanayaka A. S., Piddock L. J., Webber M. A. (2014). Inhibition of multidrug efflux as a strategy to prevent biofilm formation. J. Antimicrob. Chemother. 69 673–681. 10.1093/jac/dkt420 - DOI - PubMed
    1. Bina X. R., Philippart J. A., Bina J. E. (2009). Effect of the efflux inhibitors 1-(1-naphthylmethyl)-piperazine and phenyl-arginine-beta-naphthylamide on antimicrobial susceptibility and virulence factor production in Vibrio cholerae. J. Antimicrob. Chemother. 63 103–108. 10.1093/jac/dkn466 - DOI - PubMed