

Integration of Transcriptomic Data Identifies Global and Cell-Specific Asthma-Related Gene Expression Signatures
- PMID: 30815178
- PMCID: PMC6371257
Integration of Transcriptomic Data Identifies Global and Cell-Specific Asthma-Related Gene Expression Signatures
Abstract
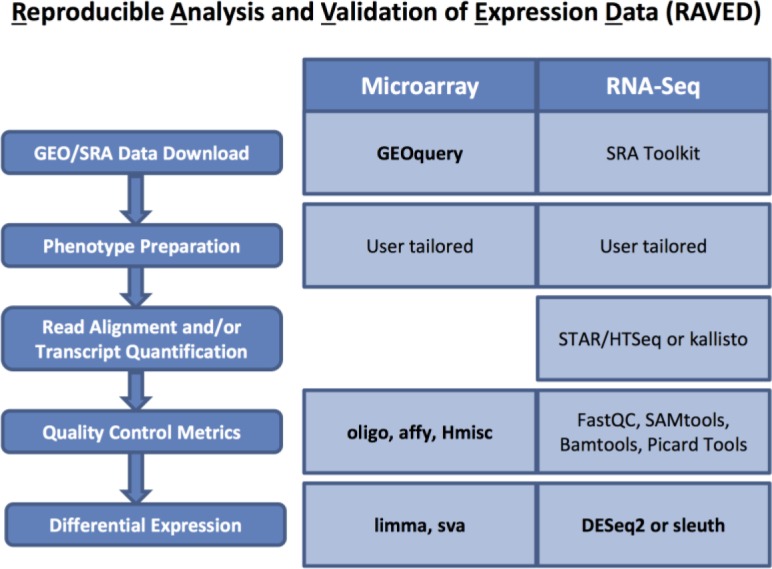
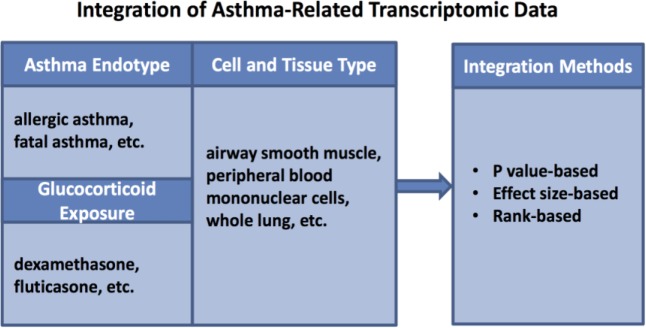
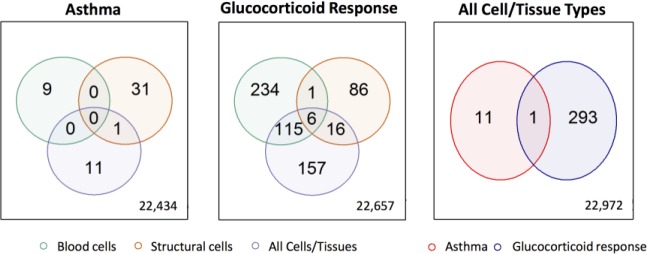
Over 140,000 transcriptomic studies performed in healthy and diseased cell and tissue types, at baseline and after exposure to various agents, are available in public repositories. Integrating results of transcriptomic datasets has been an attractive approach to identify gene expression signatures that are more robust than those obtained for individual datasets, especially datasets with small sample size. We developed Reproducible Analysis and Validation of Expression Data (RAVED), a pipeline that facilitates the creation of R Markdown reports detailing reproducible analysis of publicly available transcriptomic data, and used it to analyze asthma and glucocorticoid response microarray and RNA-Seq datasets. Subsequently, we used three approaches to integrate summary statistics of these studies and identify cell/tissue-specific and global asthma and glucocorticoid-induced gene expression changes. Transcriptomic integration methods were incorporated into an online app called REALGAR, where end-users can specify datasets to integrate and quickly obtain results that may facilitate design of experimental studies.
Figures
Similar articles
-
Facilitating Analysis of Publicly Available ChIP-Seq Data for Integrative Studies.AMIA Annu Symp Proc. 2020 Mar 4;2019:371-379. eCollection 2019. AMIA Annu Symp Proc. 2020. PMID: 32308830 Free PMC article.
-
Airway Smooth Muscle-Specific Transcriptomic Signatures of Glucocorticoid Exposure.Am J Respir Cell Mol Biol. 2019 Jul;61(1):110-120. doi: 10.1165/rcmb.2018-0385OC. Am J Respir Cell Mol Biol. 2019. PMID: 30694689 Free PMC article.
-
Identification of sample annotation errors in gene expression datasets.Arch Toxicol. 2015 Dec;89(12):2265-72. doi: 10.1007/s00204-015-1632-4. Epub 2015 Nov 25. Arch Toxicol. 2015. PMID: 26608184 Free PMC article.
-
Retrospective analysis: reproducibility of interblastomere differences of mRNA expression in 2-cell stage mouse embryos is remarkably poor due to combinatorial mechanisms of blastomere diversification.Mol Hum Reprod. 2018 Jul 1;24(7):388-400. doi: 10.1093/molehr/gay021. Mol Hum Reprod. 2018. PMID: 29746690
-
Navigating Transcriptomic Connectivity Mapping Workflows to Link Chemicals with Bioactivities.Chem Res Toxicol. 2022 Nov 21;35(11):1929-1949. doi: 10.1021/acs.chemrestox.2c00245. Epub 2022 Oct 27. Chem Res Toxicol. 2022. PMID: 36301716 Free PMC article. Review.
Cited by
-
Release of particulate matter from nano-enabled building materials (NEBMs) across their lifecycle: Potential occupational health and safety implications.J Hazard Mater. 2022 Jan 15;422:126771. doi: 10.1016/j.jhazmat.2021.126771. Epub 2021 Jul 29. J Hazard Mater. 2022. PMID: 34391975 Free PMC article.
-
Multiomics analysis identifies BIRC3 as a novel glucocorticoid response-associated gene.J Allergy Clin Immunol. 2022 Jun;149(6):1981-1991. doi: 10.1016/j.jaci.2021.11.025. Epub 2021 Dec 28. J Allergy Clin Immunol. 2022. PMID: 34971648 Free PMC article.
-
Facilitating Analysis of Publicly Available ChIP-Seq Data for Integrative Studies.AMIA Annu Symp Proc. 2020 Mar 4;2019:371-379. eCollection 2019. AMIA Annu Symp Proc. 2020. PMID: 32308830 Free PMC article.
-
Integrative network analysis suggests prioritised drugs for atopic dermatitis.J Transl Med. 2024 Jan 16;22(1):64. doi: 10.1186/s12967-024-04879-4. J Transl Med. 2024. PMID: 38229087 Free PMC article.
-
Experience and activity-dependent control of glucocorticoid receptors during the stress response in large-scale brain networks.Stress. 2021 Mar;24(2):130-153. doi: 10.1080/10253890.2020.1806226. Epub 2020 Aug 26. Stress. 2021. PMID: 32755268 Free PMC article.
References
Publication types
MeSH terms
Substances
Grants and funding
LinkOut - more resources
Full Text Sources
Medical