Drivers of year-to-year variation in exacerbation frequency of COPD: analysis of the AERIS cohort
- PMID: 30815467
- PMCID: PMC6387989
- DOI: 10.1183/23120541.00248-2018
Drivers of year-to-year variation in exacerbation frequency of COPD: analysis of the AERIS cohort
Erratum in
-
Erratum: "Drivers of year-to-year variation in exacerbation frequency of COPD: analysis of the AERIS cohort" Tom M.A. Wilkinson, Emmanuel Aris, Simon C. Bourne, Stuart C. Clarke, Mathieu Peeters, Thierry G. Pascal, Laura Taddei, Andrew C. Tuck, Viktoriya L. Kim, Kristoffer K. Ostridge, Karl J. Staples, Nicholas P. Williams, Anthony P. Williams, Stephen A. Wootton and Jeanne-Marie Devaster, on behalf of the AERIS Study Group. ERJ Open Res 2019; 5: 00248-2018.ERJ Open Res. 2019 Jul 29;5(3):00248-2018-AUT. doi: 10.1183/23120541.50248-2018. eCollection 2019 Jul. ERJ Open Res. 2019. PMID: 31384613 Free PMC article.
Abstract
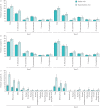
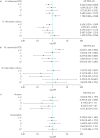
The association between exacerbation aetiology and exacerbation frequency is poorly understood. We analysed 2-year follow-up data from a prospective observational study of patients with chronic obstructive pulmonary disease (COPD) (www.clinicaltrials.gov identifier number NCT01360398) to evaluate year-to-year variation in exacerbation frequency and related aetiology. A total of 127 patients underwent blood and sputum sampling monthly and at exacerbation to detect respiratory infections and eosinophilic inflammation; 103 continued into year 2 and 88 completed both years. The most common bacterial species at stable state and exacerbation was Haemophilus influenzae. Among infrequent exacerbators (one exacerbation per year), the incidence of viral infection at exacerbation was high (60.0% (95% CI 35.1-81.7%) in year 1 and 78.6% (53.4-94.2%) in year 2). Those with more frequent exacerbations tended to have higher relative incidence of bacterial than viral infection. Patients with at least two additional exacerbations in year 2 versus year 1 had a higher risk of H. influenzae colonisation at stable state than those with at least two fewer exacerbations, as detected by culture (OR 1.43 (95% CI 0.71-2.91) versus 0.63 (0.40-1.01), p=0.06) and PCR (1.76 (95% CI 0.88-3.51) versus 0.56 (0.37-0.86), p<0.01). This was not seen with other infection types or eosinophilic inflammation. Analysis of the same cohort over 2 years showed, for the first time, that changes in yearly COPD exacerbation rate may be associated with variations in H. influenzae colonisation.
Conflict of interest statement
Conflict of interest: T.M.A. Wilkinson reports grants and nonfinancial support from GSK during the conduct of the study; and support for travel and meeting attendance from Boehringer Ingelheim, and grants and support for travel and meeting attendance from AstraZeneca, outside the submitted work. Conflict of interest: E. Aris is an employee of GSK. Conflict of interest: S.C. Bourne has nothing to disclose. Conflict of interest: S.C. Clarke reports grants from GSK, during the conduct of the study; and grants from Pfizer, outside the submitted work. Conflict of interest: M. Peeters is an employee of GSK. Conflict of interest: T.G. Pascal is an employee of GSK group of companies and owns restricted shares. Conflict of interest: L. Taddei has nothing to disclose. Conflict of interest: A.C. Tuck has nothing to disclose. Conflict of interest: V.L. Kim reports grants from GSK Biologicals SA during the conduct of the study and outside the submitted work. Conflict of interest: K.K. Ostridge has nothing to disclose. Conflict of interest: K.J. Staples reports grants from GSK Biologicals SA during the conduct of the study; and grants from Asthma UK (08/026), grants from BMA HC Roscoe Award, outside the submitted work. In addition, K.J. Staples has a patent PCT/GB2010/050821 “Ex Vivo Modelling of Therapeutic Interventions” pending. Conflict of interest: N.P. Williams has nothing to disclose. Conflict of interest: A.P. Williams has nothing to disclose. Conflict of interest: S.A. Wootton reports grants and nonfinancial support from GSK during the conduct of the study. Conflict of interest: J-M. Devaster is an employee of, and holds shares and restricted shares in GSK.
Figures


References
-
- Mackay AJ, Hurst JR. COPD exacerbations: causes, prevention, and treatment. Immunol Allergy Clin North Am 2013; 33: 95–115. - PubMed
-
- Müllerova H, Maselli DJ, Locantore N, et al. . Hospitalized exacerbations of COPD: risk factors and outcomes in the ECLIPSE cohort. Chest 2015; 147: 999–1007. - PubMed
-
- Global Initiative for Chronic Obstructive Lung Disease (GOLD) Global strategy for the diagnosis, management, and prevention of Chronic Obstructive pulmonary disease. 2017 report. http://goldcopd.org/download/326/. Date last updated: 2017. Date last accessed: December 9, 2018. - PubMed
-
- Hurst JR, Vestbo J, Anzueto A, et al. . Susceptibility to exacerbation in chronic obstructive pulmonary disease. N Engl J Med 2010; 363: 1128–1138. - PubMed
Associated data
Grants and funding
LinkOut - more resources
Full Text Sources
Medical
