. 2018 Jun 17;1(3):e00023.
doi: 10.1002/edm2.23. eCollection 2018 Jul.

The new FreeStyle libre flash glucose monitoring system improves the glycaemic control in a cohort of people with type 1 diabetes followed in real-life conditions over a period of one year

Affiliations

The new FreeStyle libre flash glucose monitoring system improves the glycaemic control in a cohort of people with type 1 diabetes followed in real-life conditions over a period of one year

Isabelle Paris et al. Endocrinol Diabetes Metab. .

Abstract

Aims: Using the novel FreeStyle Libre (FSL), glucose monitoring (FGM) system becomes increasingly popular among people with type 1 diabetes (T1D) and is associated with less and shorter hypoglycaemic events without deterioration of HbA1c. There are not yet data reporting the impact of FGM in people with T1D in real-life conditions. We sought of evaluating the tolerance, the acceptance and the efficacy of the FGM system in routine medical practice.

Methods: This 12-month observational study included 120 individuals with T1D evaluated every 3 months. After having been instructed about FGM utilization, participants were trained to optimize the glycaemic control.

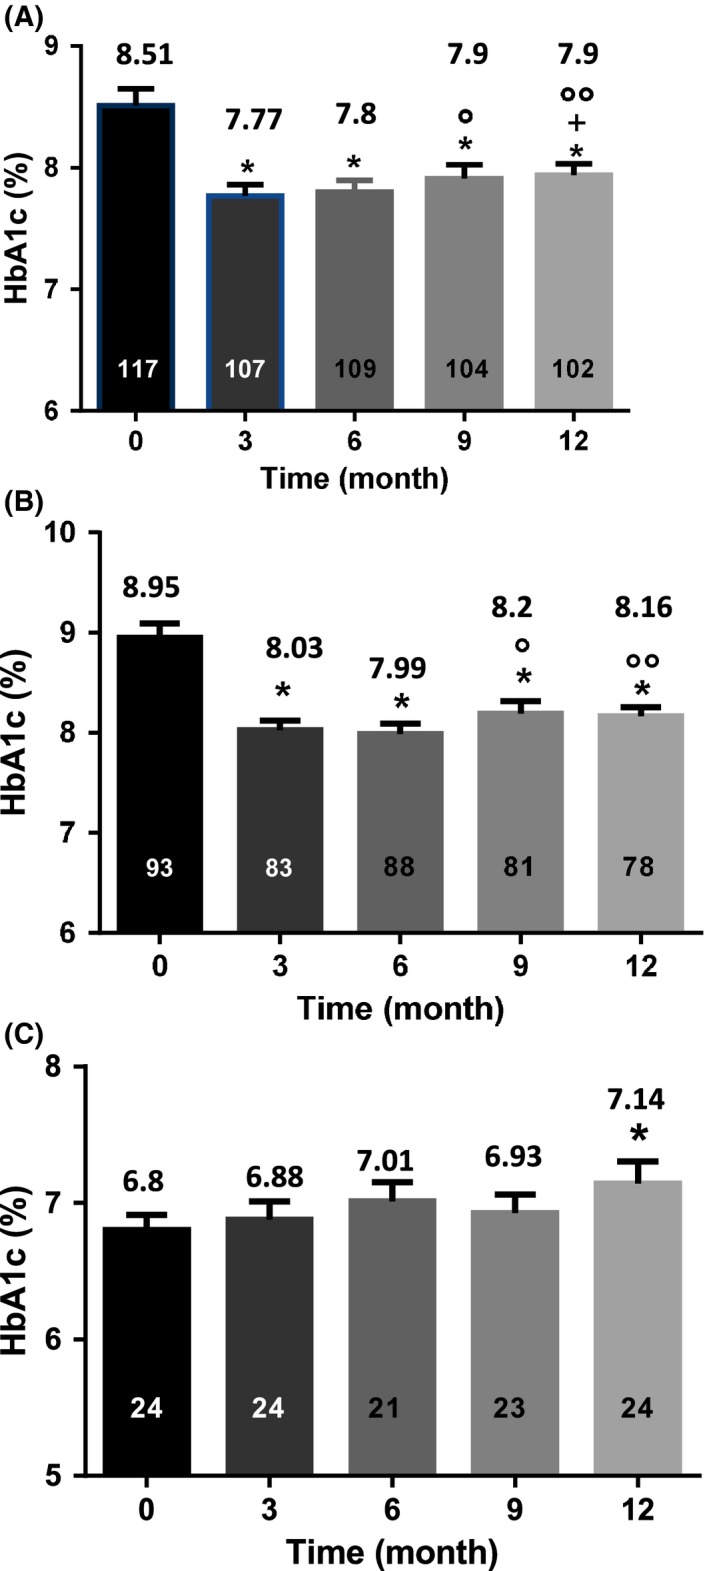
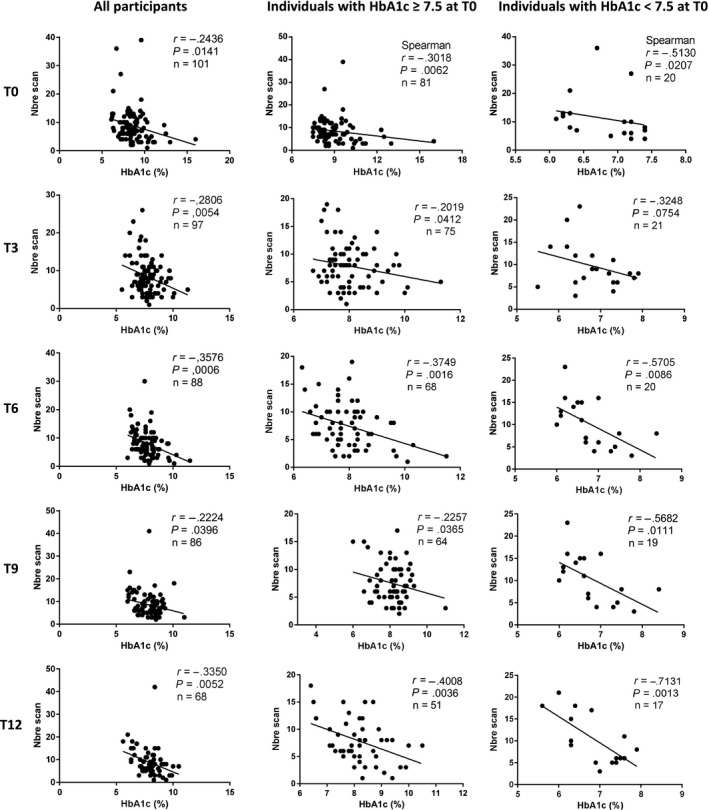
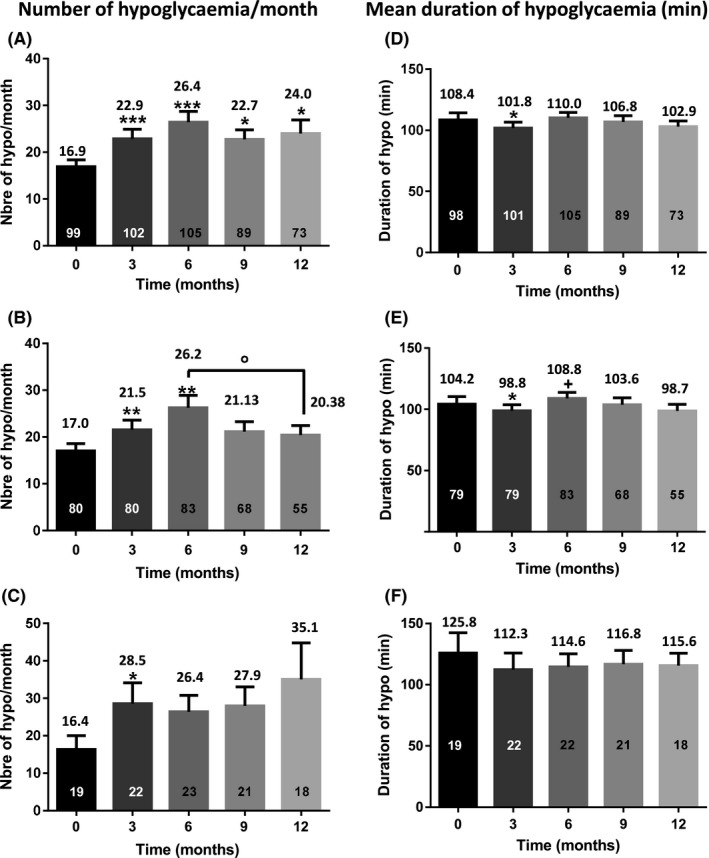
Results: Participants stopped immediately of measuring capillary blood glucose (2.88 ± 0.12 per day) (mean ± SEM) after having received the first FSL device and the number of scans per day increased up to 8.87 ± 0.58 per day. HbA1c levels decreased from 8.51% ± 0.14% at baseline to 7.77% ± 0.09% after 3 months to slightly increase to 7.92% ± 0.09% at 12 months, in correlation with the number of scans per day. The number (but not the duration) of hypoglycaemic events slightly increased from 16.9 ± 1.44 per month at baseline to 24.0 ± 2.91 per month at 12 months, after reaching a peak of 26.4 ± 2.31 per month at 6 months. They were correlated with improved HbA1c.

Conclusion: Our study shows that using the FGM system improves HbA1c levels in people with T1D along with a moderate increase in the number of mild hypoglycaemic events. The new FGM system facilitates the therapeutic empowerment of people with T1D, but in a context of structured education.

Keywords: FreeStyle libre; diabetes management; glucose monitoring; real‐life conditions.


Figures

Figure 1
Figure 1
HbA1c values over time. A, HbA1c values (indicated above the columns) in the entire cohort. HbA1c values significantly decreased at all time‐points even though they were slightly increasing after 9 months. B, HbA1c values (indicated above the columns) in the subgroup of individuals with HbA1c ≥ 7.5% at T0. HbA1c values significantly decreased at all time‐points. C, HbA1c values (indicated above the columns) in the subgroup of individuals with HbA1c < 7.5% at T0. No change in HbA1c levels was observed except at T12 where there were slightly increased. The numbers in the columns represent the number of individuals. *, P < .0001 as compared to T0; +, P < .01 vs T3; °, P < .05; °°, P < .001 vs T6 (A and B). *, P < .05 as compared to T0 (C). T0 = 15 days after setting of the first sensor
Figure 2
Figure 2
Correlation between HbA1c values and the number of daily scans. The correlation was calculated using Pearson correlation coefficient (r), excepted if indicated. A negative correlation was observed between the number of scans and the HbA1c values at all time‐points
Figure 3
Figure 3
Number of hypoglycaemic events/month (A, B and C) and mean duration of a hypoglycaemic event (D, E, and F). A,D, The entire cohort. B,E, Participants with HbA1c ≥ 7.5 at T0. C,F, Participants with HbA1c < 7.5 at T0. The results are indicated above each column. The numbers in the columns represent the number of individuals. *, P < .05; **, P < .01; ***, P < .001 as compared to T0; +, P < .05 vs T3; °, P < .05 vs T6

References

    1. McGill JB, Ahmann A. Continuous glucose monitoring with multiple daily insulin treatment: outcome studies. Diabetes Technol Ther. 2017;19:S3‐S12. - PMC - PubMed
    1. Rodbard D. Continuous glucose monitoring: a review of recent studies demonstrating improved glycemic outcomes. Diabetes Technol Ther. 2017;19:S25‐S37. - PMC - PubMed
    1. Kovatchev BP, Patek SD, Ortiz EA, Breton MD. Assessing sensor accuracy for non‐adjunct use of continuous glucose monitoring. Diabetes Technol Ther. 2015;17:177‐186. - PMC - PubMed
    1. Garg SK, Akturk HK. Flash glucose monitoring: the future is here. Diabetes Technol Ther. 2017;19:S1‐S3. - PMC - PubMed
    1. Bailey T, Bode BW, Christiansen MP, Klaff LJ, Alva S. The performance and usability of a factory‐calibrated flash glucose monitoring system. Diabetes Technol Ther. 2015;17:787‐794. - PMC - PubMed