. 2019 Feb 28;9(1):3109.
doi: 10.1038/s41598-019-39245-8.

Genotoxic stress increases cytoplasmic mitochondrial DNA editing by human APOBEC3 mutator enzymes at a single cell level

Affiliations

Genotoxic stress increases cytoplasmic mitochondrial DNA editing by human APOBEC3 mutator enzymes at a single cell level

Bianka Mussil et al. Sci Rep. .

Abstract

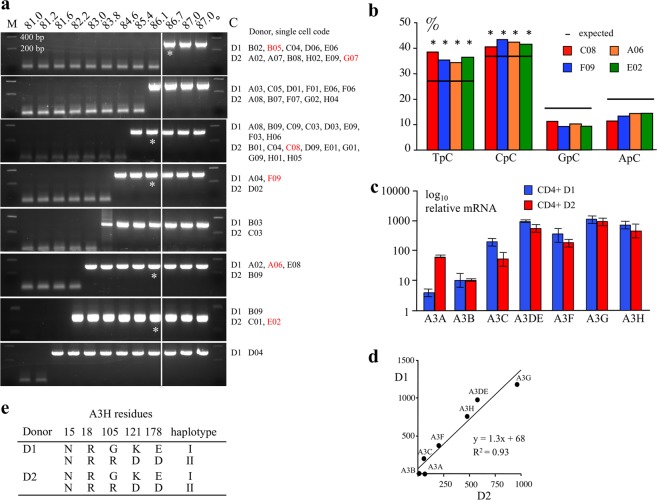
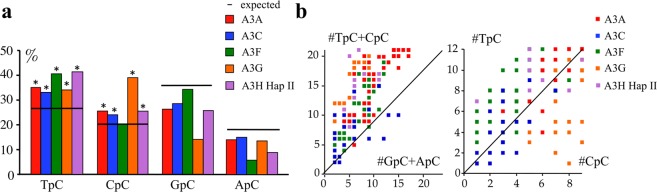
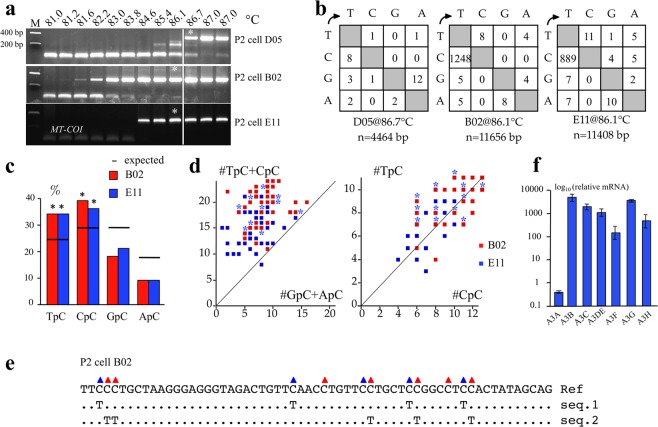
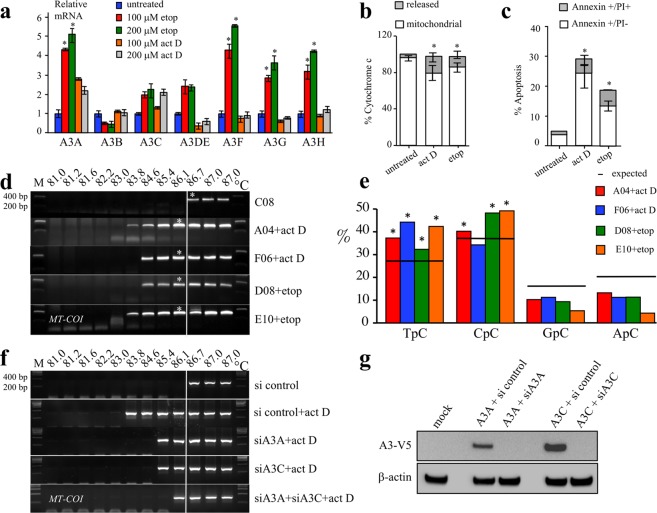
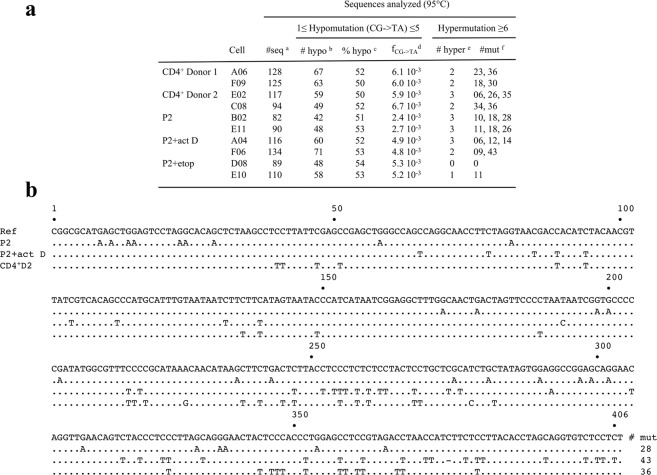
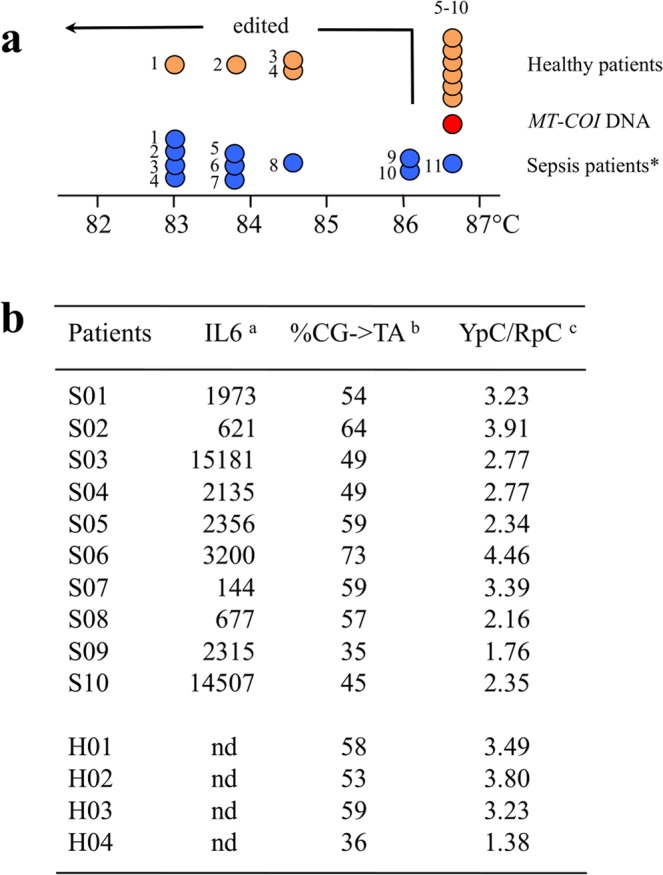
Human cells are stressed by numerous mechanisms that can lead to leakage of mitochondrial DNA (mtDNA) to the cytoplasm and ultimately apoptosis. This agonist DNA constitutes a danger to the cell and is counteracted by cytoplasmic DNases and APOBEC3 cytidine deamination of DNA. To investigate APOBEC3 editing of leaked mtDNA to the cytoplasm, we performed a PCR analysis of APOBEC3 edited cytoplasmic mtDNA (cymtDNA) at the single cell level for primary CD4+ T cells and the established P2 EBV blast cell line. Up to 17% of primary CD4+ T cells showed signs of APOBEC3 edited cymtDNA with ~50% of all mtDNA sequences showing signs of APOBEC3 editing - between 1500-5000 molecules. Although the P2 cell line showed a much lower frequency of stressed cells, the number of edited mtDNA molecules in such cells was of the same order. Addition of the genotoxic molecules, etoposide or actinomycin D increased the number of cells showing APOBEC3 edited cymtDNA to around 40%. These findings reveal a very dynamic image of the mitochondrial network, which changes considerably under stress. APOBEC3 deaminases are involved in the catabolism of mitochondrial DNA to circumvent chronic immune stimulation triggered by released mitochondrial DNA from damaged cells.


Conflict of interest statement

The authors declare no competing interests.

Figures

Figure 1
Figure 1
Frequencies of A3-edited cymtDNA in single cells. Frequencies of single cells harboring A3-edited cymtDNA using a fixed PCR denaturation temperature of 85 °C. Analysis was performed in single CD4+ T lymphocytes from 2 donors D1 and D2, ~17% and 12% of cells scored positive for APOBEC3 edited cymtDNA. Among the 512 P2 ung/ cells analyzed at 85 °C, 3 cells (0.6%) are positive. P2 ung/ cells were treated with 100 μM actinomycin D (act D) or etoposide (etop) for 16 hours. Treatment increased the proportion of cells showing evidence of cymtDNA editing to ~24.6% and 22.2% with actinomycin D or etoposide respectively. f: frequency, #: number.
Figure 2
Figure 2
Editing of MT-COI in single CD4+ T lymphocytes from donor 1 and 2. (a) APOBEC3 edited cymtDNA was analyzed using a Td gradient across the heating block on first round PCR products. There were considerable differences in the extent of A3 editing as judged by the lowest Td at which edited DNA could be recovered. 3D-PCR recovered edited cytoplasmic MT-COI DNA down to 81.6–86.1 °C for 27 single cells from donor 1 (D1) and 25 single cells from donor 2 (D2). The Td just below the restriction temperature (86.7 °C) of unedited DNA (cell B05 and G07) were cloned and sequenced (Supplementary. Fig. S1). Cells F09, A06 from donor 1 (D1) and C08, E02 from donor 2 (D2) in red obtained at 86.1 °C were analyzed in detail. The white line indicates the threshold between edited and unedited 3D-PCR products in terms of the denaturation temperature. Cells B05 and G07 showed no editing of cymtDNA and were used as control. Asterisks refer to the samples cloned and sequenced. M: molecular weight markers. (b) Dinucleotide context of MT-COI DNA region minus strand DNA obtained from cells C08, F09, A06 and E02. The horizontal bar represents the expected values of dinucleotide composition (expected). Chi-square test indicates dinucleotide frequencies that significantly deviate from the expected values (*p < 0.05). (c) TaqMan analysis of A3 transcriptome form positively selected but unstimulated CD4+ T cells from donor 1 (D1) and 2 (D2). Data in triplicate were normalized to the expression levels of RPL13A housekeeping reference genes. (d) Correlation between the A3 gene transcription levels for the two donor samples, D1 and D2. All seven A3 genes were expressed with the relative mRNA levels being well correlated between the two donors (e) APOBEC3H haplotypes of the 2 donors D1 and D2. Genetic analysis showed mixed haplotypes I/II.
Figure 3
Figure 3
Dinucleotide context and clonal analysis of MT-COI editing in QT6 quail cells. (a) Bulk dinucleotide context of quail MT-COI DNA edited by A3A, A3C, A3F, A3G and A3H Hap II cytidine deaminases. The horizontal bar represents the expected values of dinucleotide composition (expected). Chi-square test indicates dinucleotide frequencies that significantly deviate from expected values (*p < 0.05). (b) Clonal analysis of MT-COI editing for A3A, A3C, A3F, A3G and A3H Hap II cytidine deaminases. The number (#) of TpC + CpC vs. GpC + ApC targets edited per sequence are computed and represented on the y and x axes respectively (left), and clonal analysis using TpC vs. CpC (right). The number (#) of TpC + CpC vs. GpC + ApC targets edited per sequence and represented on the y and x axes respectively (left), and clonal analysis using TpC vs. CpC (right). Some dots overlap due to the identical number of APOBEC3-edited sequences.
Figure 4
Figure 4
MT-COI editing in P2 single cell. (a) 3D-PCR recovered edited MT-COI DNA down to 81.2 °C for single cells B02 and down to 84.6 °C for single cell E11. Cell D05 did not harbor edited mtDNA and was used as a control. The white line indicates the threshold between edited and unedited 3D-PCR products in terms of the denaturation temperature. (b) Mutation matrices for hyperedited MT-COI DNA sequences from cells D05, B02 and E11 derived from cloned 3D-PCR obtained at 86.7 °C and 86.1 °C. The numbers below the matrices (n) indicate the number of nucleotides analysed. (c) Dinucleotide context of MT-COI DNA region minus strand DNA obtained in cell B02 and E11. The horizontal bar represents the expected values of dinucleotide composition (expected). Chi-square test indicates dinucleotide frequencies that significantly deviate from expected values (*p < 0.05). (d) Clonal analysis of MT-COI editing for individual edited sequences from cell B02 and E11. Blue asterisks represent the overlapping sequences between cell B02 and E11. The number (#) of TpC + CpC vs. GpC + ApC targets edited per sequence are computed and represented on the y and x axes respectively (left), and clonal analysis using TpC vs. CpC (right). (e) Edited MT-COI DNA from P2 cell B02 at a single cell level in two different dinucleotide contexts, 5′TpC in blue triangle (seq1) and 5′CpC in red triangle (seq2). (f) TaqMan analysis A3 transcriptome of bulk P2 cells. Data in triplicate were normalized to the expression levels of RPL13A housekeeping reference genes.
Figure 5
Figure 5
Etoposide and actinomycin D induced A3 expression and MT-COI editing in P2 cells. (a) Transcription profiling of A3A-A3H in etoposide or actinomycin D treated-P2 cells. Data in triplicate were normalized to the expression levels of RPL13A housekeeping reference genes and to untreated P2 cells to facilitate comparison (*p < 0.05). (b,c) FACS analysis of cytochrome c release (left) and apoptosis (right) in P2 cells treated with 100 µM of actinomycin D or 100 µM etoposide after 16 hours. Annexin V scored early apoptosis and propidium iodide (PI) late apoptosis/necrosis. Means and SEM are given for three independent experiments (*p < 0.05). (d) 3D-PCR recovered edited MT-COI DNA down to 83.8–84.6 °C for P2 single cells A04 and F06 treated with actinomycin D and for P2 single cells and D08 and E10 treated with etoposide. Cell C08 served as unedited control. (e) Dinucleotide context for A3-edited MT-COI DNA. The horizontal bar represents the expected values of dinucleotide composition (expected). Chi-square test analysis indicates dinucleotide frequencies that significantly deviate from the expected values (*p < 0.05). (f) P2 cells were treated with 100 µM actinomycin D and transfected with 1μg of A3A and/or A3C siRNA knockdown. The white line indicates the threshold between edited and unedited 3D-PCR products in terms of the denaturation temperature. (g) Efficiency of A3A and A3C siRNAs (experiment was performed in triplicate).
Figure 6
Figure 6
Abundant A3-edited cymtDNA in single cells. (a) Number of hypo- and hypermutated mtDNA sequences obtained using a PCR denaturation temperature of 95 °C; anumber of analyzed sequences; bnumber of hypomutated sequences; cproportion of hypoedited sequences per cell; dmean CG-> TA mutation frequencies for hypoedited sequences, enumber (#) of hyperedited mtDNA sequences identified; fnumber (#) of C-> T or G-> A transitions per mtDNA sequence. (b) A selection of hypermutated MT-COI sequences in presence or absence of 100 μM actinomycin D in P2 cells and in purified CD4+ from patient D2. Ref corresponds to the MT-COI reference sequence. Only differences are shown. To the right are the number mutations per sequence edited.
Figure 7
Figure 7
MT-COI editing in healthy and sepsis patients. (a) Schematic representing the denaturation temperature of the last positive 3D-PCR amplification for MT-COI DNA derived from the serum of sepsis and healthy patients. Red circle indicates a molecular COI-MT DNA clone of the reference sequence, blue circles represent serum samples from sepsis patients and orange circles represent serum samples from healthy patients. *Chi-square test indicates that mtDNA editing in sepsis patients significantly deviate from the healthy patients (p = 0.028; p < 0.05). (b) Sequence analysis of hyperedited MT-COI sequences obtained from 10 sepsis patients (S) and 4 healthy controls (H). aAmount of serum IL6 (pg/mole), bpercentage of CG-> TA edits, cYpC/RpC was calculated as follows: ((TpC + CpC)/(GpC + ApC)) observed/((TpC + CpC)/(GpC + ApC)) expected. A value > 1 is indicative of A3 cytidine deamination in TpC + CpC dinucleotide context. nd: not determined.

Similar articles

Cited by

References

    1. Jarmuz A, et al. An anthropoid-specific locus of orphan C to U RNA-editing enzymes on chromosome 22. Genomics. 2002;79:285–296. doi: 10.1006/geno.2002.6718. - DOI - PubMed
    1. Bishop KN, et al. Cytidine deamination of retroviral DNA by diverse APOBEC proteins. Curr Biol. 2004;14:1392–1396. doi: 10.1016/j.cub.2004.06.057. - DOI - PubMed
    1. Henry, M. et al. Genetic editing of HBV DNA by monodomain human APOBEC3 cytidine deaminases and the recombinant nature of APOBEC3G. PLoS ONE4 (2009). - PMC - PubMed
    1. Langlois MA, Beale RC, Conticello SG, Neuberger MS. Mutational comparison of the single-domained APOBEC3C and double-domained APOBEC3F/G anti-retroviral cytidine deaminases provides insight into their DNA target site specificities. Nucleic Acids Res. 2005;33:1913–1923. doi: 10.1093/nar/gki343. - DOI - PMC - PubMed
    1. Suspène R, et al. APOBEC3G is a single-stranded DNA cytidine deaminase and functions independently of HIV reverse transcriptase. Nucleic Acids Res. 2004;32:2421–2429. doi: 10.1093/nar/gkh554. - DOI - PMC - PubMed

Publication types