

Rapalog resistance is associated with mesenchymal-type changes in Tsc2-null cells
- PMID: 30816188
- PMCID: PMC6395747
- DOI: 10.1038/s41598-019-39418-5
Rapalog resistance is associated with mesenchymal-type changes in Tsc2-null cells
Abstract
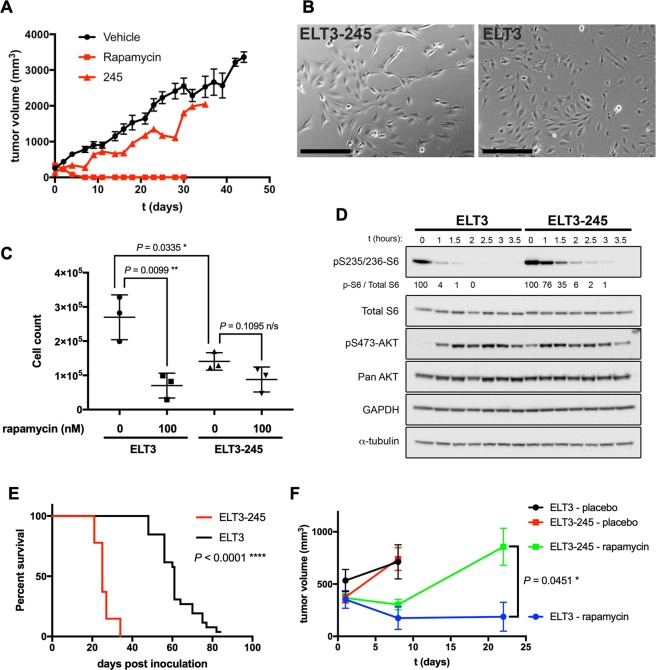
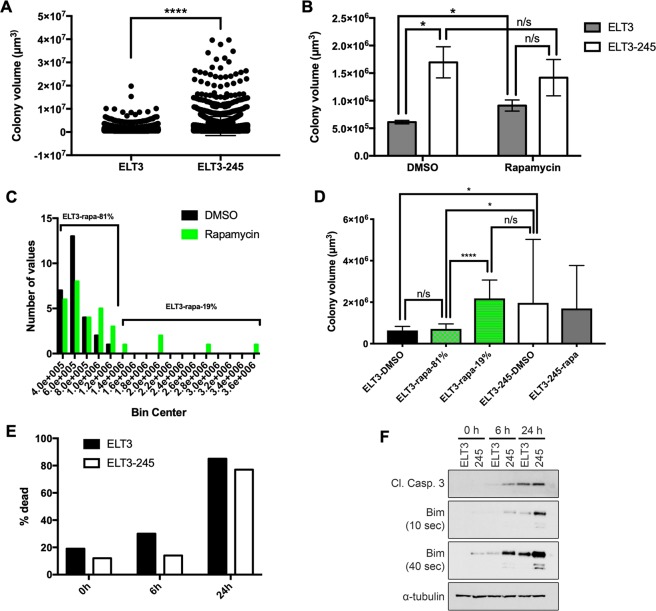
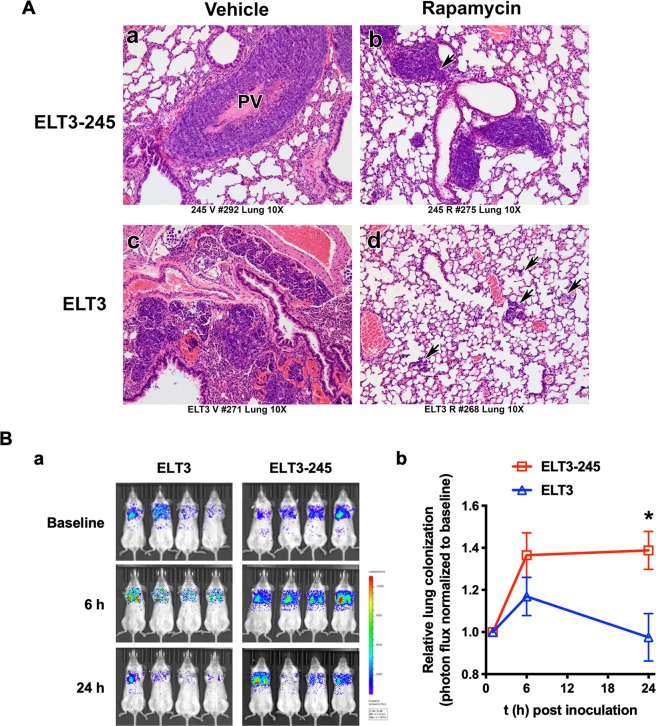
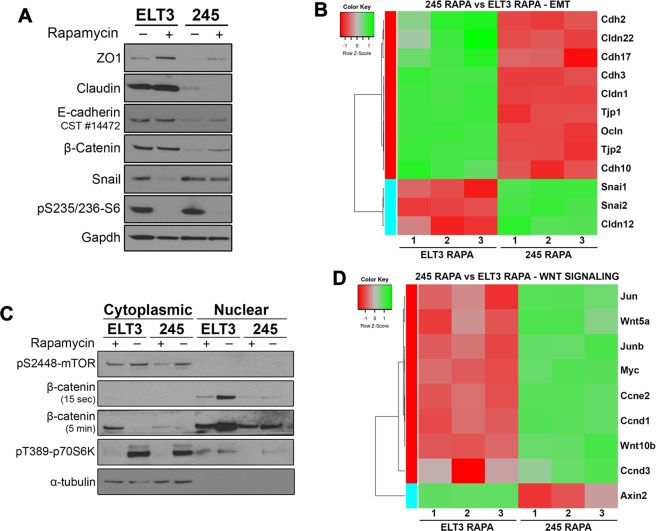
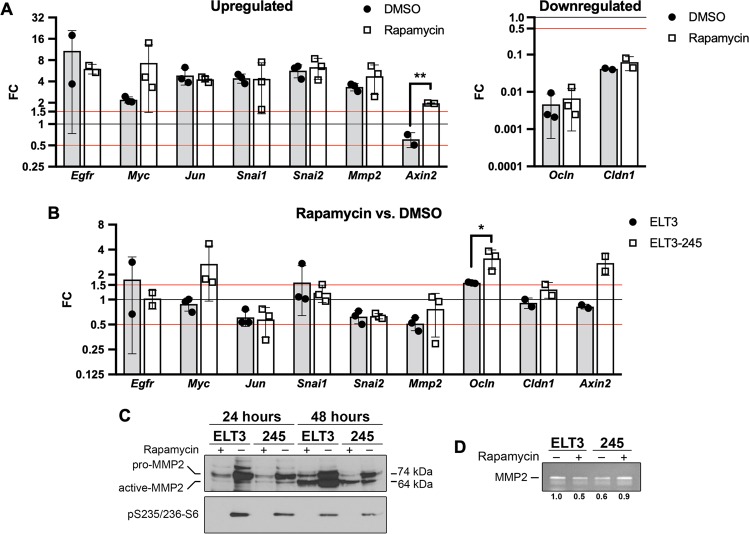
Tuberous Sclerosis Complex (TSC) and Lymphangioleiomyomatosis (LAM) are caused by inactivating mutations in TSC1 or TSC2, leading to mTORC1 hyperactivation. The mTORC1 inhibitors rapamycin and analogs (rapalogs) are approved for treating of TSC and LAM. Due to their cytostatic and not cytocidal action, discontinuation of treatment leads to tumor regrowth and decline in pulmonary function. Therefore, life-long rapalog treatment is proposed for the control of TSC and LAM lesions, which increases the chances for the development of acquired drug resistance. Understanding the signaling perturbations leading to rapalog resistance is critical for the development of better therapeutic strategies. We developed the first Tsc2-null rapamycin-resistant cell line, ELT3-245, which is highly tumorigenic in mice, and refractory to rapamycin treatment. In vitro ELT3-245 cells exhibit enhanced anchorage-independent cell survival, resistance to anoikis, and loss of epithelial markers. A key alteration in ELT3-245 is increased β-catenin signaling. We propose that a subset of cells in TSC and LAM lesions have additional signaling aberrations, thus possess the potential to become resistant to rapalogs. Alternatively, when challenged with rapalogs TSC-null cells are reprogrammed to express mesenchymal-like markers. These signaling changes could be further exploited to induce clinically-relevant long-term remissions.
Conflict of interest statement
The authors declare no competing interests.
Figures
Similar articles
-
Rapamycin-insensitive up-regulation of adipocyte phospholipase A2 in tuberous sclerosis and lymphangioleiomyomatosis.PLoS One. 2014 Oct 27;9(10):e104809. doi: 10.1371/journal.pone.0104809. eCollection 2014. PLoS One. 2014. PMID: 25347447 Free PMC article.
-
Statins in lymphangioleiomyomatosis. Simvastatin and atorvastatin induce differential effects on tuberous sclerosis complex 2-null cell growth and signaling.Am J Respir Cell Mol Biol. 2013 Nov;49(5):704-9. doi: 10.1165/rcmb.2013-0203RC. Am J Respir Cell Mol Biol. 2013. PMID: 23947572 Free PMC article.
-
Upregulation of 6-phosphofructo-2-kinase (PFKFB3) by hyperactivated mammalian target of rapamycin complex 1 is critical for tumor growth in tuberous sclerosis complex.IUBMB Life. 2020 May;72(5):965-977. doi: 10.1002/iub.2232. Epub 2020 Jan 20. IUBMB Life. 2020. PMID: 31958214
-
Mammalian target of rapamycin signaling and autophagy: roles in lymphangioleiomyomatosis therapy.Proc Am Thorac Soc. 2010 Feb;7(1):48-53. doi: 10.1513/pats.200909-104JS. Proc Am Thorac Soc. 2010. PMID: 20160148 Free PMC article. Review.
-
Pathogenesis of multifocal micronodular pneumocyte hyperplasia and lymphangioleiomyomatosis in tuberous sclerosis and association with tuberous sclerosis genes TSC1 and TSC2.Pathol Int. 2001 Aug;51(8):585-94. doi: 10.1046/j.1440-1827.2001.01242.x. Pathol Int. 2001. PMID: 11564212 Review.
Cited by
-
LAM Cells as Potential Drivers of Senescence in Lymphangioleiomyomatosis Microenvironment.Int J Mol Sci. 2022 Jun 24;23(13):7040. doi: 10.3390/ijms23137040. Int J Mol Sci. 2022. PMID: 35806041 Free PMC article.
-
Possible Novel Therapeutic Targets in Lymphangioleiomyomatosis Treatment.Front Med (Lausanne). 2020 Sep 24;7:554134. doi: 10.3389/fmed.2020.554134. eCollection 2020. Front Med (Lausanne). 2020. PMID: 33072782 Free PMC article. Review.
-
Inhibition of the mechanistic target of rapamycin induces cell survival via MAPK in tuberous sclerosis complex.Orphanet J Rare Dis. 2020 Aug 17;15(1):209. doi: 10.1186/s13023-020-01490-w. Orphanet J Rare Dis. 2020. PMID: 32807195 Free PMC article.
-
Inhibition of NAMPT as a therapeutic strategy to suppress tumor growth in lymphangioleiomyomatosis.Biochim Biophys Acta Mol Cell Res. 2025 Aug;1872(6):119986. doi: 10.1016/j.bbamcr.2025.119986. Epub 2025 May 8. Biochim Biophys Acta Mol Cell Res. 2025. PMID: 40348345
-
EVI1 as a Prognostic and Predictive Biomarker of Clear Cell Renal Cell Carcinoma.Cancers (Basel). 2020 Jan 28;12(2):300. doi: 10.3390/cancers12020300. Cancers (Basel). 2020. PMID: 32012804 Free PMC article.
References
-
- Northrup H, Krueger DA, International Tuberous Sclerosis Complex Consensus Group Tuberous sclerosis complex diagnostic criteria update: recommendations of the 2012 Iinternational Tuberous Sclerosis Complex Consensus Conference. Pediatr Neurol. 2013;49:243–254. doi: 10.1016/j.pediatrneurol.2013.08.001. - DOI - PMC - PubMed
-
- Gupta N, et al. Lymphangioleiomyomatosis Diagnosis and Management: High-Resolution Chest Computed Tomography, Transbronchial Lung Biopsy, and Pleural Disease Management. An Official American Thoracic Society/Japanese Respiratory Society Clinical Practice Guideline. Am J Respir Crit Care Med. 2017;196:1337–1348. doi: 10.1164/rccm.201709-1965ST. - DOI - PMC - PubMed
Publication types
MeSH terms
Substances
Supplementary concepts
Grants and funding
LinkOut - more resources
Full Text Sources
Medical
Molecular Biology Databases
