. 2019 Feb 28;9(1):3185.
doi: 10.1038/s41598-019-39676-3.

Elucidating the Contribution of Skeletal Muscle Ion Channels to Amyotrophic Lateral Sclerosis in search of new therapeutic options

Affiliations

Elucidating the Contribution of Skeletal Muscle Ion Channels to Amyotrophic Lateral Sclerosis in search of new therapeutic options

Giulia Maria Camerino et al. Sci Rep. .

Abstract

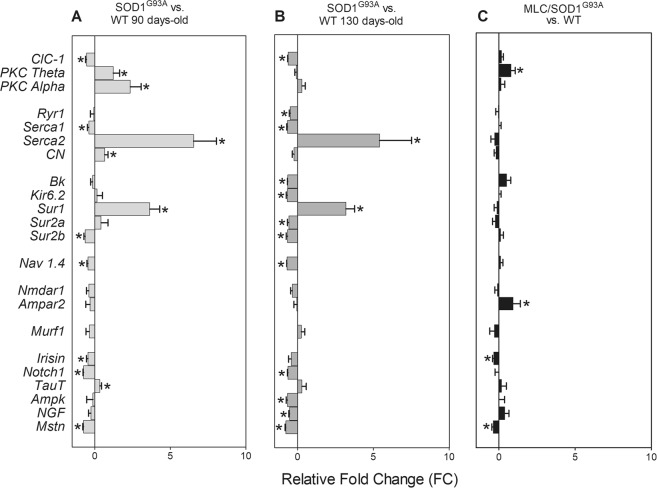
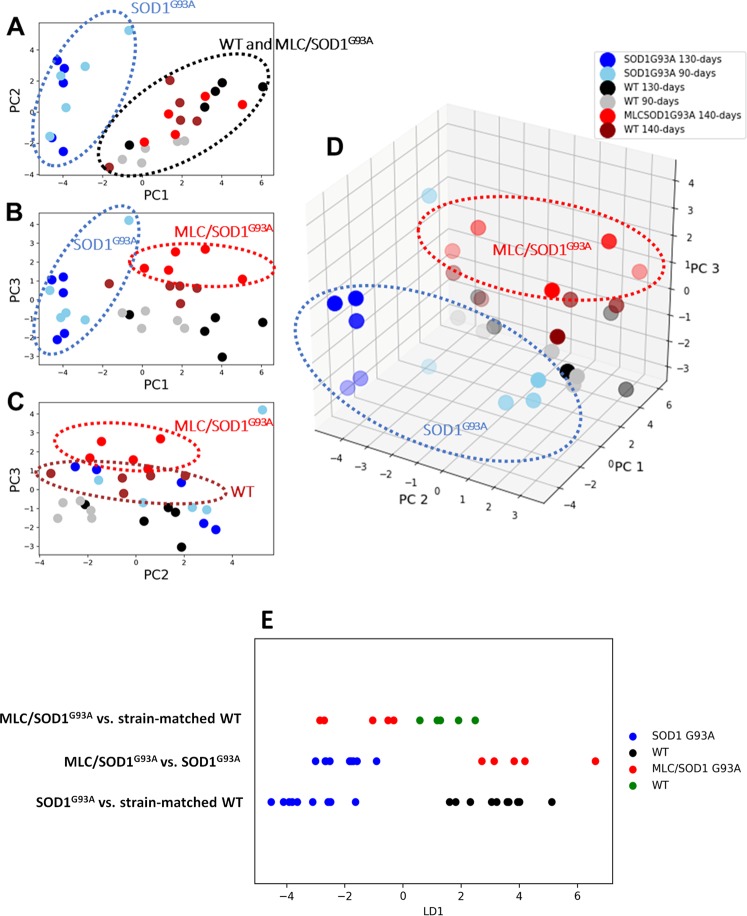
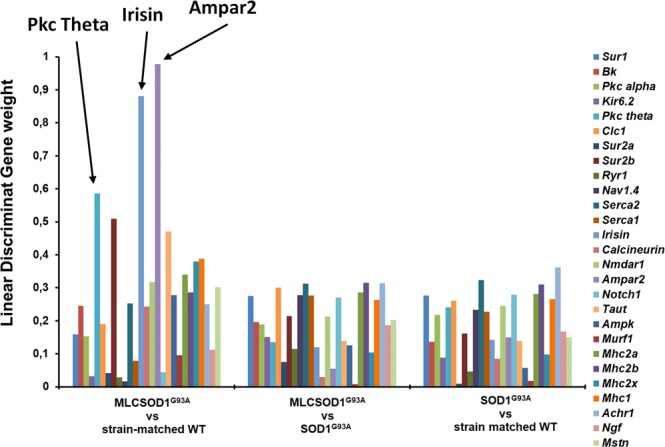
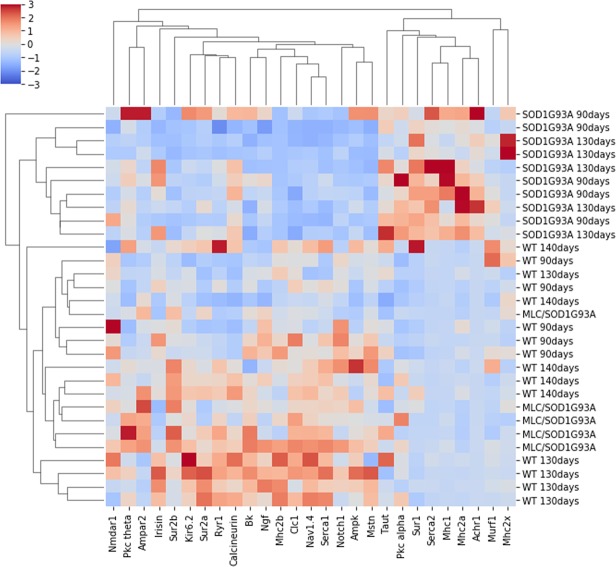
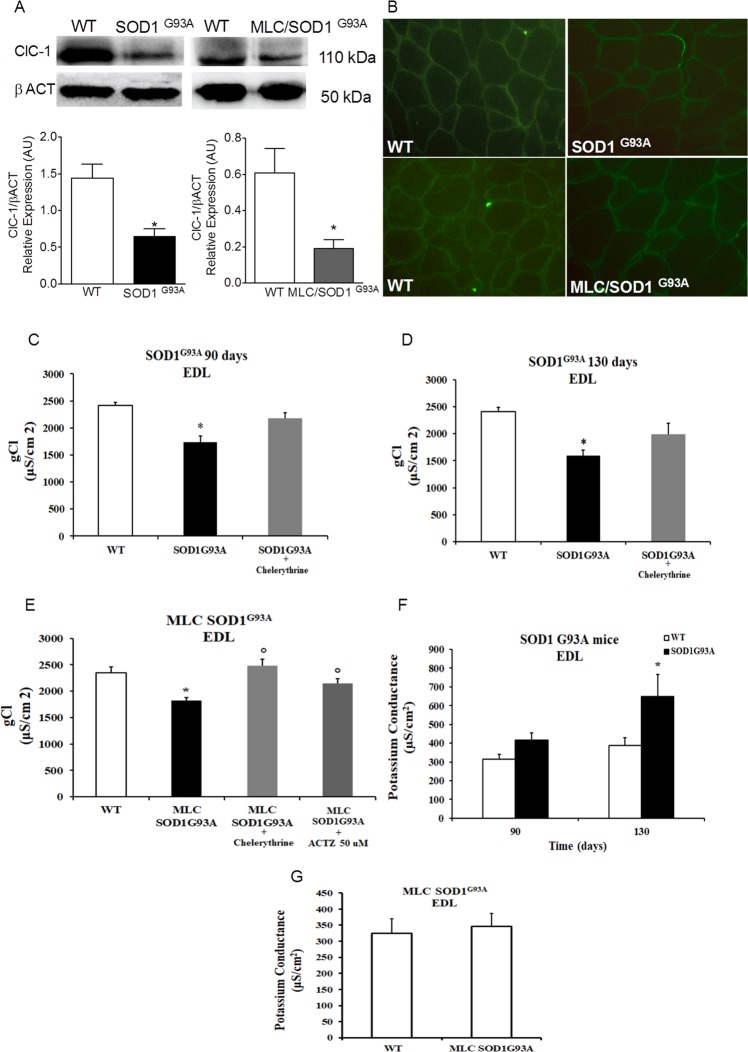
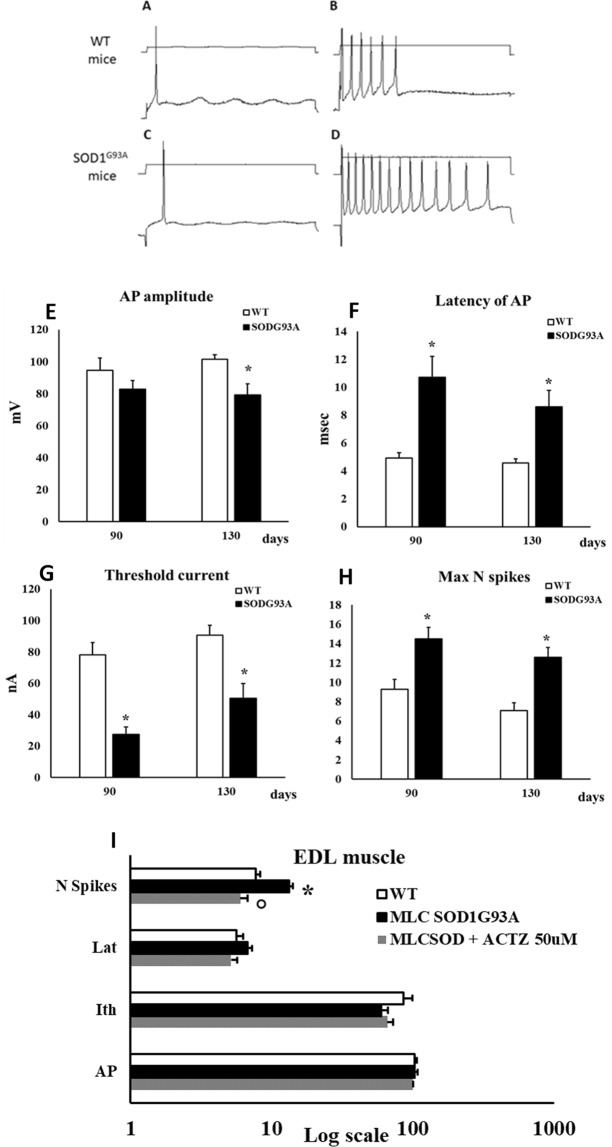
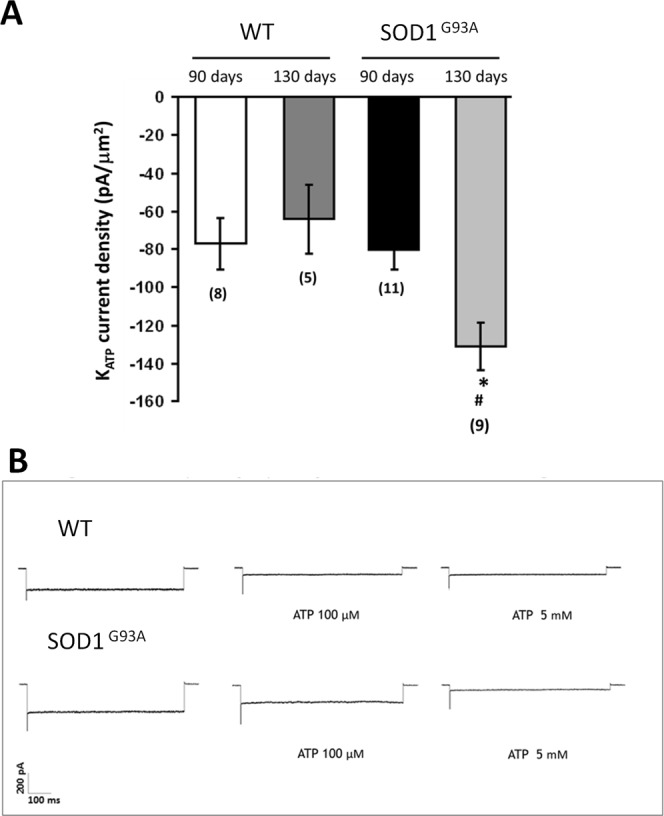
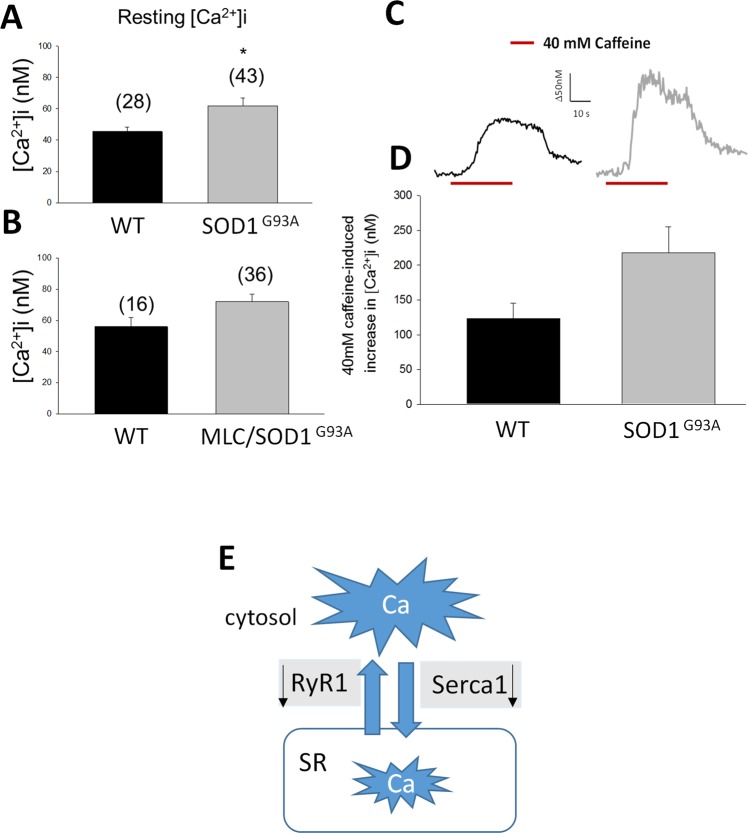
The discovery of pathogenetic mechanisms is essential to identify new therapeutic approaches in Amyotrophic Lateral Sclerosis (ALS). Here we investigated the role of the most important ion channels in skeletal muscle of an ALS animal model (MLC/SOD1G93A) carrying a mutated SOD1 exclusively in this tissue, avoiding motor-neuron involvement. Ion channels are fundamental proteins for muscle function, and also to sustain neuromuscular junction and nerve integrity. By a multivariate statistical analysis, using machine learning algorithms, we identified the discriminant genes in MLC/SOD1G93A mice. Surprisingly, the expression of ClC-1 chloride channel, present only in skeletal muscle, was reduced. Also, the expression of Protein Kinase-C, known to control ClC-1 activity, was increased, causing its inhibition. The functional characterization confirmed the reduction of ClC-1 activity, leading to hyperexcitability and impaired relaxation. The increased expression of ion channel coupled AMPA-receptor may contribute to sustained depolarization and functional impairment. Also, the decreased expression of irisin, a muscle-secreted peptide protecting brain function, may disturb muscle-nerve connection. Interestingly, the in-vitro application of chelerythrine or acetazolamide, restored ClC-1 activity and sarcolemma hyperexcitability in these mice. These findings show that ion channel function impairment in skeletal muscle may lead to motor-neuron increased vulnerability, and opens the possibility to investigate on new compounds as promising therapy.


Conflict of interest statement

The authors declare no competing interests.

Figures

Figure 1
Figure 1
Gene expression changes in SOD1G93A and MLC/SOD1G93A mice. mRNA levels of target genes in Tibialis Anterior (TA) muscles of 90 days-old (A), 130 days old (B) SOD1G93A and (C) MLC/SOD1G93A mice (140 days-old). Data are expressed as Relative Fold Change (FC, calculated as [(Transgenic/ctrl value)-1]) versus the strain- and age-matched controls, of transcript levels performed by Real-Time PCR, for chloride channel ClC1, Protein Kinase C theta (PKC theta), Protein Kinase C alpha (PKC alpha), Ryanodine Receptor 1 (Ryr1), SERCA1, SERCA2, Calcineurin (CN), BK, Kir6.2, Sur1, Sur2, Sur2a, Sur2b, Nav1.4, Nmdar1, Ampar2, Murf1, Irisin, Notch1, TauT, Ampk, Nerve Growth Factor (NGF), Myostatin (Mstn) normalized by β-Actin housekeeping gene, in the 6 experimental groups. Each bar represents the FC ± S.E.M. Five muscles for each experimental group were analyzed and each muscle was analyzed in triplicate.
Figure 2
Figure 2
Principal Component Analysis (PCA) and Linear Discriminant Analysis (LDA) of PCA scores. Scatterplot of PC score onto the first three selected PC. In (A) are shown PC score on PC1 and PC2, in (B) of PC1 and PC3, in (C) of PC2 and PC3, as 2-dimensional graphs. In (D) a 3-dimensional scatterplot of the same PC scores. Each dot represents the intersection of PC scores of the animal muscles (n = 30) onto PC1, PC2 and PC3. PC score are linear combinations of initial gene expression values of target genes and their corresponding loading weights in the considered PC. (E) Linear scatter-plots showing the results of the 3 Linear Discriminant Analysis (LDAs) of the first three PC scores. Red dots are MLC/SOD1G93A muscles Linear Discriminant (LD) scores, green dots are the strain-matched WT LD scores, blue dots are SOD1G93A LD scores and black dots strain-matched WT LD scores. On the top was showed the first LD, that better separates red and green dots representing MLC/SOD1G93A and their WT, respectively. In the middle part, LD that better separates MLC/SOD1G93A and SOD1G93A muscles, shown as red and blue dots, respectively. On the bottom, LD that better separates SOD1G93A and their WT, shown as blue and black dots, respectively.
Figure 3
Figure 3
PCA/LDA Discriminant Genes. Barplots of Linear Discriminant loading weights of each gene in the three PCA-LDA analysis performed. Each bar represents the weight of the variable in order to discriminate between: (on the left) MLC/SOD1G93A vs. strain matched WT, (in the middle) MLC/SOD1G93A vs. SOD1G93A and (on the right) SOD1G93A vs. strain-matched WT PCA scores. On the right, a legend showing the colors-code to identify the mRNA LD gene loading weight of the target genes. Arrows indicates the most affected genes.
Figure 4
Figure 4
Hierarchical agglomerative clustering of gene expression data. Heatmap of unsupervised machine learning algorithm to perform clusterization of muscles based on gene expression levels. TA muscles and mRNA levels segregated into two principal clusters also in this case, as showed by hierarchical dendrograms of rows and columns. Each square represents the standardized gene expression level normalized with β-actin housekeeping gene in TA muscle of target genes. The columns report target genes, rows report the analysed muscles. Genes and muscles are sorted by hierarchical agglomerative clustering algorithm. Plotted data consists of the entire dataset of animals (SOD1G93A, MLC/SOD1G93A and their strain-matched WT as control).
Figure 5
Figure 5
ClC-1 chloride channel expression and activity in MLC/SOD1G93A and SOD1G93A mice. (A) Representative Western blot showing the expression level of ClC-1 protein in TA muscle tissue of SOD1G93A and MLC/SOD1G93A mice. The blots were reacted with specific antibodies. β-actin was used to normalize the blot. Gel images are cropped from the blot shown in the Supplementary Figs S7 and S8. Histograms show quantification of relative protein levels calculated by normalization of the absolute intensity of target protein with the absolute intensity of β-actin, as reference standard, and are represented as arbitrary units (AU). Each bar represents the mean ± SEM from five muscles.* Significantly different with respect to WT (at least P < 0.05) by Student’s t-test. (B) Immunofluorescence assay in TA muscle of MLC/SOD1G93A and WT mice and in Gastrocnemius muscle of SOD1G93A mice and WT. The presence of ClC-1 protein in muscle section was shown by specific antibodies. The images are 20X magnification. (C-G) The component ionic conductances measured in EDL muscle of SOD1G93A and MLC/SOD1G93A animals. Values are expressed as mean ± S.E.M. from five animals for each experimental condition (10–46 fibers were analyzed in each group of animals). (C,D) The macroscopic Chloride Conductance (gCl) measured in EDL muscles fibers of SOD1G93A animals at the two selected ages and effects of the in-vitro application of chelerythrine (1 µM). Statistical analysis was performed using one-way ANOVA followed by Bonferroni post-hoc t-test (F = 15.8, df = 2, P < 0.0001, for gCl in SOD1G93A at 90-days) (F = 16.6, df = 2, P < 0.0001 for gCl in SOD1G93A at 130-days). *Significantly different vs. age-matched WT (at least P < 0.05). (E) Macroscopic gCl measured in EDL muscles fibers of MLC/SOD1G93A animals and effect of in-vitro application of Chelerythrine (1 µM) or Acetazolamide (ACTZ, 50 µM). Statistical analysis was performed using one-way ANOVA followed by Bonferroni post-hoc t-test (F = 12.5, df = 3, P < 0.0001, for gCl in MLC/SOD1G93A). *Significantly different vs. age-matched WT (at least P < 0.05). °Significantly different vs. MLC/SOD1G93A (at least P < 0.05). (F) The macroscopic Potassium Conductance (gK) measured in EDL muscles fibers of SOD1G93A animals at the two selected ages (F = 5.18, df = 3, P < 0.005, for gK in SOD1G93A). *Significantly different vs. age-matched WT (at least P < 0.05). (G) The macroscopic gK measured in EDL muscle of MLC/SOD1G93A mice (no significant differences were found).
Figure 6
Figure 6
Sarcolemma excitability parameters measured in EDL muscle of SOD1G93A and MLC/SOD1G93A animals. (A–D) Representative traces of the Action Potential (AP) recorded in EDL muscle fibers by standard two microelectrodes technique at 0.05 mm distance between electrodes, in response to depolarizing square-wave current pulse. (A,B) images showed traces recorded in EDL fibers of WT animals. (C,D) showed the traces recorded in SOD1G93A mice. On the left, it has been used a minimal squared-wave current pulse to elicit the single AP. On the right it has been used the minimum pulse to elicit the maximum number of spikes. (E–H) Excitability parameters of EDL muscle fibers of SOD1G93A animals at 90 and 130 days of age. Values are expressed as mean ± S.E.M from 10–16 fibers. In (A) the AP amplitude, in (B) the latency time of AP, in (C) the threshold current needed to elicit a single AP (Ith) and in (D) the maximum number of elicitable spikes (Max N spikes). Statistical analysis was performed using one-way ANOVA followed by Bonferroni post-hoc t-test (F = 3.8, df = 3, P < 0.02 for AP; F = 10.06, df = 3, P < 0.0001, for Lat; F = 18.2, df = 3, P < 0.0001, for Ith; F = 8.1, df = 3, P < 0.0001 for N spikes). *Significantly different vs. age-matched control group (at least P < 0.05). (I) Excitability parameters of EDL muscle fibers of MLC/SOD1G93A animals. Values are expressed as mean ± S.E.M. from 10–20 fibers. The excitability parameters were recorded in the absence and in the presence of 50 µM ACTZ. To note, because of the Log scale, the measure units are omitted and are: for Action Potential amplitude (AP) mV; for the threshold current amplitude (Ith) nA; for the latency of AP (Lat) msec; and for the maximum number of elicitable AP (N spikes). Statistical analysis was performed using one-way ANOVA followed by Bonferroni post-hoc t-test (F = 26.86, df = 2, P < 0.0001, for N spikes). *Significantly different vs. WT (P < 0.05) °Significantly different vs. MLC/SOD1G93A (P < 0.05).
Figure 7
Figure 7
KATP channel current density from WT and SOD1G93A mice measured by patch clamp technique. Each bar is the mean ± SEM from the number of patches indicated in brackets. (A) significant difference among groups was found by one-way ANOVA analysis (F = 7.2; P < 0.0002). Bonferroni post hoc correction for individual differences between groups is as follows: significantly different * vs WT 130 days (P < 0.002); # vs SOD1G93A 90 days (P < 0.002). (B) Exposure of macropatches to intracellular ATP (100 µM–5 mM) induce a KATP current inhibition. The response of KATP channels to 100 µM ATP is changed in 130 days-old SOD1G93A mice.
Figure 8
Figure 8
Cytosolic resting calcium (restCa) level in EDL muscle fibers measured by FURA-2 cytofluorimetric technique. RestCa level measured in (A) 130 days-old SOD1G93A animals and in (B) 140 days-old MLC/SOD1G93A animals. *Significantly different with respect to WT animals (P < 0.05 by Unpaired Student t-test). (C) Representative traces showing a 40 mM caffeine-induced increase of restCa in WT (black trace) and in SOD1G93A (gray trace) mice. (D) Correspondent barplot constructed using the mean values ± S.E.M. obtained from 15–20 fibers. (E) Schematic representation of the decreased expression of RyR1 and SERCA1 mRNA (black arrows) responsible for the cytosolic calcium increase. Although the decreased expression of RyR in SOD1 G93A may indicate the reduction of Ca flux from SR to the cytosol, SERCA reduction slow down the reuptake in the SR. Slight modification in restCa level were observed in MLC/SOD1G93A animals in line with the lack of changes in RyR and SERCA expression.

Similar articles

Cited by

References

    1. Musarò A. Understanding ALS: new therapeutic approaches. FEBS J. 2013;280:4315–4322. doi: 10.1111/febs.12087. - DOI - PubMed
    1. Dobrowolny G, et al. Skeletal Muscle Is a Primary Target of SOD1 G93A-Mediated Toxicity. Cell Metabolism. 2008;8:425–436. doi: 10.1016/j.cmet.2008.09.002. - DOI - PubMed
    1. Dobrowolny G, Aucello M, Musarò A. Muscle atrophy induced by SOD1G93A expression does not involve the activation of caspase in the absence of denervation. Skelet. Muscle. 2011;1(1):3. doi: 10.1186/2044-5040-1-3. - DOI - PMC - PubMed
    1. Dobrowolny G, et al. Muscle Expression of SOD1G93A Triggers the Dismantlement of Neuromuscular Junction via PKC-Theta. Antioxid. Redox Signal. 2018;28:1105–1119. doi: 10.1089/ars.2017.7054. - DOI - PubMed
    1. Wong M, Martin LJ. Skeletal muscle-restricted expression of human SOD1 causes motor neuron degeneration in transgenic mice. Hum. Mol. Genet. 2010;19:2284–2302. doi: 10.1093/hmg/ddq106. - DOI - PMC - PubMed

Publication types