. 2019 Feb 28;9(1):3123.
doi: 10.1038/s41598-019-39781-3.

The CDR1 and Other Regions of Immunoglobulin Light Chains are Hot Spots for Amyloid Aggregation

Affiliations

The CDR1 and Other Regions of Immunoglobulin Light Chains are Hot Spots for Amyloid Aggregation

Robin Axel Ruiz-Zamora et al. Sci Rep. .

Abstract

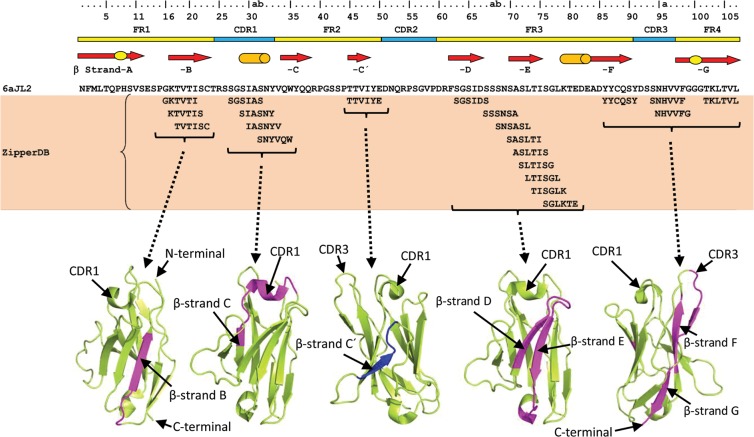
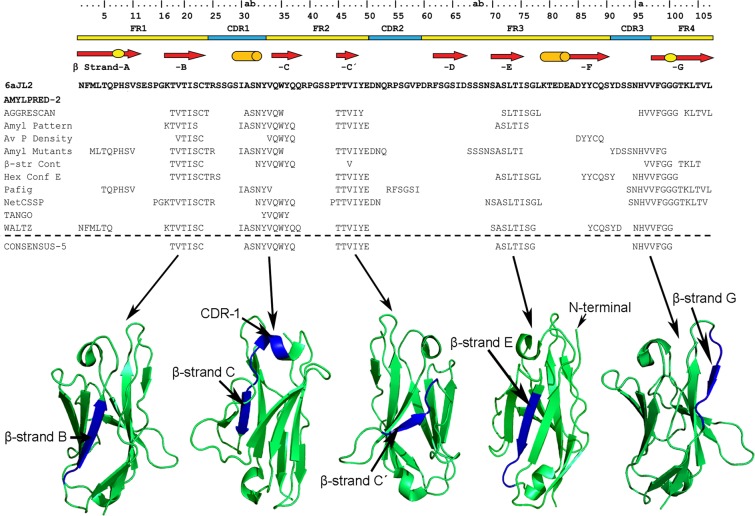
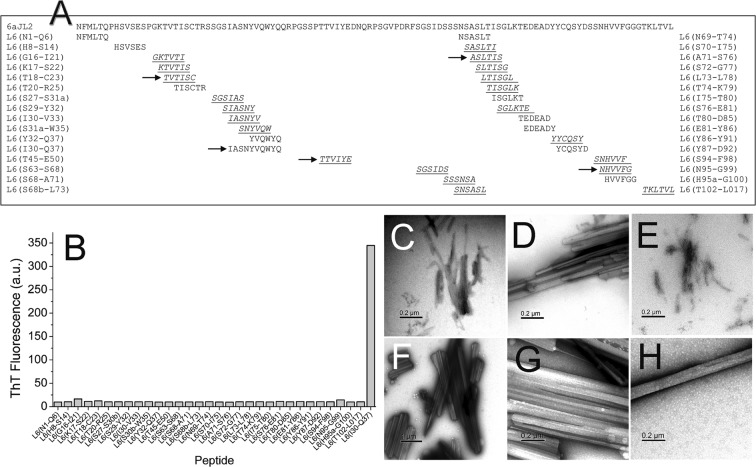
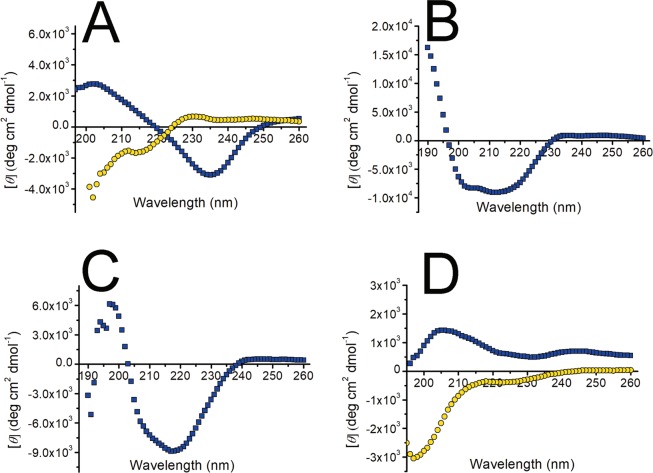
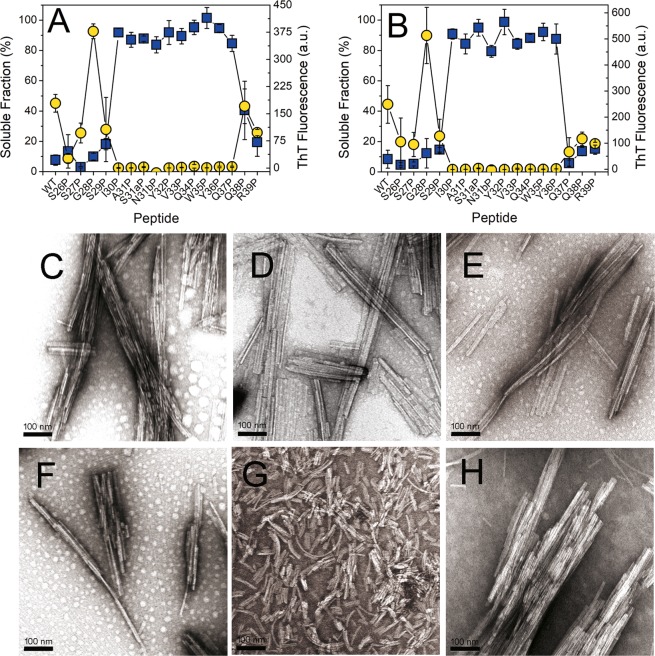
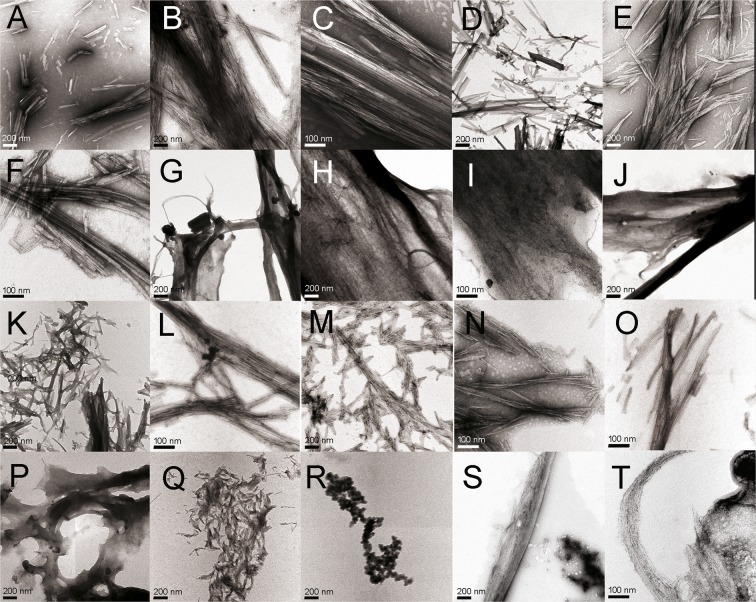
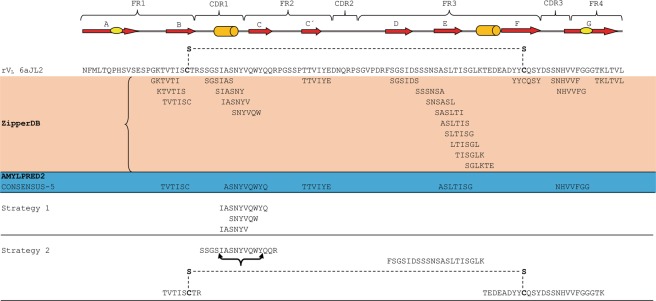
Immunoglobulin light chain-derived (AL) amyloidosis is a debilitating disease without known cure. Almost nothing is known about the structural factors driving the amyloidogenesis of the light chains. This study aimed to identify the fibrillogenic hotspots of the model protein 6aJL2 and in pursuing this goal, two complementary approaches were applied. One of them was based on several web-based computational tools optimized to predict fibrillogenic/aggregation-prone sequences based on different structural and biophysical properties of the polypeptide chain. Then, the predictions were confirmed with an ad-hoc synthetic peptide library. In the second approach, 6aJL2 protein was proteolyzed with trypsin, and the products incubated in aggregation-promoting conditions. Then, the aggregation-prone fragments were identified by combining standard proteomic methods, and the results validated with a set of synthetic peptides with the sequence of the tryptic fragments. Both strategies coincided to identify a fibrillogenic hotspot located at the CDR1 and β-strand C of the protein, which was confirmed by scanning proline mutagenesis analysis. However, only the proteolysis-based strategy revealed additional fibrillogenic hotspots in two other regions of the protein. It was shown that a fibrillogenic hotspot associated to the CDR1 is also encoded by several κ and λ germline variable domain gene segments. Some parts of this study have been included in the chapter "The Structural Determinants of the Immunoglobulin Light Chain Amyloid Aggregation", published in Physical Biology of Proteins and Peptides, Springer 2015 (ISBN 978-3-319-21687-4).


Conflict of interest statement

The authors declare no competing interests.

Figures

Figure 1
Figure 1
Segments of 6aJL2 protein predicted to be fibrillogenic by the computational tool ZipperDB, (https://services.mbi.ucla.edu/zipperdb/). The hexamers shown are those with a Rosetta energy ≤−23 kcal/mol, which are predicted to form fibrils. The location of the clusters of the amyloidogenic hexamers is shown highlighted in magenta in the three-dimensional structure of 6aJL2 protein (bottom). The regions of 6aJL2 protein with β-strands or helix conformation in the native state are indicated by arrows and cylinders, respectively (Top). The oval figures in the first and last arrows represent, respectively, the sheet-switch motif characterizing the structure of the N-terminal segment, and the β-bulge centred at Gly100 in the β-strand G. The residue numbering and the location of the CDR/FR regions are according to Chothia and Lesk. The graphical representations of 6aJL2 structure were prepared with PyMOL, based on the structure contained in the PDB 2W0K.
Figure 2
Figure 2
Consensus sequences (CONSENSUS-5) generated by the AmylPred2 tool from the analysis of the 6aJL2 protein with 10 different algorithms designed for predicting aggregation/fibrillogenic-prone sequences. The individual prediction of each method is also shown. The regions of 6aJL2 protein with β-strands or helix conformation in the native state are indicated as in Fig. 1. The residue numbering and the location of the CDR/FR regions are according to Chothia and Lesk. The graphical representations of 6aJL2 structure were prepared with PyMOL, based on the structure contained in the PDB 2W0K.
Figure 3
Figure 3
(A) Prediction-based synthetic peptide library composed of thirty-one hexapeptide and one decapeptide designed for testing the predictions of fibrillogenic/aggregation prone sequences in the rVL protein 6aJL2 generated by the web-based computational tools ZipperDB and AmylPred2. The arrows point the consensus sequences predicted to be aggregation/fibrillogenic-prone by the tool AmylPred2. The sequences underlined and italized represent the hexapeptides forming steric zippers with a fit energy of −23 kcal/mol or lower, as calculated with RosettaDesign. Segments with energies equal to or below this threshold are deemed to have high fibrillation propensity. (B) Aggregation assay of the synthetic peptides composing the prediction-based peptide library. The data represented is the thioflavin T (ThT) fluorescence intensity of the peptide samples (250 µM peptide dilution in PBS pH 7.4 plus 0.05% Na Azide), measured after 24 hours of incubation at 37 °C with constant agitation. Two replicas of the experiment were performed with very similar results (Result not shown). (CH) Transmission electron micrographs of the aggregates present in the end-point samples of the synthetic peptides Ile30-Gln37 (C,D), Ile30-Val33 (E), and Ser30b-Trp35 (FH).
Figure 4
Figure 4
Far-UV circular dichroism spectra of peptide (A) Ile30-Gln37, (B) Ser26-Arg39, (C) tryptic fragment Thr18-Arg25-S-S-Thr80-Lys103, and (D) Phe62-Lys79 before (yellow circles) and after (blue squares) the fibrillogenesis assay, performed as described in Methods.
Figure 5
Figure 5
X-ray fibre diffraction (XRFD) patterns from partially aligned fibrils formed by synthetic peptides (A) Ser30b-Trp35 and (B) Ile30-Gln37 incubated in MilliQ-quality water plus Na azide 0.05%, as described in Methods. (D,E) show transmission electron micrographs of the aggregates whose XRFD pattern are shown in panels A and B, respectively. The images were obtained with a HITACHI-7100 transmission electron microscope (C). Comparison of the experimental XRFD pattern of the aggregates of the peptide Ser30b-Trp35, as shown in (A), and the simulated pattern (inserted quadrant) calculated based on the theoretical model shown in (F). Black arrows are shown to highlight positions of matching major diffraction signal positions on the equator and meridian. (F) Structural model of the steric zipper of peptide Ser30b-Trp35, generated by the computational tool ZipperDB. The amino acid side chains are shown in stick representation and named with the one-letter code. The dotted lines represent intra- and interpeptide H-bonds stabilizing the crystal lattice. Figure prepared with PyMOL.
Figure 6
Figure 6
(A) RP-HPLC elution profile of the products of the proteolysis of soluble 6aJL2 protein with trypsin. Prior to be injected into the column, the sample was reduced by adding 10 mM dithiothreitol (DTT). The data represented are the time-dependence variation of (black line) absorbance at 216 nm or (blue line) intrinsic fluorescence at 350 nm, exciting the sample at 295 nm. (B) Identification of the proteolytic fragments of 6aJL2 protein contained in the chromatography fractions collected in A) by MALDI-TOF mass spectrometry analysis. arefers to the fractions identified with the same letter code in panel (A). R.T./min refers to the retention time (minutes) of each fraction in the RP-HPLC analysis. brefers to the mass (Da) determined experimentally by MALDI-TOF mass spectrometry analysis. crefers to the segment of protein 6aJL2 identified as the best-matching sequence for each experimental mass determined by means of the web-based computational tool FindPept (http://web.expasy.org/findpept/).
Figure 7
Figure 7
RP-HPLC analysis of (A) the aggregates harvested serially during the first seven hours (0, 15 min, 30 min, 45 min, 1 h, 2 h, 3 h, 4 h, 5 h, 6 h and 7 h) and (B) after 18 hours of incubation (see Methods) of the products of the proteolysis of 6aJL2 protein with trypsin. The data represented in A and B is the absorbance at 216 nm. In B, the chromatographic profiles of the aggregates analysed in non-reducing (black line) and pre-incubated with 10 mM of DTT (blue line) are shown. Note that the peak with R.T. = 25.47 min, which represent the elution of the fragment Thr18-Arg25-S-S-Thr80-Lys103, is absent in the chromatogram of the reduced sample. Instead, two new peaks appear, with R.T. = 19.36 min and 26.07 min, respectively, which represent the separate elution of the individual peptides. (C) Identification of the proteolytic fragments of 6aJL2 protein contained in the fractions of the chromatography separation shown in panels B). a, band cmean the same as in Fig. 6. (D) Electron micrograph of the aggregates harvested after the overnight incubation of the products of proteolysis of the 6aJL2 protein with trypsin. (E) Proteolytic fragments recovered from the aggregates after the overnight incubation of the products of proteolysis of the protein with trypsin, as determined by combining RP-HPLC and MALDI-TOF mass spectrometry. The structural contribution of each fragment to the native 6aJL2 protein is shown with reference to the crystallographic structure of the protein (PDB ID 2W0K).
Figure 8
Figure 8
(A) Fibrillogenesis assay of the synthetic peptides with the sequence of the tryptic fragments of 6aJL2. Transmission electron micrographs of the aggregates formed by the synthetic peptides (B) Ser26-Arg39, (C) Ser26-Arg54, and (D) Phe62-Lys79 in the aggregation assay shown in panel (A). The images were obtained with a HITACHI-7100 transmission electron microscope. (E) Fibrillogenesis assay of the proteolytic fragment Thr18-Arg25-S-S-Thr80-Lys103 incubated in absence (T18-R25-S-S-T80-K103) or in presence of 10 mM DTT (T18-R25-S-S-T80-K103 + DTT). Fragment Thr18-Arg25-S-S-Thr80-Lys103 was generated by proteolysis of soluble 6aJL2 protein with trypsin and then purified by RP-HPLC, as described in Methods. Transmission electron micrographs of the aggregates formed by the tryptic fragment Thr18-Arg25-S-S-Thr80-Lys103 incubated in (F) absence or (G) in presence of 10 mM DTT, as shown in panel (E). The images were obtained with a CARL ZEISS Libra 120 transmission electron microscope. In (A) the data represented is the mean value ± S.D. of thioflavin T fluorescence emission at 482 nm of triplicate samples at the end of the experiment. In (E) the data represented is the mean ± 95 C.I. of the thioflavin T fluorescence emission at 482 nm of duplicated samples.
Figure 9
Figure 9
Fibrillogenesis of the single mutants of the highly fibrillogenic peptide Ser26-Arg39 to proline (Scanning proline mutagenesis analysis). Panels (A,B) show the mean value plus the standard deviation of soluble fraction (blue squares) and ThT fluorescence (yellow circles) calculated from triplicates samples after (A) 16 hours and (B) 40 hours of incubation. Transmission electron micrographs of the aggregates formed by the point mutant peptides (C) Ser26Pro, (D) Ser27Pro, (E) Gly28Pro, (F) Ser29Pro, (G) Gln38Pro and (H) Arg39Pro. The scale bars represent 100 nm. The images were obtained with a HITACHI-7100 transmission electron microscope.
Figure 10
Figure 10
Transmission electron micrographs of the aggregates produced by the synthetic peptides with the sequence from position 26 to 39 of the human light chains, encoded by the VL gene segments (AC) IGLV6-57 (peptide λ6-6a), (DF) IGLV1-36 (peptide λ1-1a), (GI) IGLV1-40 (peptide λ1-1e), (JL) IGLV2-14 (peptide λ2-2a2), (MO) IGKV1-16 (peptide κ1-L1), (PR) IGKV1-33 (κ1-018), and (S,T) IGKV4-1 (peptide κ4-B3). The peptide sequence is shown in Table S11. The images were obtained with a CARL ZEISS Libra 120 transmission electron microscope.
Figure 11
Figure 11
Comparison of the sequences of 6aJL2 protein predicted to be fibrillogenic/aggregation-prone by the computational tools ZipperDB and AmylPred2 and the fibril-forming segments identified by the two different experimental strategies implemented in this study. Strategy 1 and 2 refer to the “prediction-based” and “proteolysis-based” strategies, respectively, which are described in detail in Methods. The segments of the protein folded as β-strand and α helix are represented as red arrows and green cylinders, respectively. The Framework (FR) and Complementarity Determining Regions (CDR) are indicated at the top of the figure. The sequence of protein 6aJL2 is shown in “one letter” code. The conserved intradomain disulphide bond Cys23-Cys88 is shown as a dashed line in the sequence of 6aJL2 protein and in the tryptic fragment Thr18-Arg25-S-S-Thr80-Lys103. The black curly bracket below the sequence SSGSIASNYVQWYQQR indicates the segment that proved to be sensitive to Pro mutation by scanning proline mutagenesis analysis.

Similar articles

Cited by

References

    1. Glenner GG, Harbaugh J, Ohma JI, Harada M, Cuatrecasas P. An amyloid protein: the amino-terminal variable fragment of an immunoglobulin light chain. Biochem Biophys Res Commun. 1970;41:1287–1289. doi: 10.1016/0006-291X(70)90227-5. - DOI - PubMed
    1. Kastritis E, Dimopoulos MA. Recent advances in the management of AL Amyloidosis. British journal of haematology. 2016;172:170–186. doi: 10.1111/bjh.13805. - DOI - PubMed
    1. Palladini G, Comenzo RL. The challenge of systemic immunoglobulin light-chain amyloidosis (Al) Subcell Biochem. 2012;65:609–642. doi: 10.1007/978-94-007-5416-4_22. - DOI - PubMed
    1. Hurle MR, Helms LR, Li L, Chan W, Wetzel R. A role for destabilizing amino acid replacements in light-chain amyloidosis. Proc Natl Acad Sci USA. 1994;91:5446–5450. doi: 10.1073/pnas.91.12.5446. - DOI - PMC - PubMed
    1. Wetzel R. Domain stability in immunoglobulin light chain deposition disorders. Adv Protein Chem. 1997;50:183–242. doi: 10.1016/S0065-3233(08)60322-8. - DOI - PubMed

Publication types

MeSH terms

Substances