

Automatic Choroid Layer Segmentation from Optical Coherence Tomography Images Using Deep Learning
- PMID: 30816296
- PMCID: PMC6395677
- DOI: 10.1038/s41598-019-39795-x
Automatic Choroid Layer Segmentation from Optical Coherence Tomography Images Using Deep Learning
Erratum in
-
Publisher Correction: Automatic Choroid Layer Segmentation from Optical Coherence Tomography Images Using Deep Learning.Sci Rep. 2019 Dec 13;9(1):19381. doi: 10.1038/s41598-019-48368-x. Sci Rep. 2019. PMID: 31836721 Free PMC article.
Abstract
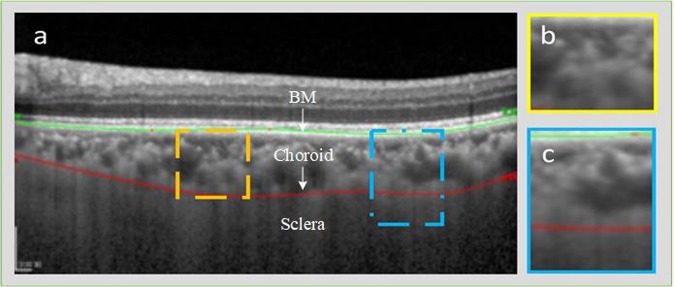
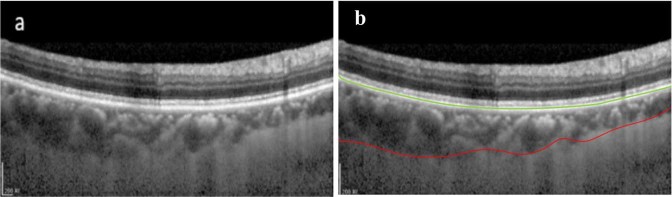
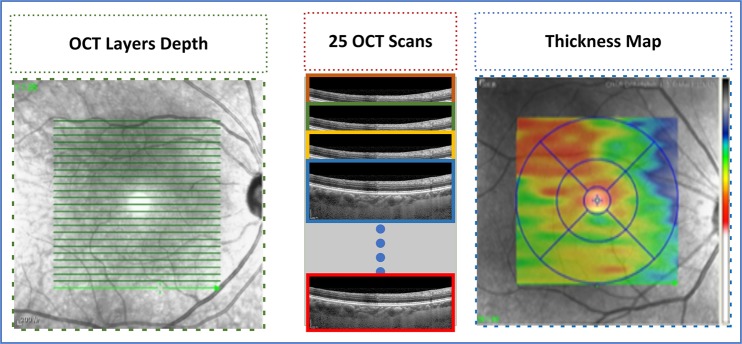
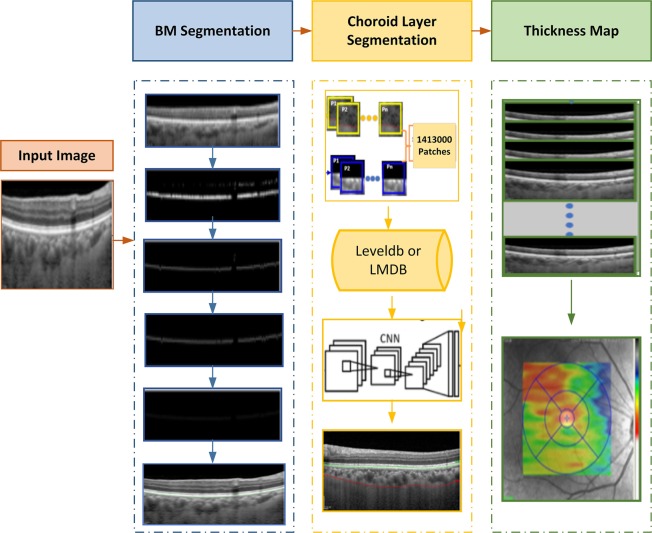
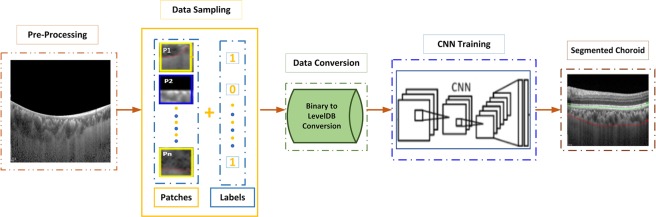
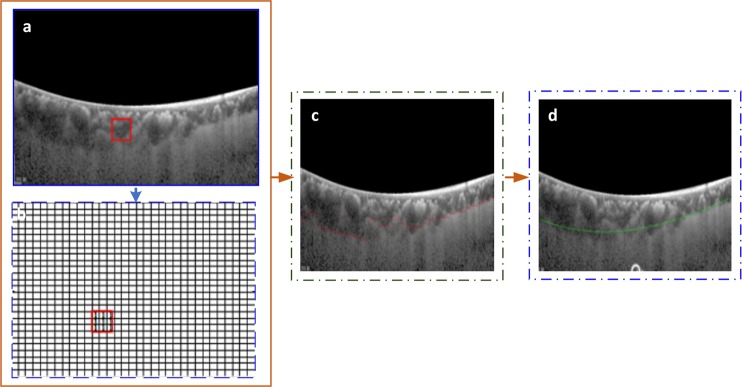
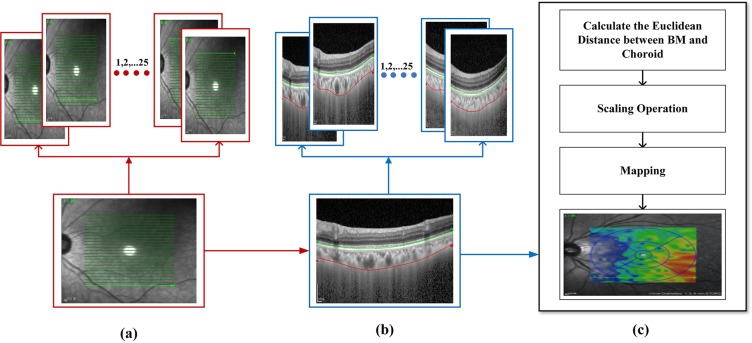
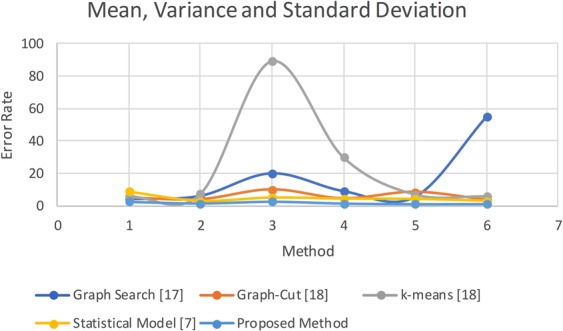
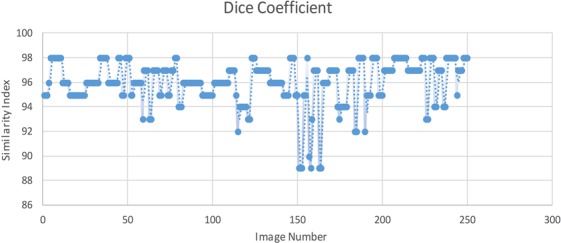
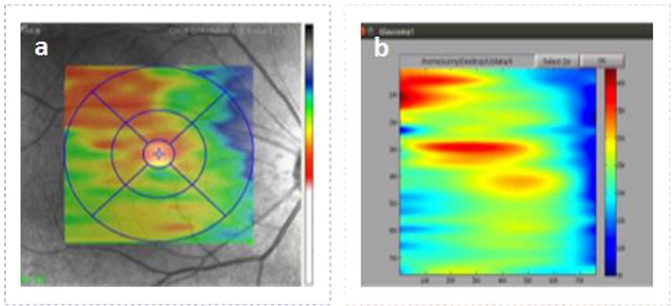
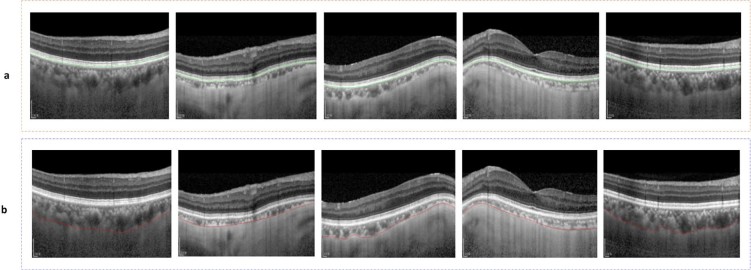
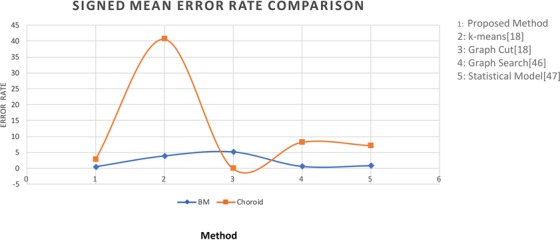
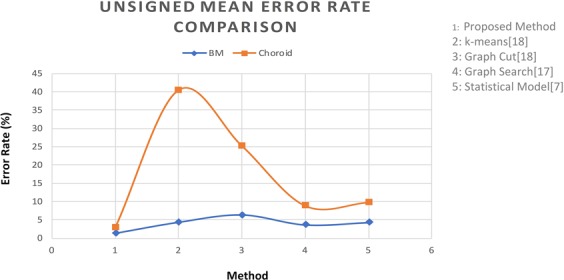
The choroid layer is a vascular layer in human retina and its main function is to provide oxygen and support to the retina. Various studies have shown that the thickness of the choroid layer is correlated with the diagnosis of several ophthalmic diseases. For example, diabetic macular edema (DME) is a leading cause of vision loss in patients with diabetes. Despite contemporary advances, automatic segmentation of the choroid layer remains a challenging task due to low contrast, inhomogeneous intensity, inconsistent texture and ambiguous boundaries between the choroid and sclera in Optical Coherence Tomography (OCT) images. The majority of currently implemented methods manually or semi-automatically segment out the region of interest. While many fully automatic methods exist in the context of choroid layer segmentation, more effective and accurate automatic methods are required in order to employ these methods in the clinical sector. This paper proposed and implemented an automatic method for choroid layer segmentation in OCT images using deep learning and a series of morphological operations. The aim of this research was to segment out Bruch's Membrane (BM) and choroid layer to calculate the thickness map. BM was segmented using a series of morphological operations, whereas the choroid layer was segmented using a deep learning approach as more image statistics were required to segment accurately. Several evaluation metrics were used to test and compare the proposed method against other existing methodologies. Experimental results showed that the proposed method greatly reduced the error rate when compared with the other state-of-the-art methods.
Conflict of interest statement
The authors declare no competing interests.
Figures


Similar articles
-
Deep Learning with Skip Connection Attention for Choroid Layer Segmentation in OCT Images.Annu Int Conf IEEE Eng Med Biol Soc. 2020 Jul;2020:1641-1645. doi: 10.1109/EMBC44109.2020.9175631. Annu Int Conf IEEE Eng Med Biol Soc. 2020. PMID: 33018310
-
An automated method for choroidal thickness measurement from Enhanced Depth Imaging Optical Coherence Tomography images.Comput Med Imaging Graph. 2018 Jan;63:41-51. doi: 10.1016/j.compmedimag.2018.01.001. Epub 2018 Jan 6. Comput Med Imaging Graph. 2018. PMID: 29366655 Free PMC article.
-
Automated choroid segmentation of three-dimensional SD-OCT images by incorporating EDI-OCT images.Comput Methods Programs Biomed. 2018 May;158:161-171. doi: 10.1016/j.cmpb.2017.11.002. Epub 2017 Nov 4. Comput Methods Programs Biomed. 2018. PMID: 29544782
-
An Update on Choroidal Layer Segmentation Methods in Optical Coherence Tomography Images: a Review.J Biomed Phys Eng. 2022 Feb 1;12(1):1-20. doi: 10.31661/jbpe.v0i0.1234. eCollection 2022 Feb. J Biomed Phys Eng. 2022. PMID: 35155288 Free PMC article. Review.
-
Recent Advanced Deep Learning Architectures for Retinal Fluid Segmentation on Optical Coherence Tomography Images.Sensors (Basel). 2022 Apr 15;22(8):3055. doi: 10.3390/s22083055. Sensors (Basel). 2022. PMID: 35459040 Free PMC article. Review.
Cited by
-
Early Diagnosis of Multiple Sclerosis Using Swept-Source Optical Coherence Tomography and Convolutional Neural Networks Trained with Data Augmentation.Sensors (Basel). 2021 Dec 27;22(1):167. doi: 10.3390/s22010167. Sensors (Basel). 2021. PMID: 35009710 Free PMC article.
-
Automated segmentation of choroidal layers from 3-dimensional macular optical coherence tomography scans.J Neurosci Methods. 2021 Aug 1;360:109267. doi: 10.1016/j.jneumeth.2021.109267. Epub 2021 Jun 19. J Neurosci Methods. 2021. PMID: 34157370 Free PMC article.
-
Effect of Nasal Septum Deviation on the Choroidal Thickness.Cureus. 2023 Apr 19;15(4):e37840. doi: 10.7759/cureus.37840. eCollection 2023 Apr. Cureus. 2023. PMID: 37213969 Free PMC article.
-
Semi-Automated Extraction of Lens Fragments via a Surgical Robot Using Semantic Segmentation of OCT Images with Deep Learning - Experimental Results in ex vivo Animal Model.IEEE Robot Autom Lett. 2021 Jul;6(3):5261-5268. doi: 10.1109/LRA.2021.3072574. Epub 2021 Apr 12. IEEE Robot Autom Lett. 2021. PMID: 34621980 Free PMC article.
-
Automatic fovea detection and choroid segmentation for choroidal thickness assessment in optical coherence tomography.Int J Ophthalmol. 2024 Oct 18;17(10):1763-1771. doi: 10.18240/ijo.2024.10.01. eCollection 2024. Int J Ophthalmol. 2024. PMID: 39430032 Free PMC article.
References
-
- Abadia Beatriz, Suñen Ines, Calvo Pilar, Bartol Francisco, Verdes Guayente, Ferreras Antonio. Choroidal thickness measured using swept-source optical coherence tomography is reduced in patients with type 2 diabetes. PLOS ONE. 2018;13(2):e0191977. doi: 10.1371/journal.pone.0191977. - DOI - PMC - PubMed
Publication types
LinkOut - more resources
Full Text Sources
