. 2019 Feb 28;9(1):3022.
doi: 10.1038/s41598-019-39838-3.

Cold-priming of chloroplast ROS signalling is developmentally regulated and is locally controlled at the thylakoid membrane

Affiliations

Cold-priming of chloroplast ROS signalling is developmentally regulated and is locally controlled at the thylakoid membrane

Jörn van Buer et al. Sci Rep. .

Abstract

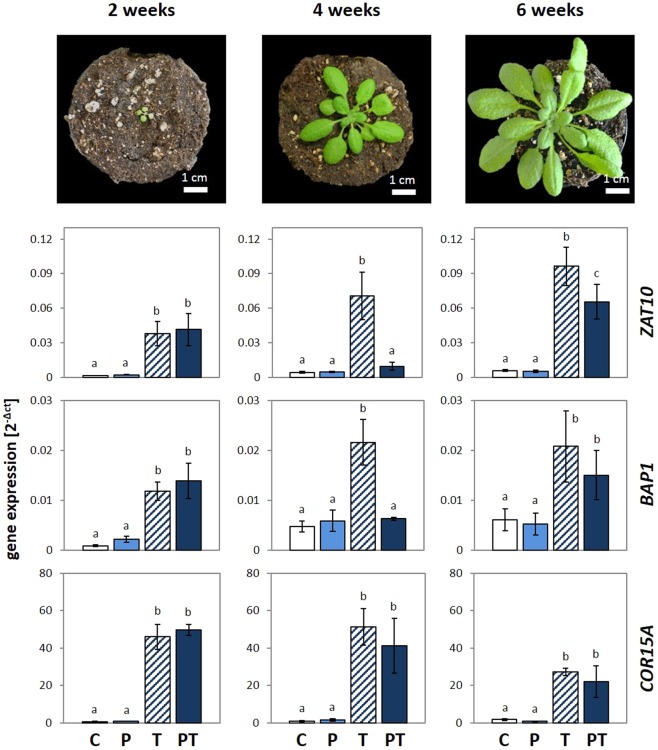
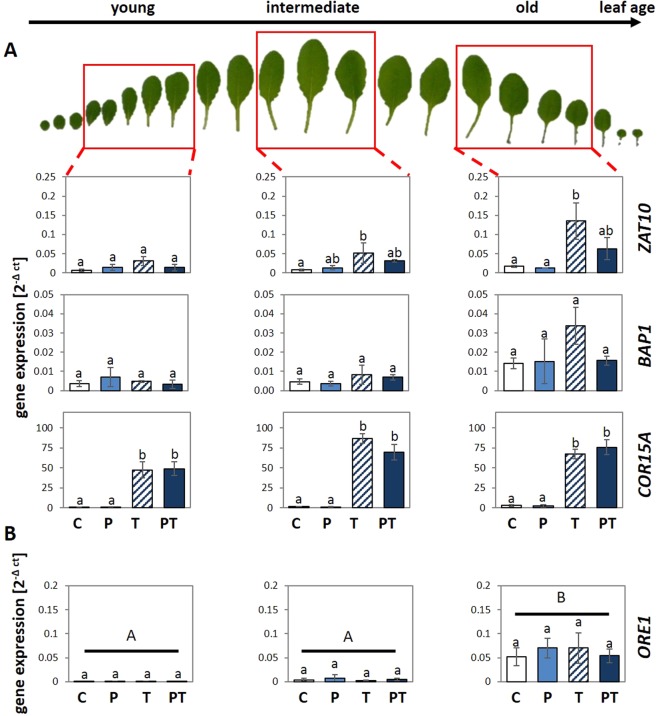
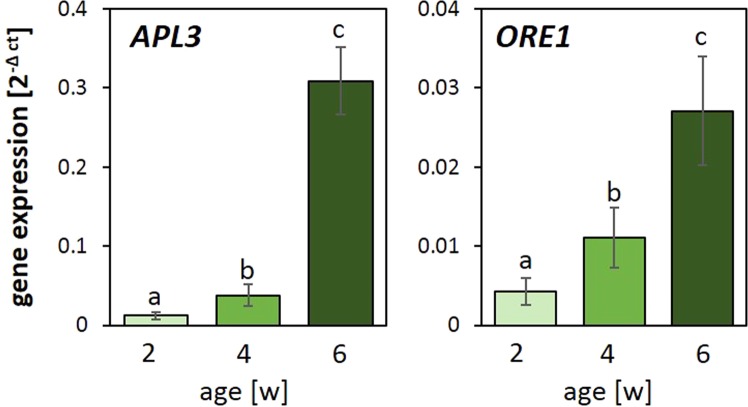
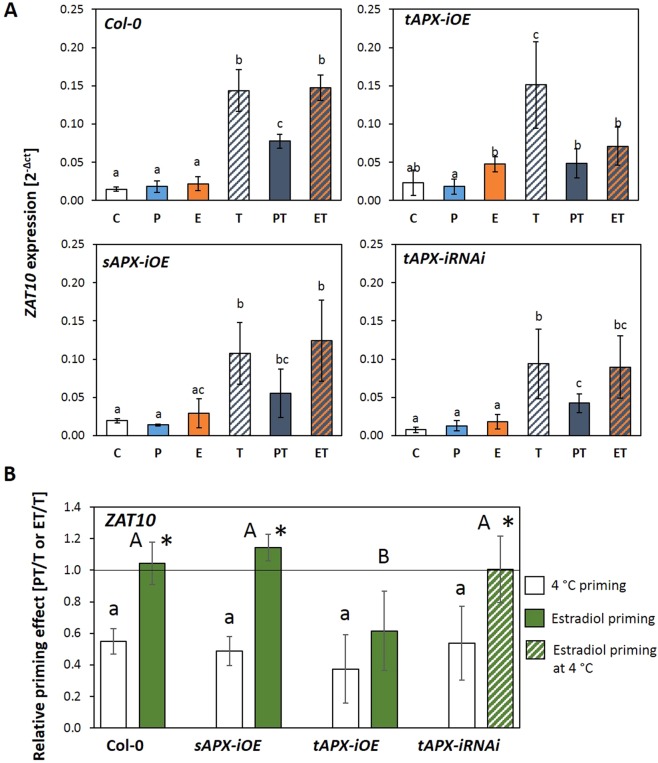
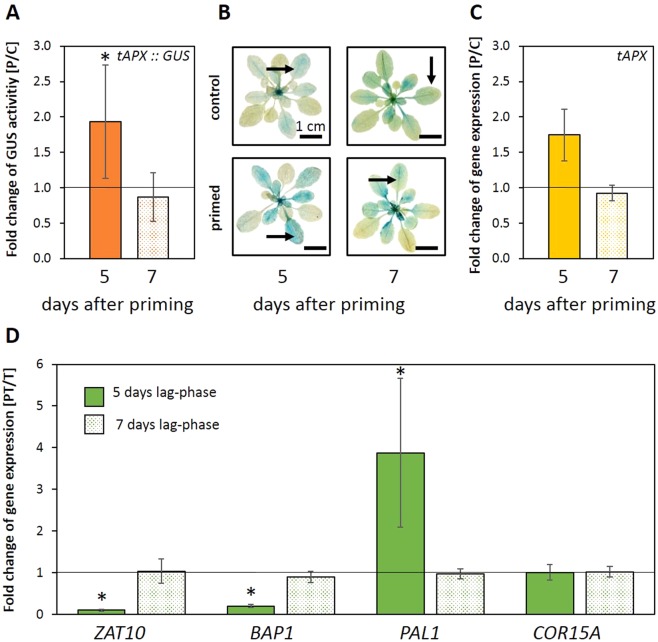
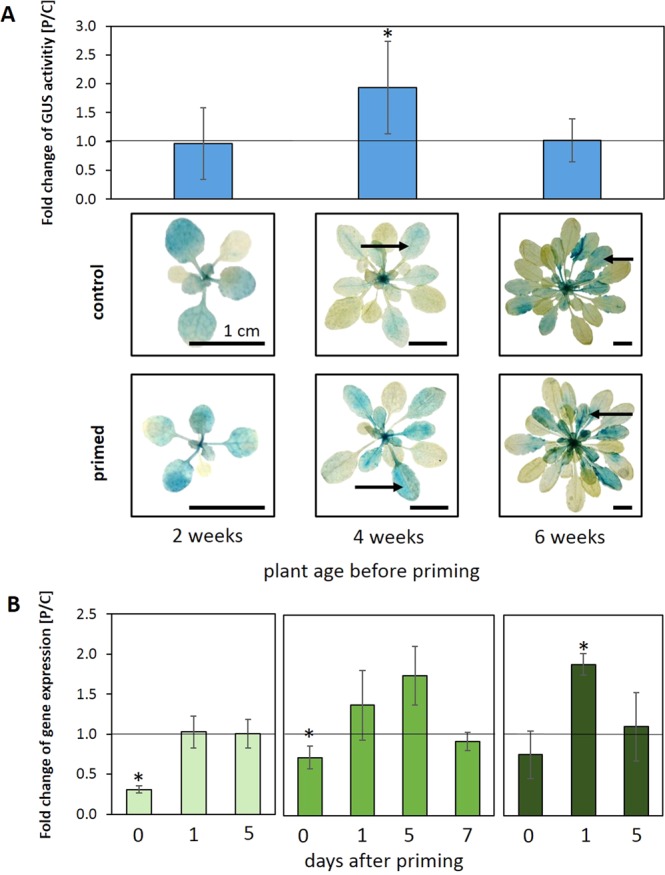
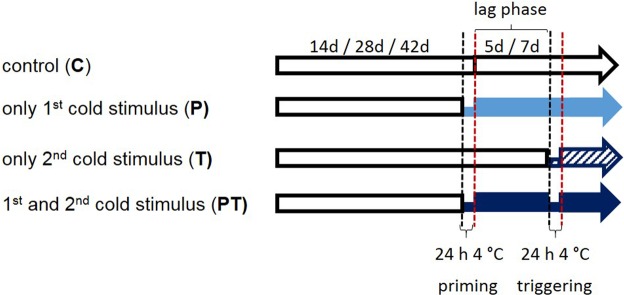
24 h exposure to 4 °C primes Arabidopsis thaliana in the pre-bolting rosette stage for several days against full cold activation of the ROS responsive genes ZAT10 and BAP1 and causes stronger cold-induction of pleiotropically stress-regulated genes. Transient over-expression of thylakoid ascorbate peroxidase (tAPX) at 20 °C mimicked and tAPX transcript silencing antagonized cold-priming of ZAT10 expression. The tAPX effect could not be replaced by over-expression of stromal ascorbate peroxidase (sAPX) demonstrating that priming is specific to regulation of tAPX availability and, consequently, regulated locally at the thylakoid membrane. Arabidopsis acquired cold primability in the early rosette stage between 2 and 4 weeks. During further rosette development, primability was widely maintained in the oldest leaves. Later formed and later maturing leaves were not primable demonstrating that priming is stronger regulated with plant age than with leaf age. In 4-week-old plants, which were strongest primable, the memory was fully erasable and lost seven days after priming. In summary, we conclude that cold-priming of chloroplast-to-nucleus ROS signalling by transient post-stress induction of tAPX transcription is a strategy to modify cell signalling for some time without affecting the alertness for activation of cold acclimation responses.


Conflict of interest statement

The authors declare no competing interests.

Figures

Figure 1
Figure 1
The effect of plant age on priming of ZAT10 and BAP1. Arabidopsis thaliana var. Col-0 were primed at an age of 2, 4 and 6 weeks by a 24 h cold-treatment at 4 °C. The 24 h 4 °C triggering stress was applied 5 days after priming. The transcript abundance for the primable ROS marker genes ZAT10 and BAP1 was evaluated directly after triggering in primed and triggered (PT), only primed (P), only triggered (T) and in control plants (C) and normalized to the geometric mean of the transcript levels of two constitutively expressed genes. As control for monitoring the cold-responsiveness, the transcript levels of the non-primable cold marker gene COR15A were determined. The letters refer to distinct significance groups as determined by ANOVA (Tukey’s test, p < 0.05, n = 3 ± SD).
Figure 2
Figure 2
Priming of leaves in different developmental stages of a 6-week-old rosette. Six week old plants were primed and triggered according to the experimental design (Fig. 7) and harvested after the triggering stimulus was applied. (A) The transcript abundance was measured for the primable ROS marker genes ZAT10 and BAP1 and normalized to the geometric mean of two constitutively expressed genes. Additionally the non-primable cold marker gene COR15A was analysed. (B) Transcript levels of the early senescence gene ORE1 were determined in the same samples as quantitative measure for the onset of senescence. An ANOVA (Tukey’s test, p < 0.05, n = 3 ± SD) was performed. The small letters refer to significance groups with leaf sets of the same age and different capital letters show significant differences between different age groups.
Figure 3
Figure 3
Normalized transcript abundance of APL3 and ORE1 in 2-, 4- and 6-week-old rosettes. The transcript abundance of the carbohydrate sensitive gene APL3 and senescence marker gene ORE1 were determined in 2-, 4- and 6-week-old rosettes and normalized to the transcript levels of two constitutively expressed genes. The letters refer to distinct significance groups as determined by ANOVA (Tukey’s test, p < 0.05, n = 3 ± SD).
Figure 4
Figure 4
The effect of cold or deregulation of plastidic ascorbate peroxidases on a subsequent cold trigger. (A) ZAT10 transcript levels in control plants (C), only cold-primed (P), only estradiol treated (E), only cold triggered (T) and cold-primed and cold-triggered (PT) and estradiol-treated and cold-triggered (ET) Col-0, sAPX-iOE, tAPX-iOE and tAPX-iRNAi plants of the same age. The tAPX-iRNAi ET plants were cold primed and sprayed with estradiol. The letters refer to distinct significance groups as determined by ANOVA (Tukey’s test, p < 0.05, n = 4 ± SD). (B) Priming effect. ZAT10 transcript abundance in cold (white) or by estradiol spraying (green) primed Col-0, sAPX-iOE and tAPX-iOE and tAPX-iRNAi lines after 24 h cold triggering (PT and ET, respectively) normalized on the transcript abundance in triggered only plants (T-plants). The tAPX-iRNAi plants were cold-primed and sprayed with estradiol (green-white striped). The crude data are identical to those in section A. for calculation of the means, standard deviations and the statistical analysis (one-sided t-Test p < 0.05; n = 4) the PT/T- and ET/T-ratios, respectively, were calculated independently for each biological replicate first. Different small letters show significance of difference in cold primability, different capital letters difference in the cold response after estradiol spraying. The asterisks label significantly different results between cold- and estradiol-priming.
Figure 5
Figure 5
The effect of a prolonged lag-phase of 7 days on primable genes and tAPX expression. (A) Quantification of GUS activity in 4-week-old rosettes 5 (orange bar) or 7 (dotted bar) days after priming, respectively. The graph depicts the specific activity in primed plants at the end of the lag-phase relative to the specific activity in control plants (n = 10; mean ± SD, * t-Test p < 0.05. (B) Representative GUS staining pattern of tAPXprom::GUS plants (n = 10) 5 or 7 days after cold-priming and in control plants. The arrows marks the leaf stage that was used for the quantification of GUS activity. (C) Comparison of the normalized tAPX transcript abundance 5 and 7 days after priming relative to the transcript levels in control plants (n = 3; mean ± SD, * one-sided t-Test p < 0.05). (D) Normalized transcript levels of ZAT10, BAP1, PAL1 and COR15A in PT-plants relative to T-plants at the time-point directly after the end of the triggering stimulus after a lag-phase length of either 5 days (green bar) or 7 days (dotted bar) (n = 3; mean ± SD, * one-sided t-Test p < 0.05).
Figure 6
Figure 6
tAPX regulation in response to the priming stimulus. (A) The GUS activity in 2-, 4- and 6-week-old rosettes of primed tAPXprom::GUS reporter gene plants 5 days after priming relative to the activity in untreated control plants of the same line (n = 10; mean ± SD, * t-Test p < 0.05). (B) GUS staining patterns of representative plants out of 10 individuals 5 days after priming (bottom) and un-treated controls (top) at different ages (2-, 4- and 6-week-old). The arrow indicates the developmental stage of leaves used for the GUS activity measurements. (B) tAPx transcript levels 0, 1 and 5 days (and 7 days additionally for 4-week-old plants) after priming relative to the levels of parallel cultivated untreated plants (n = 3; mean ± SD, * one-sided t-Test p < 0.05).
Figure 7
Figure 7
Outline of the priming experiments. Plants were either grown for 2, 4 or 6 weeks under control conditions, before half of the plants were cold-treated for 24 h at 4 °C (primed, P). Afterwards, the plants were transferred back to the standard growth conditions. Five or seven days later (lag-phase) half of the plants of each group was treated for 24 h at 4 °C (trigger, T). Twice cold-treated plants are referred to as “primed and triggered” (PT), once treated as “only primed” (only the earlier cold treatment) (P) or “only triggered” (only the later cold treatment) (T) and not cold-treated plants as controls (C).

References

    1. Gilmour SJ, Hajela RK, Thomashow MF. Cold-acclimation in Arabidopsis thaliana. Plant Physiology. 1988;87:745–750. - PMC - PubMed
    1. Guy CL, Niemi KJ, Brambl R. Altered gene-expression during cold-acclimation of spinach. Proceedings of the National Academy of Sciences of the United States of America. 1985;82:3673–3677. - PMC - PubMed
    1. Gray GR, Chauvin LP, Sarhan F, Huner NPA. Cold acclimation and freezing tolerance - A complex interaction of light and temperature. Plant Physiology. 1997;114:467–474. - PMC - PubMed
    1. Thomashow MF. Plant cold acclimation: Freezing tolerance genes and regulatory mechanisms. Annual Review of Plant Physiology and Plant Molecular Biology. 1999;50:571–599. - PubMed
    1. Huner NPA, et al. Photosynthesis, photoinhibition and low-temperature acclimation in cold tolerant plants. Photosynthesis Research. 1993;37:19–39. - PubMed

Publication types

MeSH terms

LinkOut - more resources