

A longitudinal multimodal in vivo molecular imaging study of the 3xTg-AD mouse model shows progressive early hippocampal and taurine loss
- PMID: 30816415
- PMCID: PMC6586150
- DOI: 10.1093/hmg/ddz045
A longitudinal multimodal in vivo molecular imaging study of the 3xTg-AD mouse model shows progressive early hippocampal and taurine loss
Abstract
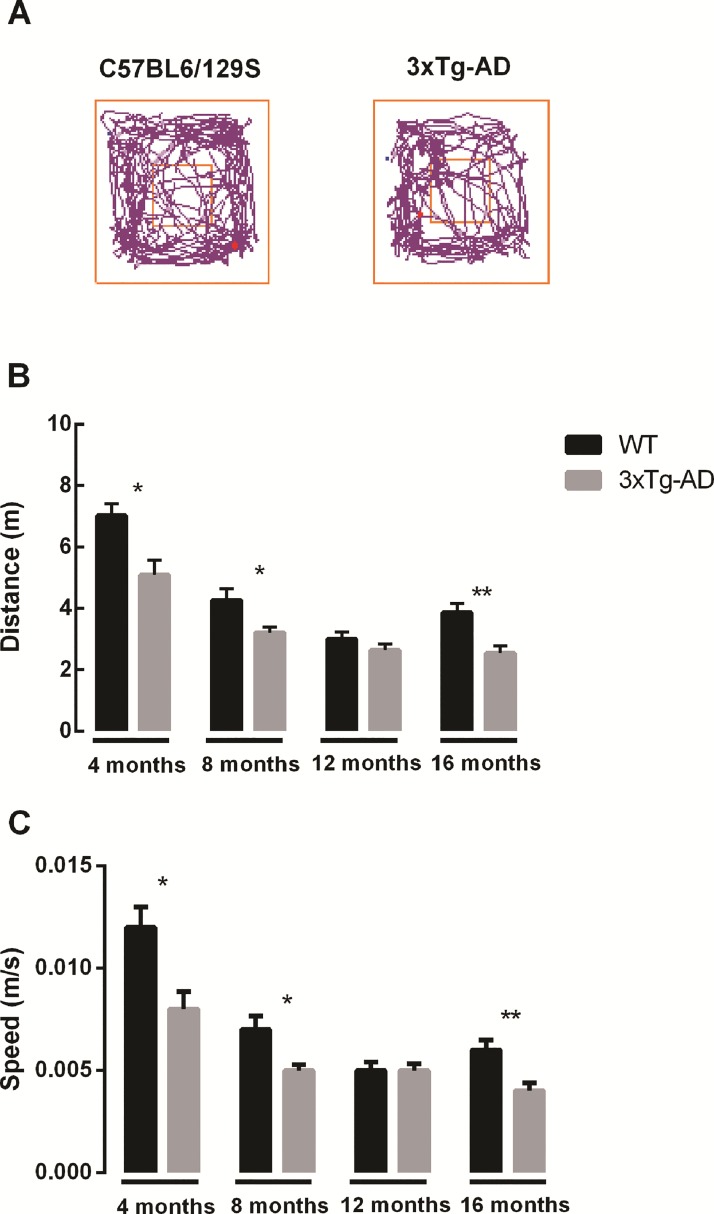
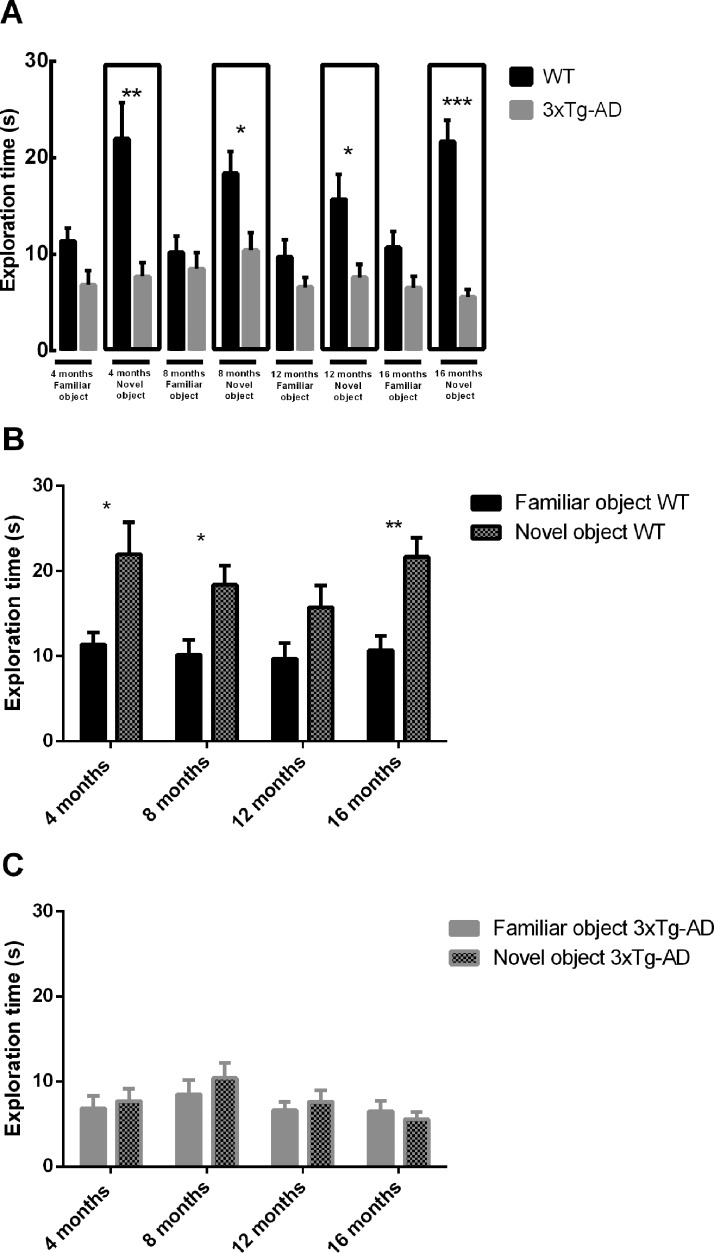
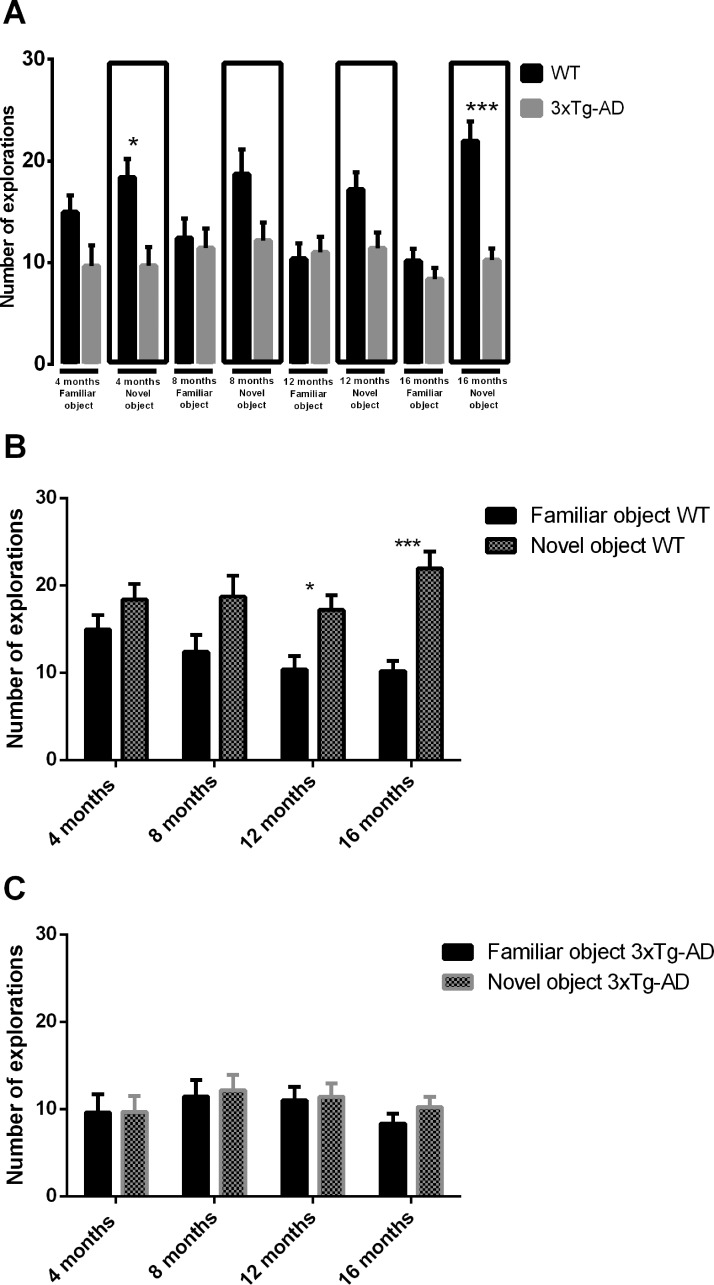
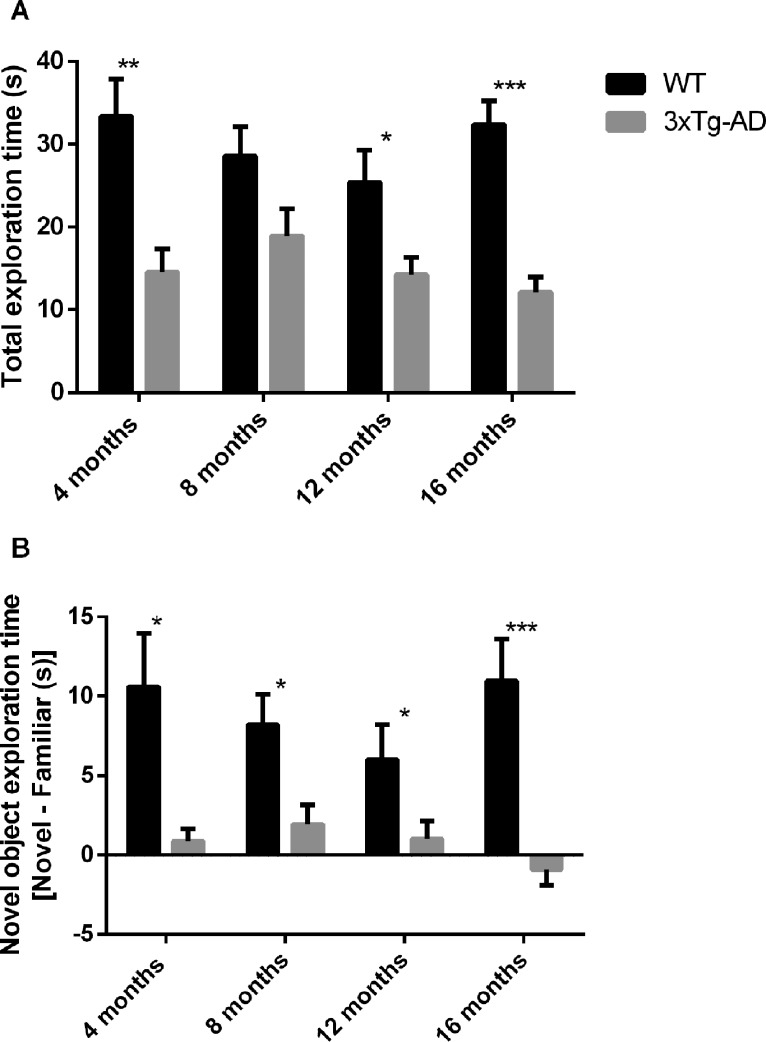
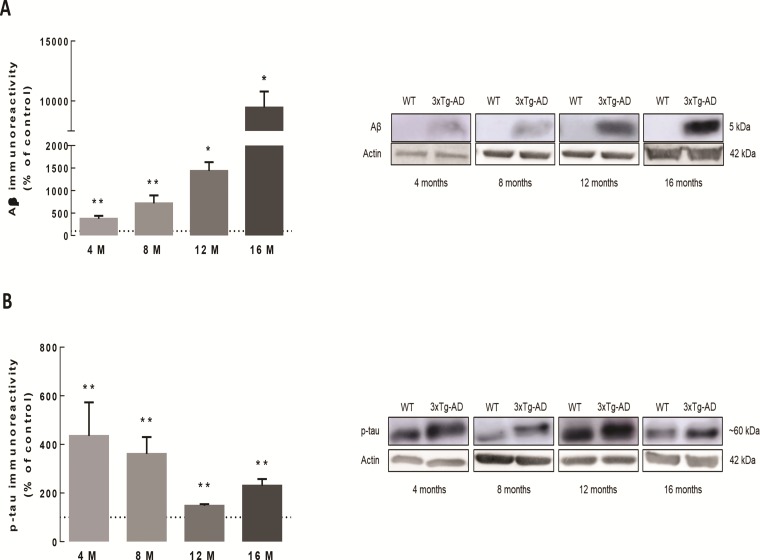
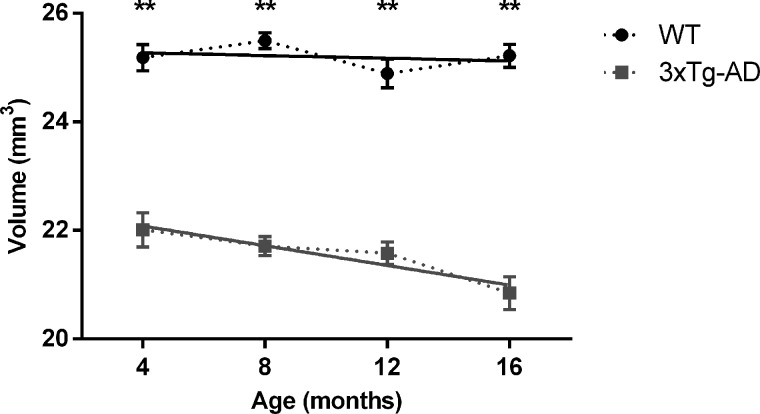
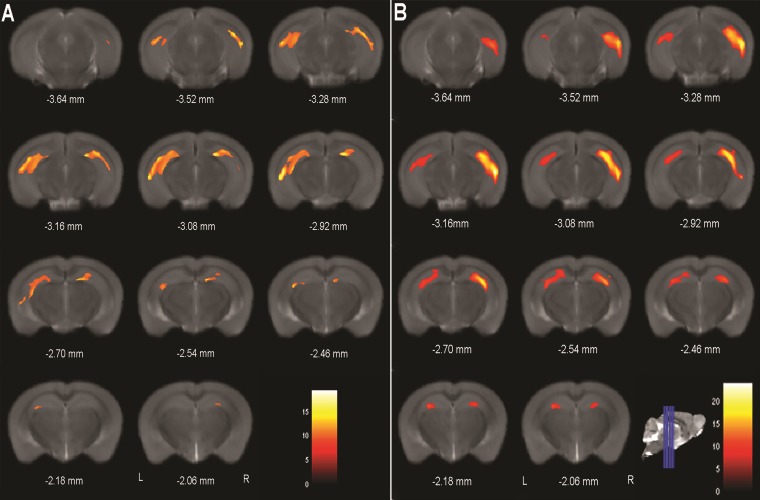
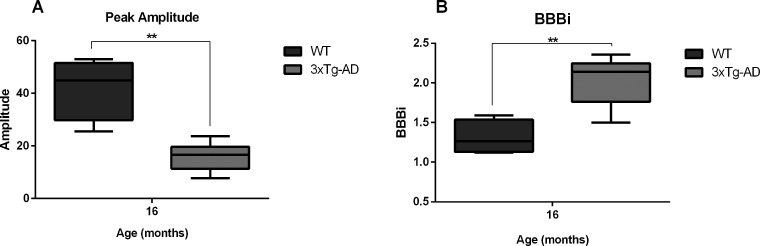
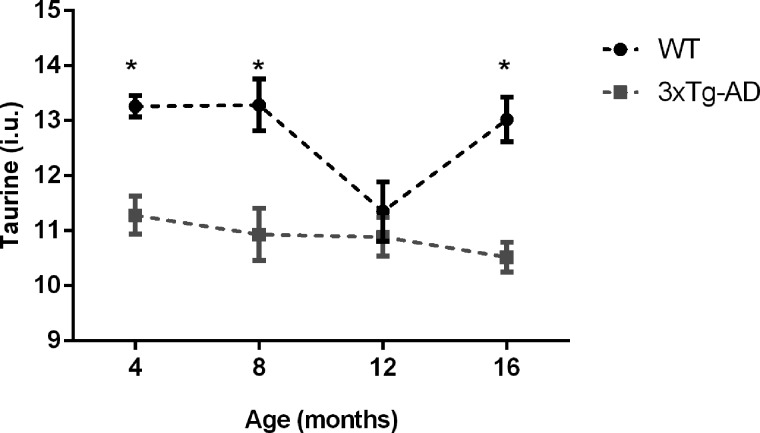
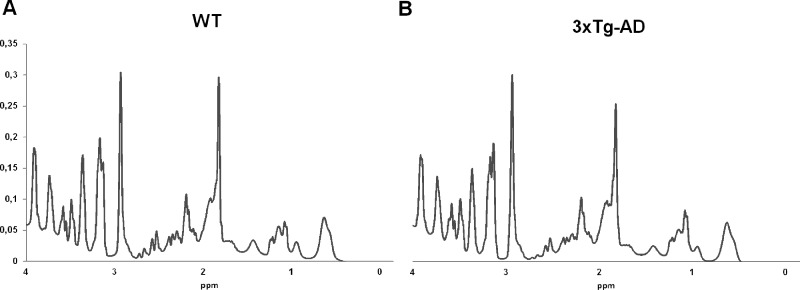
The understanding of the natural history of Alzheimer's disease (AD) and temporal trajectories of in vivo molecular mechanisms requires longitudinal approaches. A behavioral and multimodal imaging study was performed at 4/8/12 and 16 months of age in a triple transgenic mouse model of AD (3xTg-AD). Behavioral assessment included the open field and novel object recognition tests. Molecular characterization evaluated hippocampal levels of amyloid β (Aβ) and hyperphosphorylated tau. Magnetic resonance imaging (MRI) included assessment of hippocampal structural integrity, blood-brain barrier (BBB) permeability and neurospectroscopy to determine levels of the endogenous neuroprotector taurine. Longitudinal brain amyloid accumulation was assessed using 11C Pittsburgh compound B positron emission tomography (PET), and neuroinflammation/microglia activation was investigated using 11C-PK1195. We found altered locomotor activity at months 4/8 and 16 months and recognition memory impairment at all time points. Substantial early reduction of hippocampal volume started at month 4 and progressed over 8/12 and 16 months. Hippocampal taurine levels were significantly decreased in the hippocampus at months 4/8 and 16. No differences were found for amyloid and neuroinflammation with PET, and BBB was disrupted only at month 16. In summary, 3xTg-AD mice showed exploratory and recognition memory impairments, early hippocampal structural loss, increased Aβ and hyperphosphorylated tau and decreased levels of taurine. In sum, the 3xTg-AD animal model mimics pathological and neurobehavioral features of AD, with early-onset recognition memory loss and MRI-documented hippocampal damage. The early-onset profile suggests temporal windows and opportunities for therapeutic intervention, targeting endogenous neuroprotectors such as taurine.
© The Author(s) 2019. Published by Oxford University Press.
Figures
Similar articles
-
Ultrasound with microbubbles improves memory, ameliorates pathology and modulates hippocampal proteomic changes in a triple transgenic mouse model of Alzheimer's disease.Theranostics. 2020 Sep 26;10(25):11794-11819. doi: 10.7150/thno.44152. eCollection 2020. Theranostics. 2020. PMID: 33052247 Free PMC article.
-
Prodromal neuroinflammatory, cholinergic and metabolite dysfunction detected by PET and MRS in the TgF344-AD transgenic rat model of AD: a collaborative multi-modal study.Theranostics. 2021 May 3;11(14):6644-6667. doi: 10.7150/thno.56059. eCollection 2021. Theranostics. 2021. PMID: 34093845 Free PMC article.
-
Sex Differences in Neuropathology and Cognitive Behavior in APP/PS1/tau Triple-Transgenic Mouse Model of Alzheimer's Disease.Neurosci Bull. 2018 Oct;34(5):736-746. doi: 10.1007/s12264-018-0268-9. Epub 2018 Aug 11. Neurosci Bull. 2018. PMID: 30099679 Free PMC article.
-
Effects of CX3CR1 and Fractalkine Chemokines in Amyloid Beta Clearance and p-Tau Accumulation in Alzheimer's Disease (AD) Rodent Models: Is Fractalkine a Systemic Biomarker for AD?Curr Alzheimer Res. 2016;13(4):403-12. doi: 10.2174/1567205013666151116125714. Curr Alzheimer Res. 2016. PMID: 26567742 Review.
-
Recent Advances in Imaging of Preclinical, Sporadic, and Autosomal Dominant Alzheimer's Disease.Neurotherapeutics. 2021 Apr;18(2):709-727. doi: 10.1007/s13311-021-01026-5. Epub 2021 Mar 29. Neurotherapeutics. 2021. PMID: 33782864 Free PMC article. Review.
Cited by
-
Sex-specific alterations in NAD+ metabolism in 3xTg Alzheimer's disease mouse brain assessed by quantitative targeted LC-MS.J Neurochem. 2021 Oct;159(2):378-388. doi: 10.1111/jnc.15362. Epub 2021 Apr 28. J Neurochem. 2021. PMID: 33829502 Free PMC article.
-
Retina and Brain Display Early and Differential Molecular and Cellular Changes in the 3xTg-AD Mouse Model of Alzheimer's Disease.Mol Neurobiol. 2021 Jul;58(7):3043-3060. doi: 10.1007/s12035-021-02316-x. Epub 2021 Feb 19. Mol Neurobiol. 2021. PMID: 33606195
-
Navigating Alzheimer's Disease Mouse Models: Age-Related Pathology and Cognitive Deficits.Biomolecules. 2024 Nov 5;14(11):1405. doi: 10.3390/biom14111405. Biomolecules. 2024. PMID: 39595581 Free PMC article. Review.
-
Cognitive trajectories in longitudinally trained 3xTg-AD mice.Physiol Behav. 2024 Mar 1;275:114435. doi: 10.1016/j.physbeh.2023.114435. Epub 2023 Dec 14. Physiol Behav. 2024. PMID: 38103626 Free PMC article.
-
Transcriptomic Analyses of Neurotoxic Astrocytes Derived from Adult Triple Transgenic Alzheimer's Disease Mice.J Mol Neurosci. 2023 Aug;73(7-8):487-515. doi: 10.1007/s12031-023-02105-2. Epub 2023 Jun 15. J Mol Neurosci. 2023. PMID: 37318736
References
-
- Ballard C., Gauthier S., Corbett A., Brayne C., Aarsland D. and Jones E. (2011) Alzheimer’s disease. Lancet, 377, 1019–1031. - PubMed
-
- Christopher Janusa D.W. (2001) Transgenic mouse models of Alzheimer’ s disease. Physiol. Behav., 73, 873–886. - PubMed
-
- Wong P.C., Cai H., David R. and Borchelt D.L.P. (2002) Genetically engineered mouse models of neurodegenerative diseases. Nat. Neurosci., 5, 633–639. - PubMed
-
- Harper A. (2010) Mouse models of neurological disorders––a comparison of heritable and acquired traits. Biochim. Biophys. Acta––Mol. Basis Dis., 1802, 785–795. - PubMed
Publication types
MeSH terms
Substances
LinkOut - more resources
Full Text Sources
Medical
Molecular Biology Databases
