. 2019 May;22(5):778-786.
doi: 10.1111/ele.13235. Epub 2019 Feb 28.

Size-based ecological interactions drive food web responses to climate warming

Affiliations

Size-based ecological interactions drive food web responses to climate warming

Max Lindmark et al. Ecol Lett. 2019 May.

Abstract

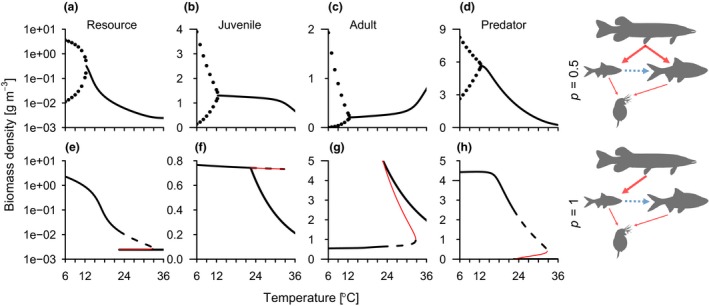
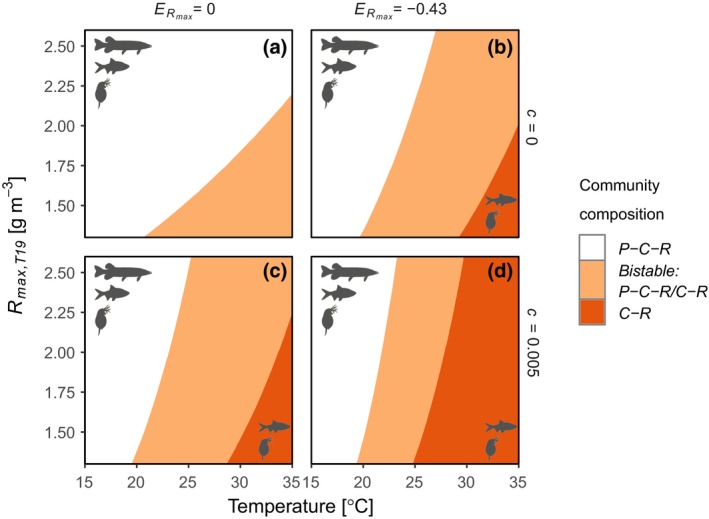
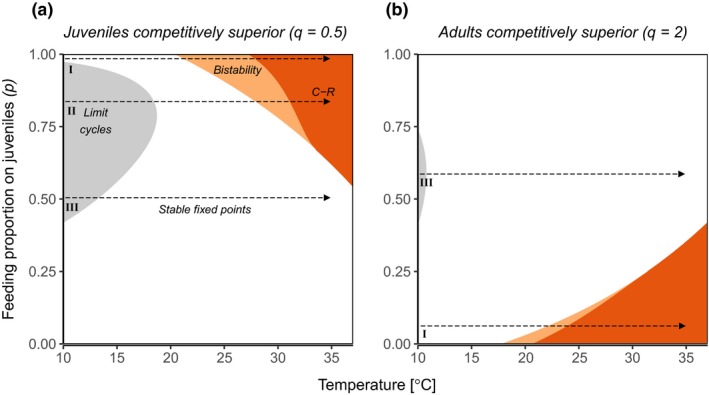
Predicting climate change impacts on animal communities requires knowledge of how physiological effects are mediated by ecological interactions. Food-dependent growth and within-species size variation depend on temperature and affect community dynamics through feedbacks between individual performance and population size structure. Still, we know little about how warming affects these feedbacks. Using a dynamic stage-structured biomass model with food-, size- and temperature-dependent life history processes, we analyse how temperature affects coexistence, stability and size structure in a tri-trophic food chain, and find that warming effects on community stability depend on ecological interactions. Predator biomass densities generally decline with warming - gradually or through collapses - depending on which consumer life stage predators feed on. Collapses occur when warming induces alternative stable states via Allee effects. This suggests that predator persistence in warmer climates may be lower than previously acknowledged and that effects of warming on food web stability largely depend on species interactions.

Keywords: Allee effects; alternative stable states; climate change; community dynamics; size structure; temperature-scaling; trophic interactions.


Figures

Figure 1
Figure 1
Effects of warming on food chain stability depend on ecological interactions. Equilibrium biomass densities of the resource (a and e), consumer life stages (b, c, f and g) and predator (d and h) as a function of temperature, given a predator feeding with equal intensity on both life stages (a–d) (p = 0.5) or exclusively on juveniles (e–h) (p = 1). Black lines (full and dashed) are stable equilibria and red thin lines are unstable equilibria (connecting the two stable branches in the bistable region), which separate the two stable equilibria when there are alternative stable states. Maximum and minimum biomass density of a stable limit cycle is shown with points (top row below c. 12 °C). Alternative stable states, where predators are either extinct or abundant, occur between c. 22 and 33 °C (e–h). Note the different scales on the y‐axes and the logarithmic y‐axis for resources densities. ERmax=0.43, all other parameters have default values (Appendix S1, Table S2).
Figure 2
Figure 2
Effects of temperature on community structure depend on temperature scaling of maximum resource density (R max,T19) and whether metabolism scales with body size and temperature independently (c = 0) or interactively (c ≠ 0) in the consumer (C) and predator (P). With warming, the tri‐trophic food‐chain changes from stable (white space), to exhibiting alternative stable states (orange space; with predators either present or absent), to being reduced to two trophic levels following predator extinction (dark orange space). The figure shows how the species composition and dynamics of the food‐chain change with temperature and R max,T19, given no (ERmax=0) (a and c) or negative (ERmax=0.43) (b and d) effects of temperature on R max,T19, with independent (a and b) or interactive (c and d) effects of body size and temperature on metabolism. The predator feeds exclusively on juveniles (p = 1), all other parameters have default values (Appendix S1, Table S2).
Figure 3
Figure 3
Shifts in structure and stability with increasing temperature depend on the predators’ feeding preference (p), current temperature and which life stage is competitively inferior and therefore limits growth of the consumer population. Shown here are results for the generic model parameterisation with added temperature dependence (Appendix S1, Table S7 and S8). Panel (a) is analogous to the empirical model used for Figs 1 and 2 (juveniles competitively superior) and in (b) adults are superior competitors. In grey regions all species in the food‐chain exhibit stable population cycles, white corresponds to stable tri‐trophic states, orange shows bistable regions where the food chain exhibits alternative stable states with predators being either extinct or abundant (here the lower temperature boundary of the region corresponds to the invasion boundary and the upper is the persistence boundary), and dark orange is the stable consumer‐resource system where predators cannot persist. Roman numerals correspond to three distinct regions of predator feeding preference (p) that lead to different stability‐temperature relationships with warming (indicated by arrows along the temperature axis): I) warming destabilises the food chain by inducing bistability (alternative stable states), II) warming initially stabilises the food chain by switching the state from limit cycles to fixed point dynamics but eventually induces bistability III) warming stabilises the food chain by replacing cyclic dynamics with fixed points. ERmax=0.43, all other parameters have default values (Appendix S1, Table S7 and S8).

Similar articles

Cited by

References

    1. Angilletta, M.J. & Dunham, A.E. (2003). The temperature‐size rule in ectotherms: simple evolutionary explanations may not be general. Am. Nat., 162, 332–342. - PubMed
    1. Atkinson, D. (1994). Temperature and organism size—A biological law for ectotherms? Adv. Ecol. Res., 25, 1–58.
    1. Bernhardt, J.R. , Sunday, J.M. & O'Connor, M.I. (2018). Metabolic theory and the temperature‐size rule explain the temperature dependence of population carrying capacity. Am. Nat., 192, 687–697. - PubMed
    1. Binzer, A. , Guill, C. , Brose, U. & Rall, B.C. (2012). The dynamics of food chains under climate change and nutrient enrichment. Philos. Trans. R. Soc. Lond. B Biol. Sci., 367, 2935–2944. - PMC - PubMed
    1. Björnsson, B. & Steinarsson, A. (2002). The food‐unlimited growth rate of Atlantic cod (Gadus morhua). Can. J. Fish Aquat. Sci., 59, 494–502.

LinkOut - more resources