

The use of a functional test battery as a non-invasive method of fatigue assessment
- PMID: 30817785
- PMCID: PMC6394954
- DOI: 10.1371/journal.pone.0212870
The use of a functional test battery as a non-invasive method of fatigue assessment
Abstract
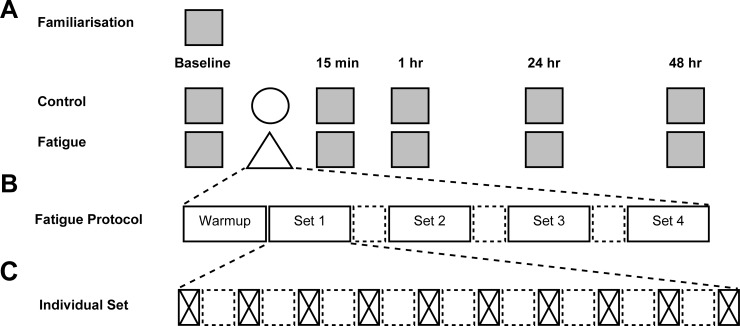
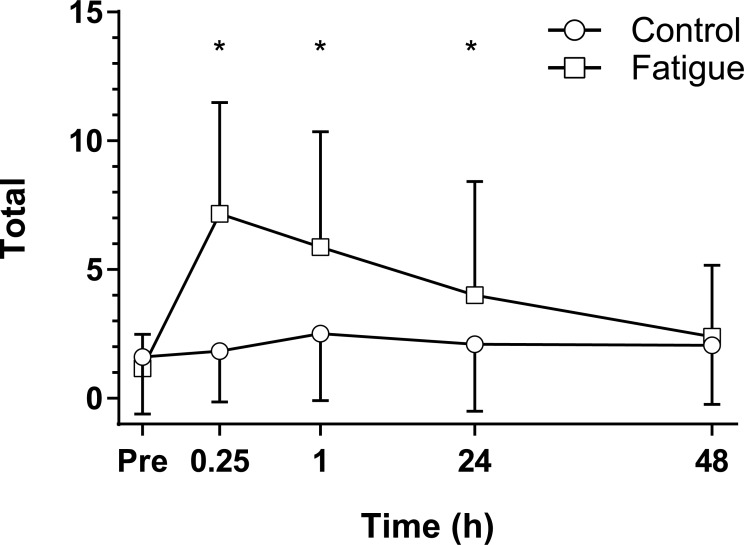
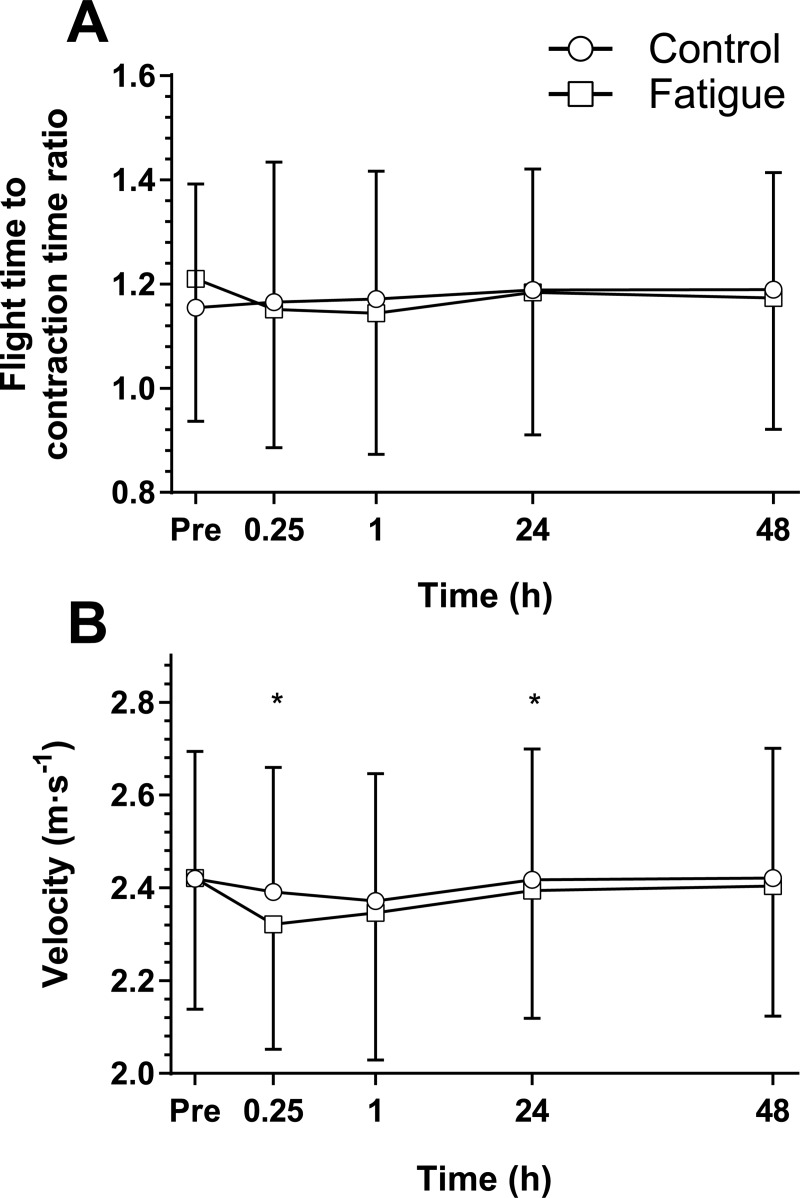
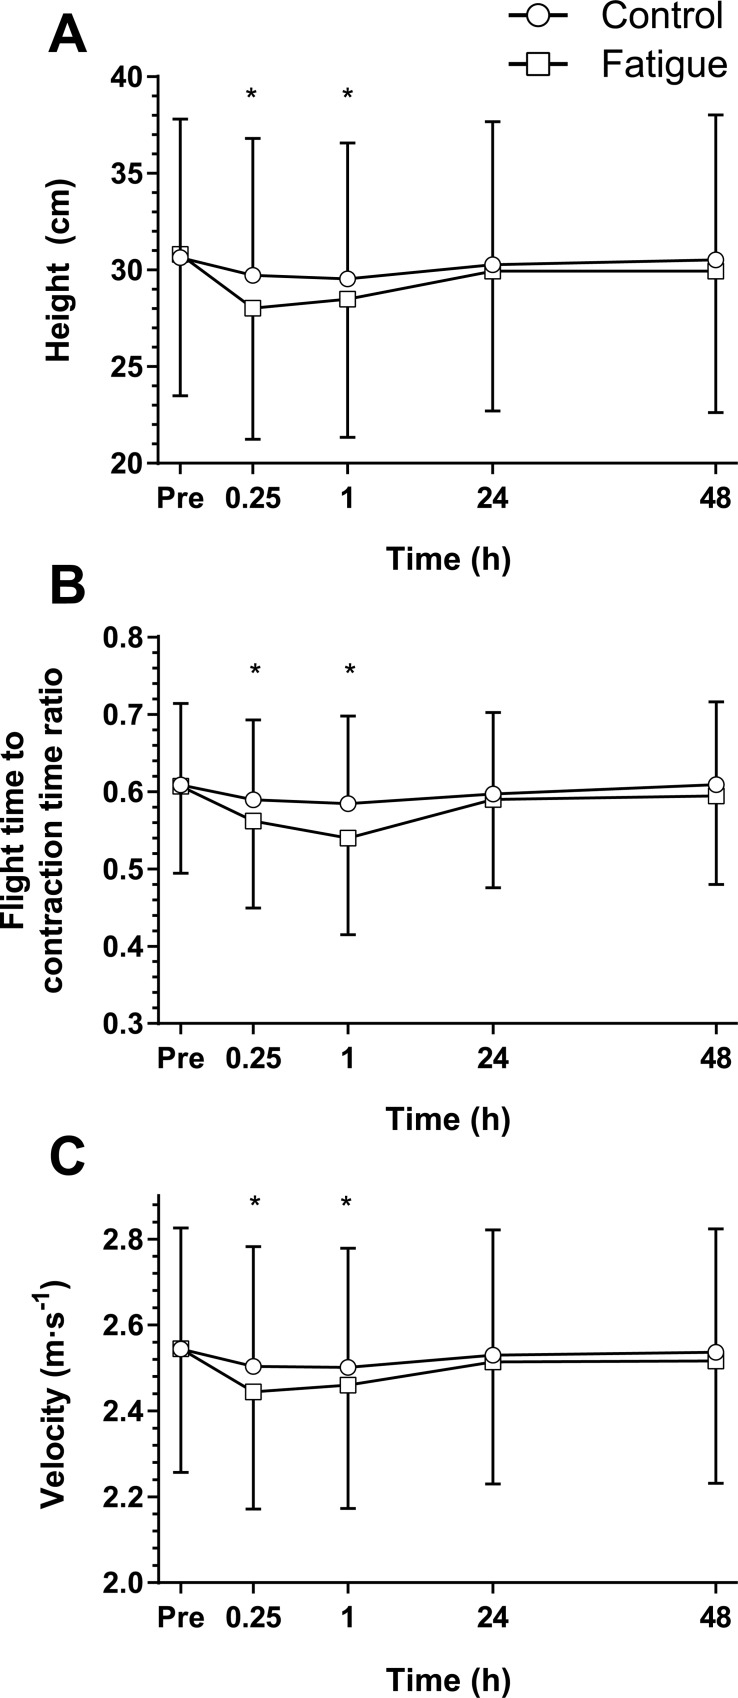
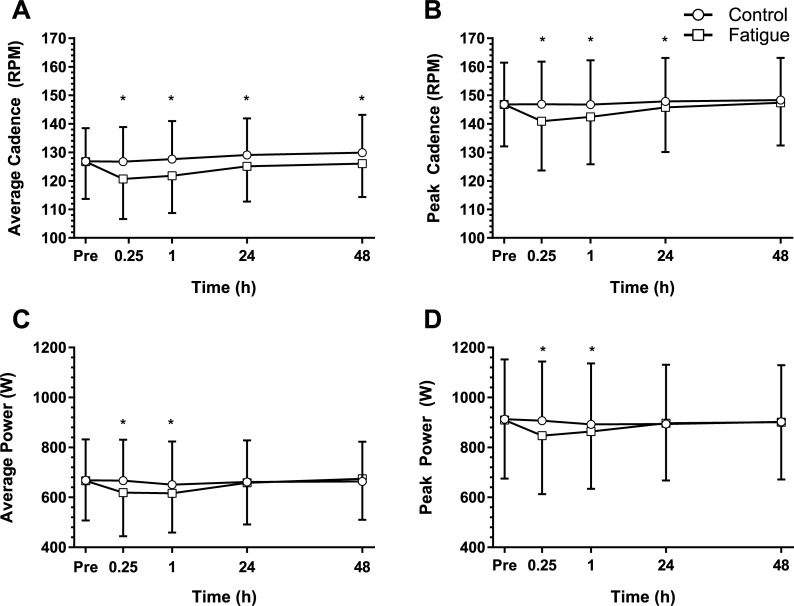
To assess whether a battery of performance markers, both individually and as group, would be sensitive to fatigue, a within group random cross-over design compared multiple variables during seated control and fatigue (repeated sprint cycling) conditions. Thirty-two physically active participants completed a neuromuscular fatigue questionnaire, Stroop task, postural sway, squat jump, countermovement jump, isometric mid-thigh pull and 10 s maximal sprint cycle (Sprintmax) before and after each condition (15 min, 1 h, 24 h and 48 h). In comparison to control, larger neuromuscular fatigue questionnaire total score decrements were observed 15 min (5.20 ± 4.6), 1 h (3.33 ± 3.9) and 24 h (1.83 ± 4.8) after cycling. Similarly, the fatigue condition elicited greater declines than control at 15 min and 1 h post in countermovement jump height (1.67 ± 1.90 cm and 1.04 ± 2.10 cm), flight time-contraction time ratio (0.03 ± 0.06 and 0.05 ± 0.11), and velocity (0.06 ± 0.07 m∙s-1 and 0.04 ± 0.08 m∙s-1). After fatigue, decrements were observed up to 48 h for average Sprintmax cadence (4-6 RPM), up to 24 h in peak Sprintmax cadence (2-5 RPM) and up to 1 h in average and peak Sprintmax power (45 ± 60 W and 58 ± 71 W). Modelling variables in a stepwise regression demonstrated that CMJ height explained 53.2% and 51.7% of 24 h and 48 h Sprintmax average power output. Based upon these data, the fatigue induced by repeated sprint cycling coincided with changes in the perception of fatigue and markers of performance during countermovement and squat jumps. Furthermore, multiple regression modelling revealed that a single variable (countermovement jump height) explained average power output.
Conflict of interest statement
The authors have declared that no competing interests exist.
Figures
Similar articles
-
Relationship between countermovement jump performance and multijoint isometric and dynamic tests of strength.J Strength Cond Res. 2008 May;22(3):699-707. doi: 10.1519/JSC.0b013e31816d5eda. J Strength Cond Res. 2008. PMID: 18438251
-
Predicting fatigue using countermovement jump force-time signatures: PCA can distinguish neuromuscular versus metabolic fatigue.PLoS One. 2019 Jul 10;14(7):e0219295. doi: 10.1371/journal.pone.0219295. eCollection 2019. PLoS One. 2019. PMID: 31291303 Free PMC article.
-
Effect of acute fatigue and training adaptation on countermovement jump performance in elite snowboard cross athletes.J Strength Cond Res. 2015 Jan;29(1):37-46. doi: 10.1519/JSC.0000000000000622. J Strength Cond Res. 2015. PMID: 25029001
-
Direct and indirect measurement of neuromuscular fatigue in Canadian football players.Appl Physiol Nutr Metab. 2015 May;40(5):464-73. doi: 10.1139/apnm-2014-0465. Epub 2015 Jan 16. Appl Physiol Nutr Metab. 2015. PMID: 25894521
-
Monitoring Neuromuscular Performance in Military Personnel.Int J Environ Res Public Health. 2020 Dec 7;17(23):9147. doi: 10.3390/ijerph17239147. Int J Environ Res Public Health. 2020. PMID: 33297554 Free PMC article. Review.
Cited by
-
Test Re-test Reliability of Single and Multijoint Strength Properties in Female Australian Footballers.Sports Med Open. 2021 Jan 9;7(1):5. doi: 10.1186/s40798-020-00292-5. Sports Med Open. 2021. PMID: 33420849 Free PMC article.
-
A Novel Physical Fatigue Assessment Method Utilizing Heart Rate Variability and Pulse Arrival Time towards Personalized Feedback with Wearable Sensors.Sensors (Basel). 2022 Feb 21;22(4):1680. doi: 10.3390/s22041680. Sensors (Basel). 2022. PMID: 35214582 Free PMC article.
-
Ability of Countermovement Jumps to Detect Bilateral Asymmetry in Hip and Knee Strength in Elite Youth Soccer Players.Sports (Basel). 2023 Mar 31;11(4):77. doi: 10.3390/sports11040077. Sports (Basel). 2023. PMID: 37104151 Free PMC article.
-
Assessment Methods of Sport-Induced Neuromuscular Fatigue: A Scoping Review.Int J Sports Phys Ther. 2025 Jul 2;20(7):943-956. doi: 10.26603/001c.141230. eCollection 2025. Int J Sports Phys Ther. 2025. PMID: 40620399 Free PMC article.
References
-
- Taylor K, Chapman D, Cronin J, Newton M, Gill N. Fatigue monitoring in high performance sport: a survey of current trends. JASC. 2012;20(1):12–23.
Publication types
MeSH terms
LinkOut - more resources
Full Text Sources
Medical
