Review
. 2020 Jan:133:104399.
doi: 10.1016/j.nbd.2019.02.010. Epub 2019 Feb 25.

A rat model of organophosphate-induced status epilepticus and the beneficial effects of EP2 receptor inhibition

Affiliations
Review

A rat model of organophosphate-induced status epilepticus and the beneficial effects of EP2 receptor inhibition

Asheebo Rojas et al. Neurobiol Dis. 2020 Jan.

Abstract

This review describes an adult rat model of status epilepticus (SE) induced by diisopropyl fluorophosphate (DFP), and the beneficial outcomes of transient inhibition of the prostaglandin-E2 receptor EP2 with a small molecule antagonist, delayed by 2-4 h after SE onset. Administration of six doses of the selective EP2 antagonist TG6-10-1 over a 2-3 day period accelerates functional recovery, attenuates hippocampal neurodegeneration, neuroinflammation, gliosis and blood-brain barrier leakage, and prevents long-term cognitive deficits without blocking SE itself or altering acute seizure characteristics. This work has provided important information regarding organophosphate-induced seizure related pathologies in adults and revealed the effectiveness of delayed EP2 inhibition to combat these pathologies.

Keywords: Acetylcholinesterase; Albumin; Cyclooxygenase-2; Diisopropyl fluorophosphate; EP2; Neurodegeneration; Neuroinflammation; Organophosphorus; Status epilepticus.


Conflict of interest statement

DISCLOSURE STATEMENT:

There are no conflicts of interest in relation to this work. We confirm that we have read the Journal's position on issues involved in ethical publication and affirm that this manuscript is consistent with the Journal's guidelines.

Figures

Figure 1.
Figure 1.. Cyclooxygenase and EP2 signaling cascades
A. Schematic of the COX-2 signaling cascade following initiation of status epilepticus induced by an organophosphorus based agent. Both COX-1 and COX-2 enzymes convert arachidonic acid to prostaglandin H2 (PGH2). Cell specific prostanoid syntheses convert PGH2 into the various prostaglandin ligands, which bind and activate specific G protein-coupled receptors. COX-2 also metabolizes endocannabinoids to prostaglandin analogs (glycerol esters and ethanolamides (not shown for simplicity). Four receptors, prostaglandin D2 receptor 1 (DP1), prostaglandin E2 receptor 2 (EP2), prostaglandin E2 receptor 4 (EP4) and prostacyclin receptor (IP), promote cyclic adenosine monophosphate (cAMP) production upon activation. Receptor activation resulting in cAMP production and Ca2+ mobilization in conjunction with other cellular responses like changes in gene expression lead to the various neuropathologies that develop as a result of OP-poisoning. ERK, extracellular signal-regulated kinase; p38, mitogen-activated protein kinase; cPLA2, calcium-dependent phospholipase A2. The boxed in receptors and signaling molecules in A indicates that prostanoid receptors may function in an autocrine manner by activating receptors expressed on the same cells that synthesize the prostanoids or in a paracrine manner by activating receptors on neighboring cells. B. Schematic of the EP2 signaling cascade following activation by PGE2. Adenylyl cyclase (AC) promoted cAMP production which activates protein kinase A (PKA) and/or exchange protein directly activated by cAMP (EPAC) signaling. RAP, Ras GTPase quinine nucleotide exchange factor; CREB, cAMP response element-binding protein; GSK, glycogen synthase kinase 3; ERK, extracellular signal–regulated kinase. C, chemical structures of organophosphorus (OP) based agents and EP2 receptor antagonist (PF-04418948, Pfizer; TG6-10-1, Emory University).
Figure 2.
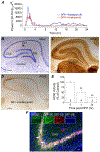
Figure 2.. Urethane but not diazepam suppresses the return of seizure activity.
All rats were administered pyridostigmine bromide (0.1 mg/kg in 0.9% saline, sc) at time zero and methylatropine bromide, methylatropine nitrate or ethylatropine bromide (20 mg/kg in 0.9% saline, sc) 20 minutes later followed by DFP in sterile water (5 mg/kg sc or 9.5 mg/kg ip) 10 minutes later to induce SE. Non-seizure control rats (“controls”) received the same supporting agents and DFP was replaced by sterile water. A, the EEG power in the 20-70 Hz bandwidth averaged over 300 sec epochs during the 24 hour period for 6 diazepam-treated and 6 urethane-treated rats. The dashed line indicates baseline power before DFP. Diazepam (10 mg/kg, ip) was administered 60 minutes after SE onset. A subset of rats were exposed for 5-7 minutes to isoflurane by inhalation followed by administration of a subanaesthetic does of urethane (0.8 g/kg, sc). B and C, are images of the hippocampus (25x total magnification) of a non-seizure control rat stained for Nissl (B) and AChE (C). The brain of a non-seizure control rat was rapidly removed and bisected longitudinally. One hemisphere was fixed in 4% paraformaldehyde overnight and transferred to 30% sucrose the next day until it sank. The brain was embedded in tissue freeze medium and sectioned coronally on a cryostat at 40 μm. Coronal sections were stained for Nissl and acetylcholinesterase activity using the protocol described by Paxinos et al. (1980). The dark purple indicates the presence of the Nissl bodies in B and the brown precipitate in C is indicative of areas of high activity of AChE. D, the brain of a rat that experienced uninterrupted SE induced by DFP 24 hours earlier was rapidly removed, bisected longitudinally, coronally sectioned and stained as described above. Shown is an image of the hippocampus (25x total magnification) of a section stained for AChE activity. The brown precipitate although present in some cells is much lower overall indicating reduced AChE activity. The scale bar in B, C and D = 500 μm. E, AChE inhibition in rat brain measured by an acetylcholinesterase assay (Rojas et al., 2015) is significantly reduced 1 h after DFP exposure and is prominent by 24 h after DFP-exposure. ** = p < .01, one-way ANOVA with posthoc Dunnett’s. The number inside the bar represent the number of rats in each group. F, immunohistochemistry was performed on rat coronal hippocampal sections for COX-2 and NeuN as described by Rojas et al. (2015). The NeuN antibody was diluted 1:2000 (MAB377, Millipore). Alexa Fluor594 goat anti-mouse was diluted 1:1000 (ThermoFisher Scientific). Fluorescent images taken from the CA3 region in the hippocampus (200x total magnification) reveals basal expression of neuronal COX-2 in rats that did not experience status epilepticus (No SE, left insert). Neuronal COX-2 in the CA3 region is greatly induced 24 hours after DFP-induced SE (DFP-SE, middle insert). Red fluorescent images of the CA3 region in the hippocampus reveals expression of the neuronal nuclei marker NeuN. Overlapping the green COX-2 stain, the red NeuN stain and the Hoechst revealed COX-2 induction in the same neurons positively stained for NeuN. Examples are indicated by the white arrows. The images shown are representative of five sections each from three or more rats. Scale bar, 30 μm.
Figure 3.
Figure 3.. Beneficial effects of TG6-10-1 after DFP-induced status epilepticus.
All rats were administered pyridostigmine bromide (0.1 mg/kg in 0.9% saline, sc) at time zero and methylatropine bromide (20 mg/kg in 0.9% saline, sc) 20 minutes later followed by DFP in sterile water (9.5 mg/kg ip) 10 minutes later to induce SE. Non-seizure control rats (“controls”) received the same supporting agents and DFP was replaced by sterile water. A, six injections of TG6-10-1 (n = 8 rats) beginning 80-150 min after SE onset significantly accelerated weight regain compared to vehicle (n = 8 rats) administration (p < .0001 by one-way ANOVA with posthoc Bonferroni). Rats administered DFP that did not enter status epilepticus (DFP No SE, n = 7) returned to the initial weight just prior to DFP exposure by day four. B, change in abundance of 10 inflammatory mediator mRNAs from the forebrain of rats 4 d after injection with water or DFP to induce status epilepticus. Post-DFP treatment was 6 doses of TG6-10-1 (n = 8 rats) or vehicle (n = 9 rats). Following DFP induced status epilepticus, the mRNA fold change for 8 mediators as a group was significantly reduced by TG6-10-1 compared to vehicle (p = .019, paired t test). C, the average number of injured neurons per section in three hippocampal regions of rats treated with 6 doses of vehicle (n = 6 rats) and rats injected with 6 doses of TG6-10-1 (n = 7 rats) four days after DFP-induced status epilepticus. (* p < .05 in CA1, one-way ANOVA with posthoc Bonferroni). D, induction of GFAP and Iba1 mRNA in the forebrain four days following DFP status epilepticus in vehicle treated (n = 7 rats) and TG6-10-1 treated rats (n = 7 rats) (one-way ANOVA with posthoc Bonferroni).
Figure 4.
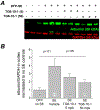
Figure 4.. EP2 receptor antagonist TG6-10-1 aids in maintaining the integrity of the blood-brain barrier after DFP-induced SE.
All rats were administered pyridostigmine bromide (0.1 mg/kg in 0.9% saline, sc) at time zero and methylatropine bromide (20 mg/kg in 0.9% saline, sc) 20 minutes later followed by DFP in sterile water (9.5 mg/kg ip) 10 minutes later to induce SE. Non-seizure control rats received the same supporting agents and DFP was replaced by sterile water. A, The amount of serum albumin in the cortex 4 days after SE was used to assess the integrity of the blood–brain barrier as all rats were perfused with sterile saline to completely remove blood from all tissues. The albumin levels (green) in the cortex of non-seizure controls or rats that experienced uninterrupted SE induced by DFP that received TG6-10-1 (5, 50 mg/kg, sc) or the vehicle (olive oil) at 4 and 24 hours after SE onset were measured by western blot with GAPDH (red) used as a loading control. B, the band intensity of the albumin was normalized to the housekeeping GAPDH. The bar represents the mean ± SEM. The number in the white box within the bar represents the total number of rats within each group. p < 0.05, p < 0.01, one-way ANOVA and post hoc Bonferroni test with selected pairs.
Figure 5.
Figure 5.. TG6-10-1 alters memory retention but not anxiety behavior following DFP-induced SE.
All rats were administered pyridostigmine bromide (0.1 mg/kg in 0.9% saline, sc) at time zero and methylatropine bromide (20 mg/kg in 0.9% saline, sc) 20 minutes later followed by DFP in sterile water (9.5 mg/kg ip) 10 minutes later to induce SE. Non-seizure control rats received the same supporting agents and DFP was replaced by sterile water. The time spent in the light compartment (A) and latency to enter the light compartment (B) are shown for the four groups of rats (sham treated controls, DFP-no-SE, DFP-SE followed by vehicle, DFP-SE followed by TG6-10-1). The bars show the mean of the group and the number in the white box within the bar represent the total number of rats in each group. The error bars represent the standard error of the mean. The “+/−” symbol next to TG6-10-1 denotes sham treated control rats and DFP-no-SE rats that received TG6-10-1 (n=6) or vehicle (n=6). These rats were combined into one group as they were not different in any measure. ns = p > .05 by One-way ANOVA with Bonferroni posthoc. C, time spent in the center of the box during habituation in the NOR task is shown for the three groups tested. p < .01, One-way ANOVA, Dunnett’s posthoc. D, a discrimination index was used as a measure of memory retention. The individual groups were compared to zero by a 1-sample t test. The number in the white box within the bar represents the total number of rats in each group. The “+/−” symbol next to TG6-10-1 denotes sham treated control rats that received TG6-10-1 (n=6) or vehicle (n=6). These rats were combined into one group as they were not different in any measure. The horizontal dashed line at 0 indicates the point at which there is no discrimination between the novel and familiar objects. ns = p > .05. E, cortical EEG activity was recorded 4-6 weeks after SE induction by exposure to DFP. Shown are heat maps with the number of seizures detected per day from each rat (rows). A difference was detected between the two treatment groups [diazepam (n = 10) and urethane (n = 11)] in the percentage of rats that experienced at least one spontaneous recurrent seizure during the 6-12 days of EEG recording.

References

    1. Andreasson K (2010). Emerging roles of PGE2 receptors in models of neurological disease. Prostaglandins Other Lipid Mediat, 91(3-4), 104–112. doi:10.1016/j.prostaglandins.2009.04.003 - DOI - PMC - PubMed
    1. Angoa-Perez M, Kreipke CW, Thomas DM, Van Shura KE, Lyman M, McDonough JH, & Kuhn DM (2010). Soman increases neuronal COX-2 levels: possible link between seizures and protracted neuronal damage. Neurotoxicology, 31(6), 738–746. doi:10.1016/j.neuro.2010.06.007 - DOI - PMC - PubMed
    1. Apland JP, Aroniadou-Anderjaska V, Figueiredo TH, Rossetti F, Miller SL, & Braga MF (2014). The limitations of diazepam as a treatment for nerve agent-induced seizures and neuropathology in rats: comparison with UBP302. J Pharmacol Exp Ther, 351(2), 359–372. doi:10.1124/jpet.114.217299 - DOI - PMC - PubMed
    1. Bankstahl M, Breuer H, Leiter I, Markel M, Bascunana P, Michalski D, Bengel FM, Loscher W, Meier M, Bankstahl JP, & Hartig W (2018). Blood-Brain Barrier Leakage during Early Epileptogenesis Is Associated with Rapid Remodeling of the Neurovascular Unit. eNeuro, 5(3). doi:10.1523/ENEURO.0123-18.2018 - DOI - PMC - PubMed
    1. Bauer B, Hartz AM, Pekcec A, Toellner K, Miller DS, & Potschka H (2008). Seizure-induced up-regulation of P-glycoprotein at the blood-brain barrier through glutamate and cyclooxygenase-2 signaling. Mol Pharmacol, 73(5), 1444–1453. doi:10.1124/mol.107.041210 - DOI - PubMed

Publication types

MeSH terms