. 2019 Feb 28;15(2):e1007589.
doi: 10.1371/journal.ppat.1007589. eCollection 2019 Feb.

Sensing of cell-associated HTLV by plasmacytoid dendritic cells is regulated by dense β-galactoside glycosylation

Affiliations

Sensing of cell-associated HTLV by plasmacytoid dendritic cells is regulated by dense β-galactoside glycosylation

Sonia Assil et al. PLoS Pathog. .

Abstract

Human T Lymphotropic virus (HTLV) infection can persist in individuals resulting, at least in part, from viral escape of the innate immunity, including inhibition of type I interferon response in infected T-cells. Plasmacytoid dendritic cells (pDCs) are known to bypass viral escape by their robust type I interferon production. Here, we demonstrated that pDCs produce type I interferons upon physical cell contact with HTLV-infected cells, yet pDC activation inversely correlates with the ability of the HTLV-producing cells to transmit infection. We show that pDCs sense surface associated-HTLV present with glycan-rich structure referred to as biofilm-like structure, which thus represents a newly described viral structure triggering the antiviral response by pDCs. Consistently, heparan sulfate proteoglycans and especially the cell surface pattern of terminal β-galactoside glycosylation, modulate the transmission of the immunostimulatory RNA to pDCs. Altogether, our results uncover a function of virus-containing cell surface-associated glycosylated structures in the activation of innate immunity.


Conflict of interest statement

The authors have declared that no competing interests exist.

Figures
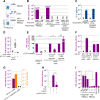
Fig 1
Fig 1. HTLV-1 infected cells robustly trigger IFN-I response by pDCs in a TLR7- and cell-cell contact dependent manner.
A. Representative FACS analysis of pDC isolation and depletion from PBMCs using the CD123 and BDCA-2 pDC selective markers. B. Representative quantification of IFN-I activity in the supernatants of PBMCs, isolated pDCs and pDC-depleted PBMCs (responders) co-cultured with HTLV-1 infected cells (HTLV-1; C91-PL cells) or uninfected cells (cont cells, Jurkat cells), or their supernatants (SN) as indicated (inducers). The results are expressed as unit (U)/mL (one unit corresponding to 10–20 pg of recombinant IFN-α 2A). Results are representative of 3 independent experiments (means of experimental triplicates ± standard deviation; SD). Arrows indicate results below the threshold detection of the assay (i.e. 2.5 U/mL). C. Quantification of IL6 in the supernatants (SN) of PBMCs, pDC-depleted PBMCs treated or not with LPS, as indicated (responders). Arrows indicate results below the threshold detection of the assay (i.e., 4 pg/mL). D. Quantification of IFN-I activity (as in B) secreted by pDCs (2x10⁴) isolated from the blood of a cohort of healthy donors (n = 27) co-cultured with HTLV-1 infected cells (C91-PL, 2x10⁴) or uninfected (cont) cells (Jurkat, 2x10⁴), or secreted by HTLV-1 infected cells (C91-PL, n = 4) in absence of pDCs. Graph shows minimum, maximum and median values as well as q1-q3 quartiles. E. Quantification of IFN-I activity in the SNs of pDCs that were pre-incubated, or not, with TLR7 inhibitor (IRS661; 0.35 μM), as indicated, then co-cultured with infected cells (HTLV-1 cells; C91-PL) or with control cells (cont.; Jurkat cells) and stimulated by agonist of TLR7 (R848; 50 ng/mL) or of TLR9 (ODN2216; 0.1 μM). Results are expressed relative to IFN-I activity determined in the absence of TLR7 inhibitor, set at 100 (means ± SD; n = 3). Asterisks indicate statistically significant differences calculated using unpaired t-test: *** p< 0.001; **** p< 0.0001; ns: non significant. F. Quantification of IFN-I activity in the SNs of pDCs co-cultured with HTLV-1 infected cells either seeded together (CO) or separated by a 0.4 μm transwell membrane (TW). As controls, pDCs were treated with TLR7 agonist (as in E) in the same set-up. Results are representative of 4 independent experiments in triplicate (means ± SD). G. Paralleled quantification of IFN-I activity produced by pDCs (left axis) upon co-culture with HTLV-1-infected cells (C91-PL) versus C8166 HTLV-1-infected (labeled as defective cells) and the infectivity transmission levels to naïve Jurkat-LTR-Luc cells upon co-culture with the same cells (right axis). RLU, relative light unit (mean ± SD, 2 independent experiments). H. Quantification of IFN-I activity in the SNs of pDCs co-cultured with Jurkat cells transfected prior to coculture either with pACH WT molecular clone or with a clone lacking the envelope glycoprotein (pACH ΔEnv), along with Tax-expressing plasmid to increase viral expression (mean ± SD; 3 independent experiments). Asterisks indicate statistically significant differences calculated using unpaired t-test: ** p< 0.01. I. Quantification of IFN-I activity in the SNs of pDCs co-cultured either with PBMCs obtained from 3 independent HAM/TSP patients, or with PBMCs from 3 independent healthy donors. HTLV-1 infected cells (C91-PL) or uninfected cells (Jurkat) were used as controls. Results represent one experiment performed in triplicates. Asterisks indicate statistically significant differences calculated using unpaired t-test: * p< 0.05.
Fig 2
Fig 2. The HTLV-1 receptor Glut-1 is involved in pDC IFN-I production triggered by the sensing of HTLV-1 infected cells, but not Neuropilin-1/BDCA-4.
A. Assessment by FACS of the surface expression of the HTLV-1 receptors Glut-1 (revealed with Glut-1.RBD.GFP and controlled with unstained cells), NRP-1/BDCA-4 (revealed with mAb and controlled with IgG isotype) and HSPG (revealed with mAb and controlled with IgG isotype). (representative of 3 independent experiments). B-D. Impact of Glut-1 binding competitor (RBD, 5 μl/105 cells) or NRP-1/BDCA-4 binding competitor (VEGF165, 100 ng/mL) on IFN-I activity in SNs of pDCs co-cultured with HTLV-1-infected cells (C91-PL) (mean ± SD; 5 independent experiments) (B), viral binding was determined by flow cytometry after Env gp46 detection on pDCs surface (mean ± SD, 3 independent experiments) (C), and infectivity transmission levels (mean ± SD; 3 independent experiments) (D), determined as in Fig 1. The results in (C) and (D) are expressed as percentages relative to untreated co-cultures. Asterisks indicate statistically significant differences calculated using ANOVA followed by Sidak’s multiple comparison test: * p> 0.05, **** p< 0.0001; ns: non significant. E. Viral binding as determined by flow cytometry after p19gag detection on Jurkat target cells upon exposure to HTLV-1 cell-free viruses or upon co-culture with HTLV-1 infected cells in the presence or not of NRP-1/BDCA-4 binding competitor (VEGF165, 80 ng/mL). Jurkat cells were differentiated from HTLV-1 infected cells based on their size (see S2C Fig). The results are expressed as percentage relative to untreated conditions (mean ± SD; 2–3 independent experiments). Asterisks indicate statistically significant differences calculated using ANOVA followed by Sidak’s multiple comparison test: *** p<0.001; ns = non significant.
Fig 3
Fig 3. HTLV biofilm-like structures trigger a robust activation of pDC-IFN-I response.
A. Representative confocal imaging of pDC/HTLV-1 infected cell contact with 3 consecutive Z-stack sections (left to right, all immunodetections were performed without permeabilization). Upper panels, confocal analysis of HTLV-1 Env gp46 (green) that form cluster at the contact between HTLV-1 infected cells and pDCs (stained with DiI, a lipophilic dye, red). Carbohydrate-rich structures are stained by the WGA lectin (Triticum vulgaris, purple), and nuclei are stained with Hoescht (blue). Middle and lower panels, single detections of WGA lectin and HTLV-1 Env gp46, respectively. B. Quantification of the presence or not of Env gp46 and WGA co-clusters at the cell-cell contact (analysis of 16 cell-cell contacts in 3 independent experiments). C-D. Parallel quantification of IFN-I activity in SNs of pDCs co-cultured with HTLV-1-infected cells (C91-PL) versus biofilm-like structures isolated from HTLV-1-infected cells (C91-PL) and infectivity transmission levels, determined as in Figs 1G and 2D (mean ± SD; 3 independent experiments performed with similar viral capsid levels in the isolated HTLV-1 biofilm-like structure as determined by p19gag levels, i.e. 2.9 ng). Asterisks indicate statistically significant differences calculated using ANOVA followed by Sidak’s multiple comparison test: **** p<0.0001. E. Surface Env gp46 detection on HTLV-1 infected cells (C91-PL) treated or not with metalloproteinase 9 (MMP-9; 20 nM). F-G. Parallel quantifications of IFN-I activity in SNs of pDCs co-cultured with HTLV-1-infected cells (C91-PL) treated or not with MMP-9 as in C, and infectivity transmission levels to Jurkat reporter cells co-cultured with HTLV-1-infected cells (C91-PL) treated or not with MMP-9 determined as in Fig 2D. The results are representative of 3 independent experiments.
Fig 4
Fig 4. Heparin, increases pDC/infected cell contacts and pDC activation by both HTLV-infected cells and isolated HTLV biofilm-like structures.
A. Quantification of the conjugates between CD123-stained pDCs and GFP-expressing HTLV-1 infected cells analyzed by imaging flow cytometry in co-cultures treated or not with heparin (50 U/ml). Results are expressed as percentages of pDC/HTLV-1 cell conjugates i.e., conjugates of, at least, one cell solely CD123+ and one cell GFP+, relative to the total number of single cells (GFP+ or CD123+) and the conjugates (mean ± SD; 3 independent experiments; n = 8000 events per condition). Asterisks indicate statistically significant differences calculated using ANOVA followed by Sidak’s multiple comparison test: ** p<0.01. B. Quantification of the effect of heparin treatment (50 U/mL) on IFN-I activity in SNs of pDCs co-cultured with HTLV-1-infected cells or HTLV-1-purified biofilm-like structures i.e., 2.9 ng as determined by p19gag ELISA (mean of triplicates results; representative of 3 independent experiments). C. Quantification of infectivity transmission levels to naïve Jurkat-LTR-Luc cells in presence or not of heparin upon co-culture with the HTLV-1-infected cells or isolated HTLV-1 biofilm-like structures (mean ± SD; 3 independent experiments with similar viral capsid levels in the isolated HTLV-1 biofilm-like structure as determined by p19gag levels). NS indicates statistically non-significant differences calculated using ANOVA followed by Sidak’s multiple comparison test.
Fig 5
Fig 5. Levels of pDC IFN-I production triggered by HTLV infected cells inversely correlate to the efficiency of infectious viral transmission via cell-cell contact.
A. IFN-I activity levels were quantified after co-culture of increasing number (2x10³; 2x10⁴; 2x10⁵) of HTLV-1 (C91-PL; Hut102; MT-2) or HTLV-2 infected cells (C19; MO) with pDCs (2x10⁴). The infected cells:pDC ratio is indicated on the right of the graph. Arrows indicate the maximum level of IFN-I activity for each cell line setting (mean of 3 independent experiments). B-G. Parallel representation of the maximum levels of IFN-I activity induced after co-culture of pDCs with HTLV-infected cells and of (B) intracellular viral RNA present in the cytoplasm of HTLV-infected cell lines (mean ± SD; 3 independent experiments); (C) viral RNA released in the supernatant of HTLV-infected cell lines after 24h of culture (mean ± SD; 3 independent experiments); (D) the percentage of cell contacts established between pDCs and HTLV-infected cells (mean ± SD; 2–4 independent experiments); (E) percentage of viral capture after 4h of co-culture with HTLV-1/2 infected cells as determined by p19gag detection in pDCs (mean ± SD; 3 independent experiments); (F) percentage of TRAIL expression after 24h of co-culture detected on the pDCs surface (mean ± SD; 3 independent experiments) or (G) maximum infectivity levels as determined in S5D Fig (n = 3). H. Correlation curve of pDC-dependent IFN-I production and viral transmission and calculated p value.
Fig 6
Fig 6. The differential surface glycan composition of HTLV-infected cells regulates the levels of pDC IFN-I production A.
Parallel representation of the maximum levels of IFN-I production induced after co-culture of pDCs with HTLV-1-infected cells and the amount of surface PNA binding on HTLV-2 (C19 and MO) infected cell lines and HTLV-1 (C91-PL; Hut102 and MT-2) infected cell lines (mean ± SD; 5 independent experiments). B-C. Regression correlation curve of the amount of PNA binding at the surface of HTLV-infected cells and the maximum IFN-I production induced by the HTLV-infected cells (B) or the level of infectious viral transmission to naïve reported Jurkat LTR-Luc cells (C). Computes correlation p-values calculated with Spearman test are indicated. D. Quantification of IFN-I production by pDCs co-cultured with C19 or C91-PL infected cells treated or not with PNA (10 μg/ml) for 30 minutes or with neuraminidase (Neu, 0.1 U/ml) for 1h prior the co-culture, as indicated. Results are presented as fold changes relative to untreated cells (mean ± SD, 5 independent experiments). Asterisks indicate statistically significant differences calculated using unpaired t-test between treated versus untreated setting: *** p<0.001. E. FACS analysis of C19 stained or not with PNA (10μg/ml) and C91-PL infected cells treated or not with neuraminidase (Neu, 0.1 U/ml) for 1h before staining with PNA (mean ± SD; 4 and 3 independent experiments respectively). Asterisks indicate statistically significant differences calculated using paired t-test between treated versus untreated setting: **** p<0.0001.

References

    1. Bruhn RL, Mahieux R, Murphy EL. Human lymphotropic viruses: HTLV-1 and HTLV-2 Clinical Virology 4th edition, ASM press; 2017.
    1. Willems L, Hasegawa H, Accolla R, Bangham C, Bazarbachi A, Bertazzoni U, et al. Reducing the global burden of HTLV-1 infection: An agenda for research and action. Antivir Res. 2017;137: 41–48. 10.1016/j.antiviral.2016.10.015 - DOI - PubMed
    1. Uchiyama T, Yodoi J, Sagawa K, Takatsuki K, Uchino H. Adult T-cell leukemia: clinical and hematologic features of 16 cases. Blood. 1977;50: 481–92. - PubMed
    1. Gessain A, Barin F, Vernant J, Gout O, Maurs L, Calender A, et al. Antibodies to human T-lymphotropic virus type-I in patients with tropical spastic paraparesis. Lancet. 1985;2: 407–410. - PubMed
    1. Jones KS, Petrow-Sadowski C, Huang YK, Bertolette DC, Ruscetti FW. Cell-free HTLV-1 infects dendritic cells leading to transmission and transformation of CD4(+) T cells. Nat Med. 2008;14: 429–36. 10.1038/nm1745 - DOI - PubMed

Publication types

MeSH terms