. 2019 Feb 28;14(2):e0212754.
doi: 10.1371/journal.pone.0212754. eCollection 2019.

Attention and speech-processing related functional brain networks activated in a multi-speaker environment

Affiliations

Attention and speech-processing related functional brain networks activated in a multi-speaker environment

Brigitta Tóth et al. PLoS One. .

Abstract

Human listeners can focus on one speech stream out of several concurrent ones. The present study aimed to assess the whole-brain functional networks underlying a) the process of focusing attention on a single speech stream vs. dividing attention between two streams and 2) speech processing on different time-scales and depth. Two spoken narratives were presented simultaneously while listeners were instructed to a) track and memorize the contents of a speech stream and b) detect the presence of numerals or syntactic violations in the same ("focused attended condition") or in the parallel stream ("divided attended condition"). Speech content tracking was found to be associated with stronger connectivity in lower frequency bands (delta band- 0,5-4 Hz), whereas the detection tasks were linked with networks operating in the faster alpha (8-10 Hz) and beta (13-30 Hz) bands. These results suggest that the oscillation frequencies of the dominant brain networks during speech processing may be related to the duration of the time window within which information is integrated. We also found that focusing attention on a single speaker compared to dividing attention between two concurrent speakers was predominantly associated with connections involving the frontal cortices in the delta (0.5-4 Hz), alpha (8-10 Hz), and beta bands (13-30 Hz), whereas dividing attention between two parallel speech streams was linked with stronger connectivity involving the parietal cortices in the delta and beta frequency bands. Overall, connections strengthened by focused attention may reflect control over information selection, whereas connections strengthened by divided attention may reflect the need for maintaining two streams in parallel and the related control processes necessary for performing the tasks.


Conflict of interest statement

The authors have declared that no competing interests exist.

Figures

Fig 1
Fig 1. Schematic illustration of the six experimental conditions.
Participants were listening to two concurrent speech streams under six experimental conditions: 1) Focused attention—only tracking (baseline) 2) Divided attention—only tracking (baseline) 3) Focused attention—numeral detection task 4) Divided attention—numeral detection task 5) Focused attention–syntactic violation detection task 6) Divided attention—syntactic violation detection task (see main text for the definition of the conditions). The gist of the task instructions specifying the target events for the detection task and the location of the target speech streams for each task are shown separately below each condition. The red “wave” pictograms indicate the target speech stream of the tracking task. Red “loudspeaker” pictograms and the “button-press” pictograms indicate the target speech stream of the detection task. Events like the targets of the detection task, when appearing in the non-target speech stream, served as distractors (non-target events).
Fig 2
Fig 2. Schematic illustration of the data analysis.
A) EEG preprocessing. Following primary filtering and ICA based artefact removal data was segmented. Epoch including target or non-target events or responses were excluded. Next, secondary artifact rejection (using threshold of 100 μV) was performed; B) EEG source localization. A minimum norm estimates model (sLORETA) for source-reconstruction was used together with forward boundary element head model (based on default anatomy and EEG locations); Current source density source activity was reconstructed for each voxel defined by the standardized parcellation scheme introduced by Klein & Tourville (2012). Finally, time-varying source signals was spatially down- sampled to the selected 36 ROIs; C) EEG functional connectivity measurement. Data were filtered for five frequency bands (from delta to gamma) and the phase lag index (PLI) was calculated as a measure of phase synchronization between each ROIs time series yielding 36 × 36 functional connectivity matrices for each individual, condition, and frequency band; D) EEG Network construction—Network-based statistic (NBS). An F test of each experimental contrast was run for each connection, and above-threshold connections selected for an F range between 3 and 10. The algorithm then searched for the largest fully connected network on each threshold level. Distribution of network size was pulled from the permutation of condition assignments (N = 10000). Family-wise error corrected p values of each network were obtained by comparing the network to the distribution derived from the random networks. Finally, the significant network on the highest F threshold level with only significant edges was selected (the maximum number of edges was set to 50); These networks were divided into two subnetworks according to the direction of the contrast effect. E) Correlation between EEG network-connectivity and behavioral measures. The average connectivity of the significant network emerging from each statistical contrast was correlated with the average behavioral indices (d, RT, recognition performance) of the corresponding condition. Family-wise error was controlled for each behavioral variable by estimating the distribution of the correlation coefficients via permuting the values of the network strengths 10,000 times.
Fig 3
Fig 3
Group average (N = 25) performance in the detection (indexed by RT and d’; panels A and B, respectively), the ratio of detection task FAs (responses elicited by distractors) to the total of the non-target responses (i.e., responses neither categorized as hits nor as false alarms; panel C), and performance in the tracking task (recognition memory performance; panel D), separately for the numeral (dark grey bars) and the syntactic violation task (light grey bars) and for the focused (left) and divided attention condition (right). Line bars represent standard errors.
Fig 4
Fig 4
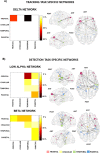
FC networks significantly affected by TASK TYPE: stronger for the tracking than for the detection task (Tracking Task Specific Networks: delta band panel A) and stronger for the detection than for the tracking task (Detection Task Specific Networks: EEG low alpha and beta bands panel B). The left column of panels A) and B) separately shows the regional distribution of the functional connections (color scale right from each panel). 100% refers to the sum of the connections comprising the significant network. The relative distributions of the connections are calculated for frontal, cingular, temporal and parietal cortices pooling the two hemispheres data. Values are plotted only above the diagonal. The right column of panels A) and B) separately shows a visualization of the significant networks on a plot of the cortical surface (top, left, and right view). Dots represent the spatial locations of the EEG sources reconstructed for cortical regions (nodes) in MNI space. The colors of the nodes indicate the cortical lobe: red–frontal; yellow–cingular; green–temporal; blue–parietal cortex. The size of the node represents the degree (number of connections within the network) of each node (see S5 Table).
Fig 5
Fig 5
FC networks significantly affected by ATTENTION: stronger for focused than for divided attention (Focused Attention Specific Networks: EEG delta, low alpha, and beta bands; left: A) and stronger for divided than for focused attention (Divided Attention Specific Networks: EEG delta and beta bands; right: B). The left column of panels A) and B), separately shows the regional distribution of the functional connections (color scale right from each panel). 100% refers to the sum of the connections comprising the significant network. The relative distributions of the connections are calculated for frontal, cingular, temporal and parietal cortices pooling the two hemispheres’ data. For the sake of simplicity, the values are plotted only above the diagonal. The right column of panels A) and B), separately shows a visualization of the significant networks on a plot of the cortical surface (top, left, and right view). Dots represent the spatial locations of the EEG sources reconstructed for cortical regions (nodes) in MNI space. The colors of the nodes indicate the cortical lobe: red–frontal, yellow–cingular, green–temporal, blue–parietal cortex. The size of the node represents the degree (number of connections within the network) of each node (see S5 Table).
Fig 6
Fig 6. A schematic depiction of the potential roles of functional networks in sensitive to the TASK TYPE contrast as a function of the NIRS/EEG frequency bands and a schematic brain functional hierarchy.
(Recording, analysis, and results for the NIRS data can be found in S5, S6 and S8 Files, S6 Table, S2 and S3 Figs). The NIRS/ EEG frequency scale is represented on the x-axis, whereas the functional hierarchy on the y-axis. The networks with stronger connectivity during the detection task are predominantly located in sensory/perceptual areas and operate on higher oscillatory frequencies, whereas the networks with stronger connectivity during the tracking task are located in perceptual/cognitive-control areas and operate on lower oscillatory frequencies.
Fig 7
Fig 7. A schematic depiction of the potential roles of functional networks in mediating focused vs. divided attention during processing two concurrent speech streams.
The y axis represents the functional level as well as the main hub regions of the networks.

References

    1. Cherry C. Some Experiments on the Recognition of Speech with One and with Two Ears.pdf.
    1. Bregman AS. Auditory Scene Analysis. of MIT CogNet. Chapter 1 The Auditory Scene. 1994;
    1. Hickok G, Poeppel D. processing. 2007;8: 393–402. - PubMed
    1. Power AJ, Foxe JJ, Forde EJ, Reilly RB, Lalor EC. At what time is the cocktail party? A late locus of selective attention to natural speech. Eur J Neurosci. 2012;35: 1497–1503. 10.1111/j.1460-9568.2012.08060.x - DOI - PubMed
    1. Mesgarani N, Chang EF. Selective cortical representation of attended speaker in multi-talker speech perception. Nature. Nature Publishing Group; 2012;485: 233–236. 10.1038/nature11020 - DOI - PMC - PubMed

Publication types