. 2019 May 14;139(20):2342-2357.
doi: 10.1161/CIRCULATIONAHA.117.028752.

Fibroblast Primary Cilia Are Required for Cardiac Fibrosis

Affiliations

Fibroblast Primary Cilia Are Required for Cardiac Fibrosis

Elisa Villalobos et al. Circulation. .

Abstract

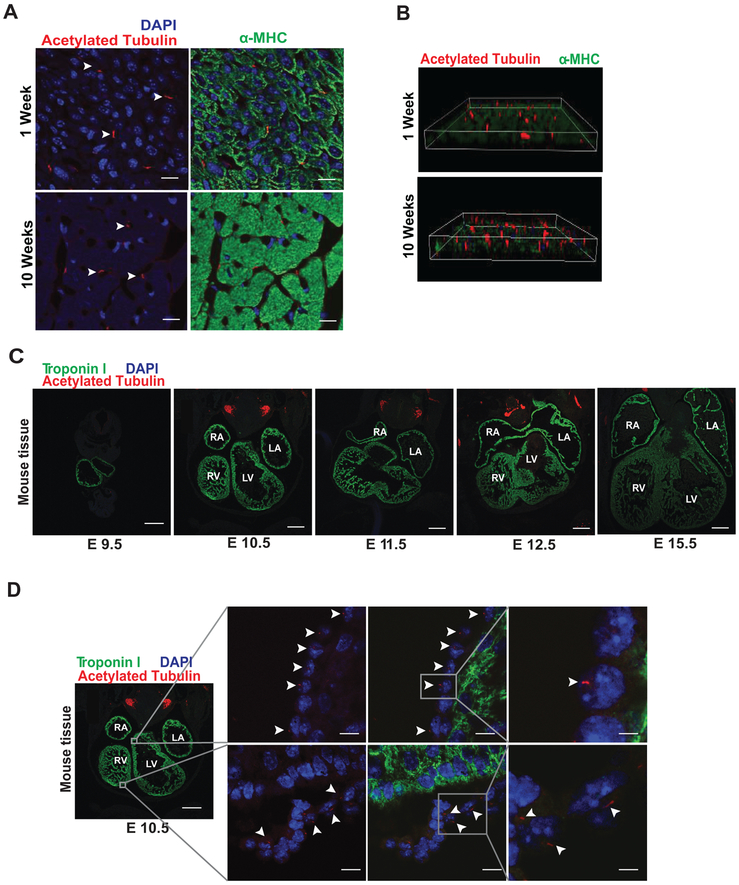
Background: The primary cilium is a singular cellular structure that extends from the surface of many cell types and plays crucial roles in vertebrate development, including that of the heart. Whereas ciliated cells have been described in developing heart, a role for primary cilia in adult heart has not been reported. This, coupled with the fact that mutations in genes coding for multiple ciliary proteins underlie polycystic kidney disease, a disorder with numerous cardiovascular manifestations, prompted us to identify cells in adult heart harboring a primary cilium and to determine whether primary cilia play a role in disease-related remodeling.

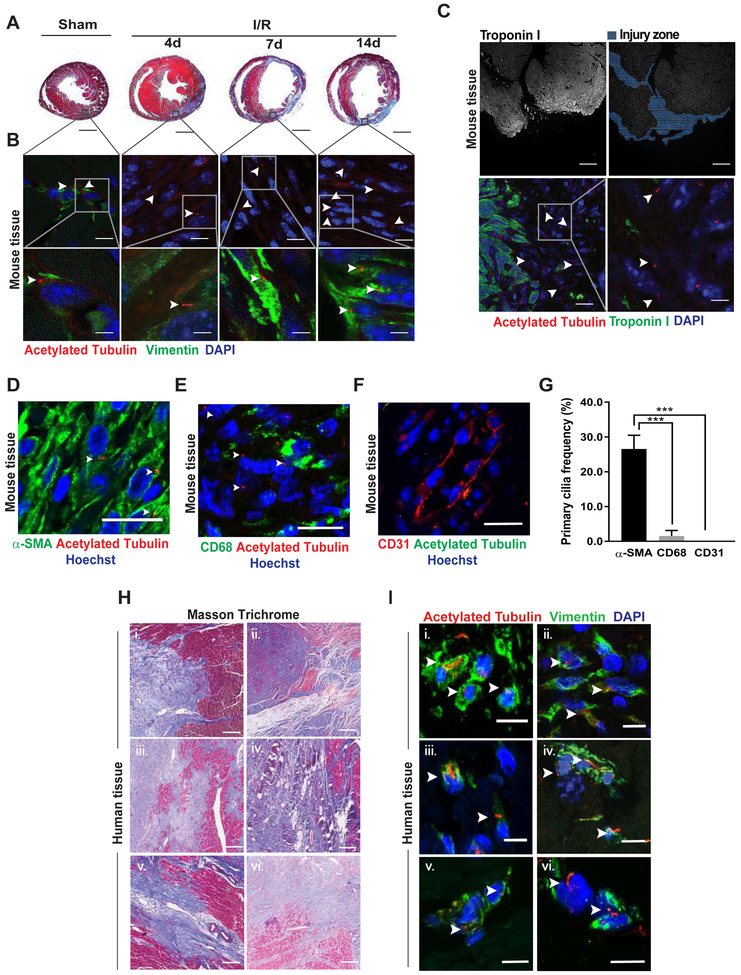
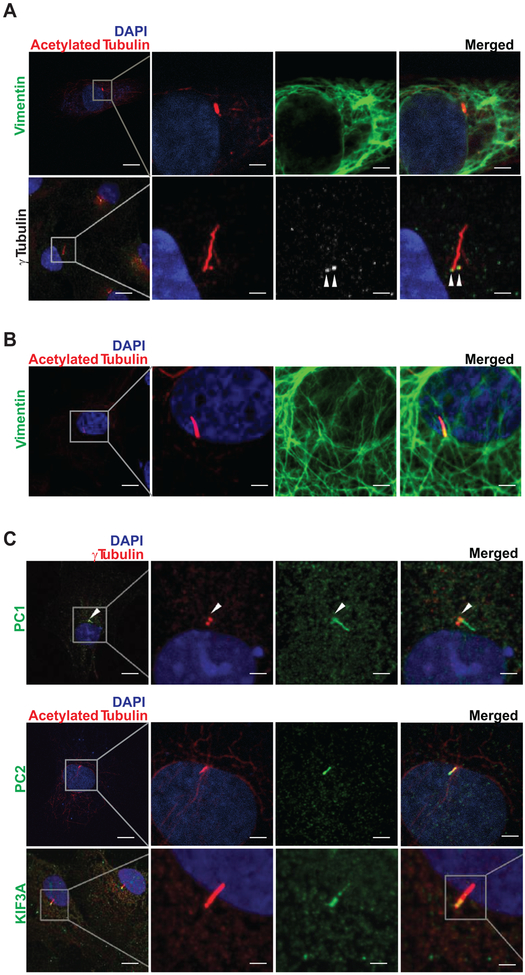
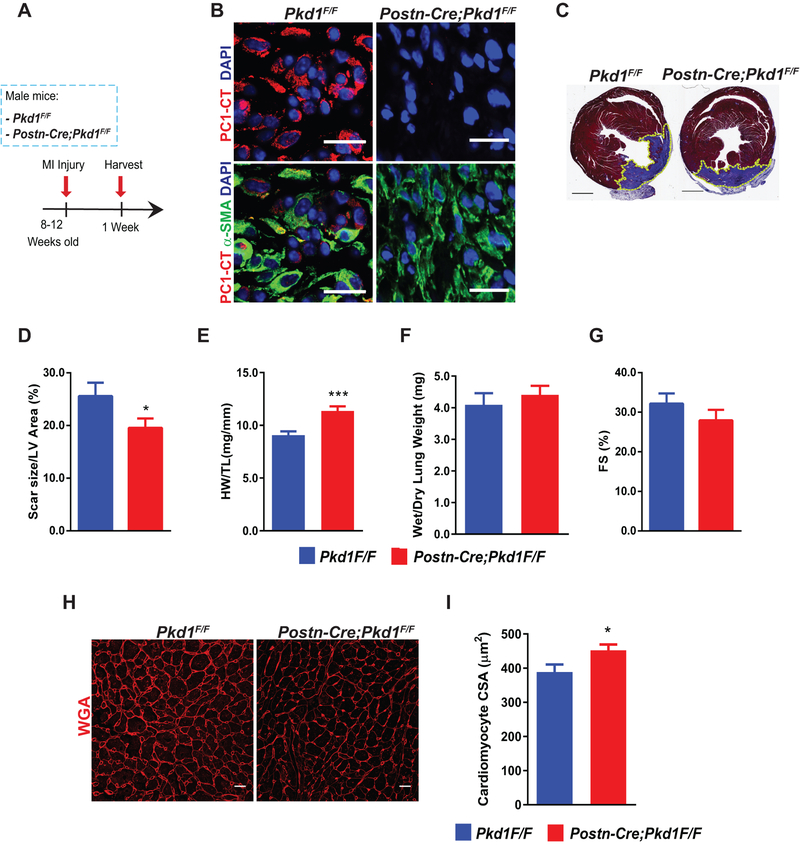
Methods: Histological analysis of cardiac tissues from C57BL/6 mouse embryos, neonatal mice, and adult mice was performed to evaluate for primary cilia. Three injury models (apical resection, ischemia/reperfusion, and myocardial infarction) were used to identify the location and cell type of ciliated cells with the use of antibodies specific for cilia (acetylated tubulin, γ-tubulin, polycystin [PC] 1, PC2, and KIF3A), fibroblasts (vimentin, α-smooth muscle actin, and fibroblast-specific protein-1), and cardiomyocytes (α-actinin and troponin I). A similar approach was used to assess for primary cilia in infarcted human myocardial tissue. We studied mice silenced exclusively in myofibroblasts for PC1 and evaluated the role of PC1 in fibrogenesis in adult rat fibroblasts and myofibroblasts.

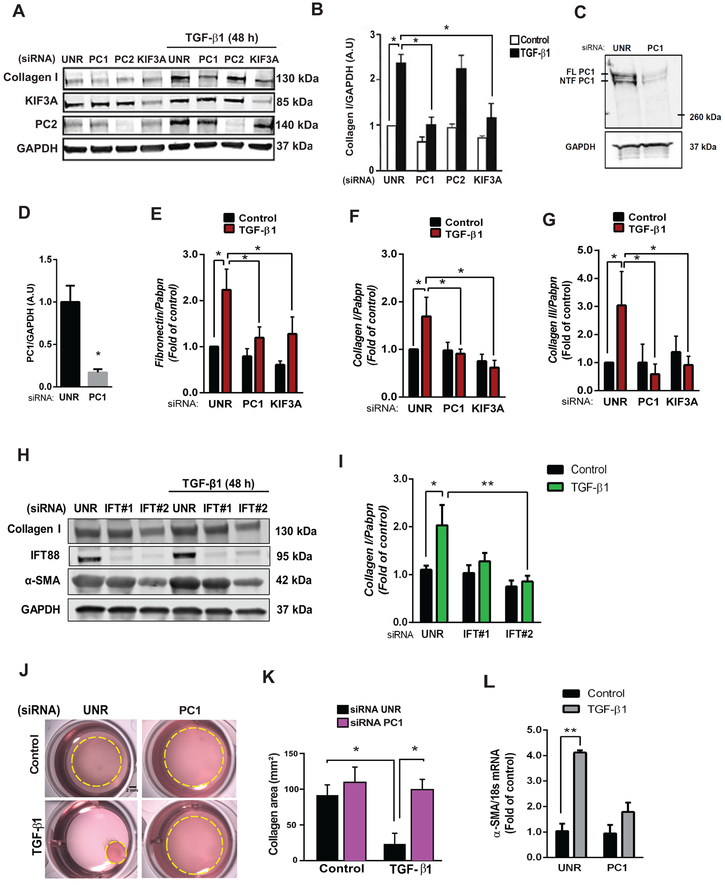
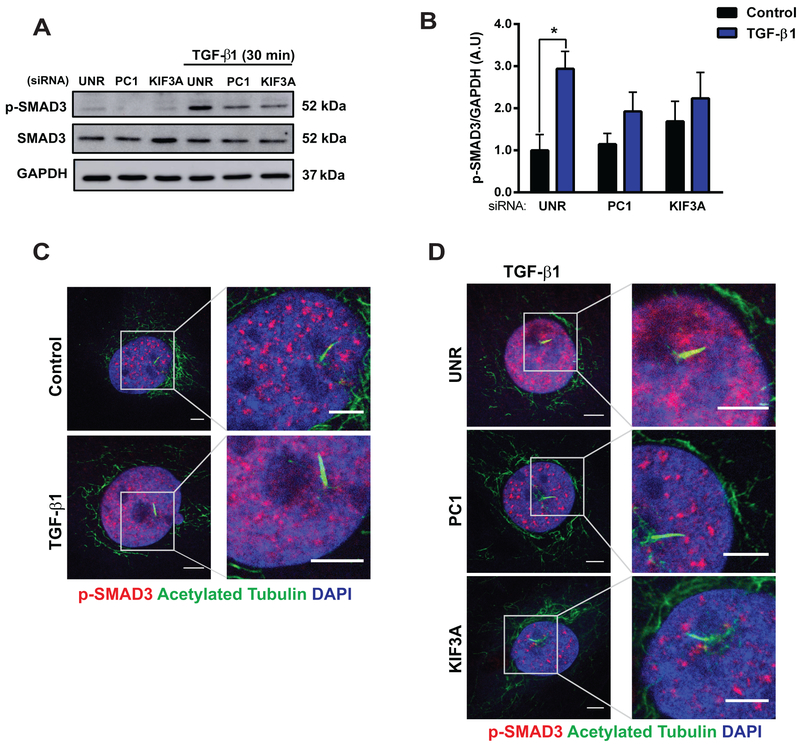
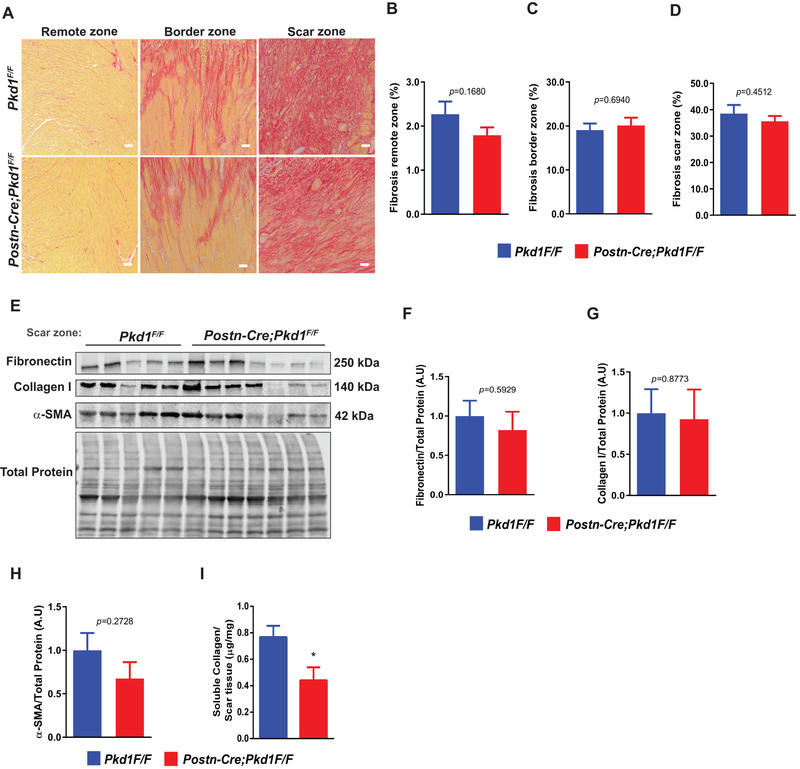
Results: We identified primary cilia in mouse, rat, and human heart, specifically and exclusively in cardiac fibroblasts. Ciliated fibroblasts are enriched in areas of myocardial injury. Transforming growth factor β-1 signaling and SMAD3 activation were impaired in fibroblasts depleted of the primary cilium. Extracellular matrix protein levels and contractile function were also impaired. In vivo, depletion of PC1 in activated fibroblasts after myocardial infarction impaired the remodeling response.

Conclusions: Fibroblasts in the neonatal and adult heart harbor a primary cilium. This organelle and its requisite signaling protein, PC1, are required for critical elements of fibrogenesis, including transforming growth factor β-1-SMAD3 activation, production of extracellular matrix proteins, and cell contractility. Together, these findings point to a pivotal role of this organelle, and PC1, in disease-related pathological cardiac remodeling and suggest that some of the cardiovascular manifestations of autosomal dominant polycystic kidney disease derive directly from myocardium-autonomous abnormalities.

Keywords: PKD1 protein; TGF-beta; cilia; fibroblasts; fibrosis; myocardial infarction.


Figures

Figure 1.
Figure 1.. Primary cilia are present in the heart.
(A) Hearts were harvested from 1- and 10-week-old male, C57BL/6 mice. Hearts were embedded in paraffin, and tissue sections were evaluated by immunofluorescence staining for acetylated tubulin (red) and α-MHC (green), (scale bar: 20 μm). (B) 3D reconstruction images from (A). (C and D) Mouse embryos were harvested at embryonic day (E): E9.5, E10.5, E11.5, E12.5 and E15.5. Then, embryos were embedded in paraffin and whole-body slices analyzed by immunofluorescence staining for acetylated tubulin (red) and troponin I (green, marker for cardiomyocytes). Nuclei were stained with DAPI (blue) (100 μg/mL), and representative images were collected using a confocal microscope (n=3). White arrowheads highlight the presence of ciliated cells. Right (RA), left atrium (LA), and left (LV) and right ventricles (RV) are indicated (scale bars: 50 and 20 μm).
Figure 2.
Figure 2.. Ciliated cells accumulate in zones of injured myocardium.
(A and B) 10–12 week-old male, C57BL/6 mice were subjected to ischemia (45 min) (I). Hearts were harvested 4, 7, or 14 days later (reperfusion, R). Sham surgery was used as control. (A) Masson trichrome staining was performed in two-chamber sections to evaluate for changes in collagen deposition (scale bar: 1 mm). (B) Ciliated cells from heart samples from (A) were evaluated by acetylated tubulin immunostaining; vimentin was used as fibroblast marker. White arrowheads indicate the presence of cilia (scale bars: 20 and 5 μm). (C) 7 day-old C57BL/6 mice underwent apical resection surgery. Hearts were harvested 7 days post-resection, and the presence of ciliated cells was assessed by immunofluorescence for acetylated tubulin; troponin I was used as cardiomyocyte marker. (D-F) Myocardial infarction (MI) surgery was performed in 10–12 week-old male, C57BL/6 mice. (D) α-SMA was used as a myofibroblast marker. (E) CD68 staining served as a macrophage marker, and (F) CD31 served as endothelial cell marker (scale bar: 20 μm). Hearts were harvested 7 days post-MI. The presence of cilia was evaluated in the scar area by immunofluorescence staining for acetylated tubulin. (G) Quantification of ciliated cells positive for α-SMA, CD68, and CD31 depicted in (D-F). Data are presented as mean percentage ± S.E.M., one-way ANOVA with Dunnet post-hoc test, ***p ≤ 0.001 vs α-SMA (n=3–4). (H and I) Human heart tissue samples from 6 patients with stage IV heart failure were obtained at the time of cardiac transplantation and then subjected to (H) Masson trichrome staining to evaluate fibrosis (scale bar: 800 μm) and (I) immunofluorescence to evaluate ciliated cells (acetylated tubulin); vimentin served as a fibroblast marker (scale bar: 20 μm). For all images, nuclei were stained with either DAPI or Hoechst (100 μg/mL and 1 μg/mL, respectively), and images representative of 3–4 different animals are depicted. Images were obtained using a confocal microscope. White arrowheads highlight the presence of ciliated cells.
Figure 3.
Figure 3.. Primary cilia, PC1, PC2, and KIF3A are present in cardiac fibroblasts.
Primary cultures of (A) neonatal and (B) adult rat cardiac fibroblasts (NRCF and ARCF, respectively) were prepared, and immunofluorescence assays were performed to evaluate (A-C) vimentin, acetylated tubulin, γ-tubulin, PC1, PC2, and KIF3A. Nuclei were stained with DAPI (100 μg/mL). Representative images from 3 different cultures were obtained using a confocal microscope (scale bars: 20 and 5 μm). White arrowheads highlight the base of the cilium where γ-tubulin immunofluorescence was detected.
Figure 4.
Figure 4.. Cilia and PC1 are required for TGF-β1-induced cardiac fibrosis.
(A and B) Cultures of NRCF were prepared, and depletion of PC1, PC2 and KIF3A was accomplished using specific siRNAs versus control (unrelated siRNA, UNR). Cells were then treated with 10 ng/mL TGF-β1 for 48 h and total protein extracts or RNA were isolated. (A) Collagen type I, KIF3A, and PC2 were evaluated by Western blotting. GAPDH was used as loading control. Gels representative of three independent experiments are depicted. Gels shown in (A) were quantified (B). Data are represented as mean ± S.E.M. Two-way ANOVA, followed by Tukey’s post-hoc test. *p < 0.05, n=3 independent cell cultures. (C and D) Knockdown of PC1 in ARCF. (C) PC1 protein levels after knockdown with siRNA (36 h) were evaluated by Western blotting: FL: full length PC1; NTF: N-terminal PC1. (D) Average densitometry from 3 independent cultures. Data are shown as mean ± S.E.M. Unpaired Student’s t-test, *p < 0.05 vs UNR. (E-G) Transcript levels of (E) fibronectin, (F) collagen I and (G) collagen III were analyzed by quantitative RT-PCR, and Pabpn was used as housekeeping gene. Results are normalized to 1, and data are depicted as mean ± S.E.M. Two-way ANOVA followed by Tukey’s post-hoc test. *p < 0.05 (n=5–7). (H and I) Cultures of ARCF were prepared, and depletion of IFT88 with two sequence-independent siRNAs was performed. Cells were then treated with 10 ng/mL TGF-β1 for 48 h and total protein extracts were isolated. (H) Collagen type I, α-SMA and IFT88 levels were evaluated by Western blotting. (I) GAPDH was used as loading control for quantifications. Data are presented as mean ± S.E.M., Two-way ANOVA, followed by Tukey’s post-hoc test, *p < 0.05; **p < 0.01 (n=3 independent cultures). Representative images (J) and quantification (K) of contraction of collagen matrices seeded with NRCF under control conditions (UNR) or following PC1 knockdown with or without TGF-β1 (48 h). Collagen area represents mean ± S.E.M. Two-way ANOVA, followed by Tukey’s post-hoc test, *p < 0.05, n=3 independent cultures (Scale bar 2 mm). (L) Transcript levels of α-SMA were analyzed by quantitative RT-PCR, and 18s was used as housekeeping gene. Results are normalized to 1, and data are depicted as mean ± S.E.M. Two-way ANOVA followed by Tukey’s post-hoc test. *p < 0.05 (n=5–7)
Figure 5.
Figure 5.. Cilia and PC1 are required for TGF-β1-triggered SMAD3 signaling.
Cultures of NRCF (A and B) and ARCF (C and D) were prepared and treated with 10 ng/mL TGF-β1 for 30 min in cells previously subjected to siRNA-mediated downregulation of PC1 or KIF3A. (A and B) Protein extracts were isolated, and p-SMAD3 and SMAD3 were evaluated by Western blotting. GAPDH was used as loading control. Gels were quantified, and values are depicted in (B). Data are mean ± S.E.M., two-way ANOVA, followed by Tukey’s post-hoc test. *p < 0.05 (n=4 independent cultures). Immunofluorescence for acetylated tubulin (green) and p-SMAD3 (red) in (C) cultures of ARCF treated with or without TGF-β1 for 30 min and (D) cultures of ARCF depleted of PC1 or KIF3A using specific siRNAs. Cells were then treated with 10 ng/mL TGF-β1 for 30 min (n=3–4 independent cultures). Nuclei were stained with DAPI (100 μg/mL). Representative images were obtained using a confocal microscope (scale bar: 5 μm).
Figure 6.
Figure 6.. Fibroblast-specific PC1 inactivation enhances pathological cardiac remodeling following myocardial infarction (MI).
(A) MI surgery was performed in 8–12 week-old male mice of the following genotypes: Pkd1F/F and Postn-Cre; Pkd1F/F. Hearts were harvested 1 week post-surgery. (B) Immunofluorescence from the scar zone to evaluate PC1 down-regulation in activated fibroblasts with PC1 C-terminal antibody (PC1-CT) and α-SMA as a marker of activated fibroblasts (scale bar: 20 μm). Nuclei were stained with DAPI (100 μg/mL), and images representative of 4 animals per group are depicted. Images were obtained using a confocal microscope. (C) Masson trichrome staining was performed to evaluate fibrosis and scar size. Representative images (n=12 animals per group) were obtained using a slide scanner (scale bar: 1 mm). (D) Scar size quantification. Data are shown as mean ± S.E.M., unpaired Student’s t-test with Welch’s correction, n=12 animals per group. *p < 0.05. Morphometric analyses were performed after MI. (E) Heart weight/tibia length (HW/TL) and (F) wet/dry lung weight. Data are shown as mean ± S.E.M., unpaired Student’s t-test with Welch’s correction, n=19–21 animals per group. ***p < 0.001. (G) Ventricular contractile function was evaluated by transthoracic echocardiography. Fractional shortening (FS). Data are shown as mean ± S.E.M., unpaired Student’s t-test with Welch’s correction, n=19–22 animals per group. *p < 0.05. (H and I) Evaluation of cardiomyocyte cross-sectional area (CSA) after MI by wheat germ agglutinin (WGA) staining. (H) Representative images of WGA staining. Images were obtained with a confocal microscope (scale bar 20 μm). (I) Quantification of data depicted in (H). Data are shown as mean ± S.E.M., unpaired Student’s t-test with Welch’s correction, n=10–11 animals per group. *p < 0.05.
Figure 7.
Figure 7.. Alterations in scar composition in fibroblast-specific PC1 knockouts post-MI.
(A-H) MI surgery was performed in 8–12 week-old male mice of the following genotypes: Pkd1F/F and Postn-Cre; Pkd1F/F. Hearts were harvested 7 days post-surgery. (A) Picrosirius red staining was performed to evaluate collagen deposition in the remote, border and scar zones (scale bar: 20 μm). (B-D) Quantification of fibrosis area depicted in (A). (E-H) Protein extracts were isolated from the scar, and protein levels of fibronectin, collagen I, and α-SMA were evaluated by Western blotting. Total protein was used as loading control. Gels were quantified, and values are depicted in (F-H), respectively. (I) Sircol assay was performed from scar tissue to measure soluble collagen levels. Data are shown as mean ± S.E.M., unpaired Student’s t-test with Welch’s correction, n= 8–10 animals per group. * p < 0.05.
Figure 8.
Figure 8.. PC1 is required for myofibroblast contractile function.
(A-J) ARCF were isolated and differentiated with TGF-β1 (10 ng/mL, 96 h). After that, depletion of PC1 versus control (unrelated, UNR) was performed using specific siRNAs. Total protein extracts were isolated. (B and C) PC1 knockdown was evaluated by Western blotting. GAPDH was used as loading control. Gels depicted are representative of 3–4 different cultures. Gels shown in (B) were quantified (C). (D-G) Total protein extracts were isolated, and protein levels of fibronectin, collagen I, and α-SMA were evaluated by Western blotting. GAPDH was used as loading control. Gels depicted are representative of 4 independent cultures. Gels shown in (F) were quantified, and values are depicted in (E-G), respectively. (H) RNA isolation from total extracts was performed to evaluate gene expression of collagen I, fibronectin, collagen III, and α-SMA using quantitative RT-PCR. Pabpn, RPL13 and GAPDH were used as housekeeping genes. Data are shown as mean ± S.E.M., unpaired Student’s t-test, n = 7 independent cultures. *p < 0.05. (I and J) Contraction of collagen matrices seeded with differentiated ARCF under control conditions (UNR) or following PC1 knockdown. (I) Representative images and collagen area quantification in (J). Data are shown as mean ± S.E.M., unpaired Student’s t-test, n = 6, from 2 independent cultures. *** p < 0.001 (K) Graphical summary of our principal findings.

Similar articles

Cited by

References

    1. Berbari NF, O’Connor AK, Haycraft CJ and Yoder BK. The primary cilium as a complex signaling center. Curr Biol. 2009;19:R526–535. DOI: 10.1016/j.cub.2009.05.025 - DOI - PMC - PubMed
    1. Raghavan V and Weisz OA. Discerning the role of mechanosensors in regulating proximal tubule function. Am J Physiol Renal Physiol. 2016;310:F1–5. DOI:10.1152/ajprenal.00373.2015 - DOI - PMC - PubMed
    1. Zhu D, Shi S, Wang H and Liao K. Growth arrest induces primary-cilium formation and sensitizes IGF-1-receptor signaling during differentiation induction of 3T3-L1 preadipocytes. J Cell Sci. 2009;122:2760–2768. DOI: 10.1242/jcs.046276 - DOI - PubMed
    1. Gazea M, Tasouri E, Tolve M, Bosch V, Kabanova A, Gojak C, Kurtulmus B, Novikov O, Spatz J, Pereira G, Hubner W, Brodski C, Tucker KL and Blaess S. Primary cilia are critical for Sonic hedgehog-mediated dopaminergic neurogenesis in the embryonic midbrain. Dev Biol. 2016;409:55–71. DOI: 10.1016/j.ydbio.2015.10.033 - DOI - PMC - PubMed
    1. Delling M, DeCaen PG, Doerner JF, Febvay S and Clapham DE. Primary cilia are specialized calcium signalling organelles. Nature. 2013;504:311–314. DOI: 10.1038/nature12833 - DOI - PMC - PubMed

Publication types

MeSH terms