

The disordered plant dehydrin Lti30 protects the membrane during water-related stress by cross-linking lipids
- PMID: 30819802
- PMCID: PMC6484140
- DOI: 10.1074/jbc.RA118.007163
The disordered plant dehydrin Lti30 protects the membrane during water-related stress by cross-linking lipids
Abstract
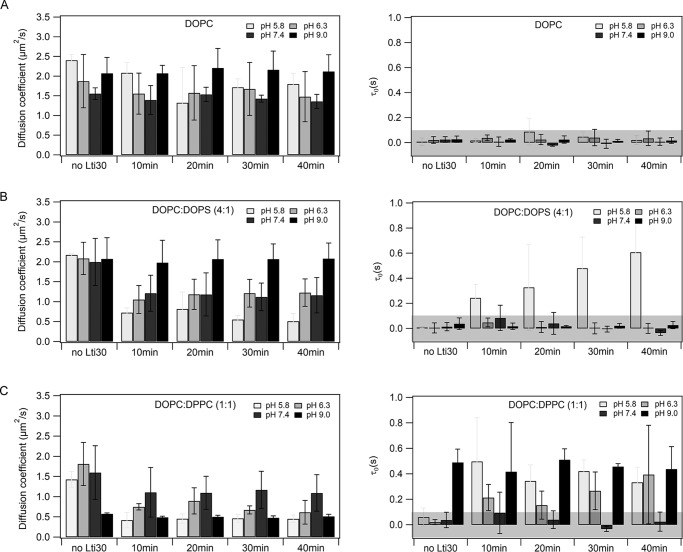
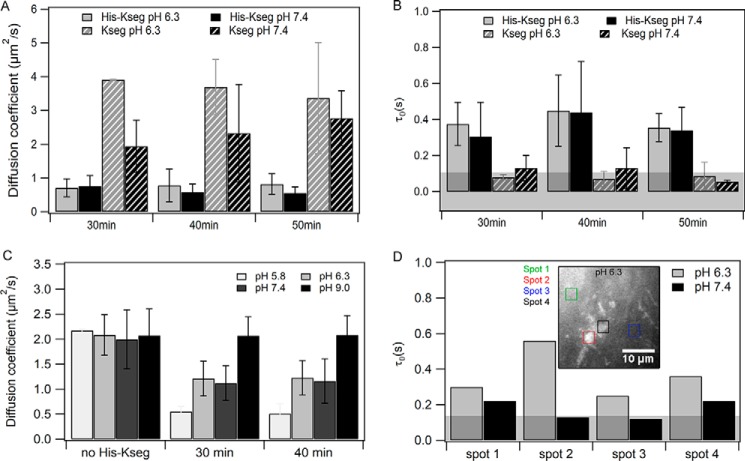
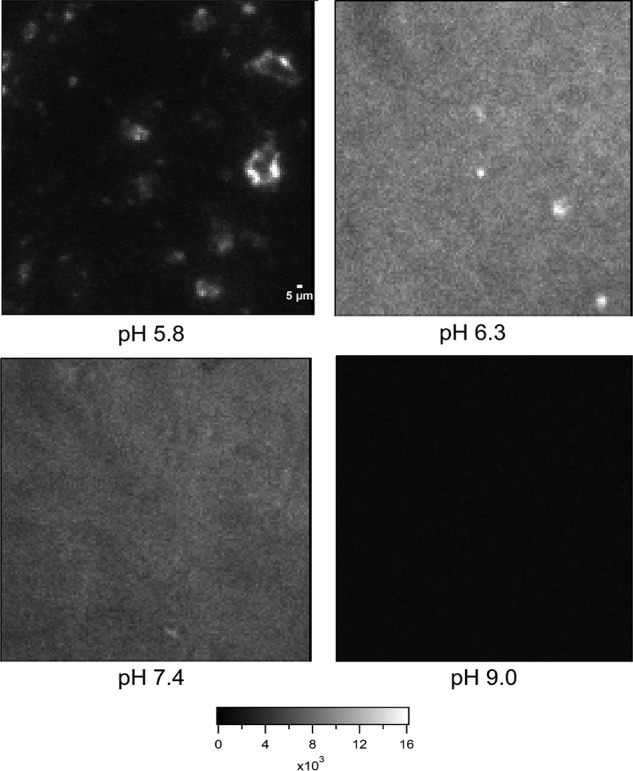
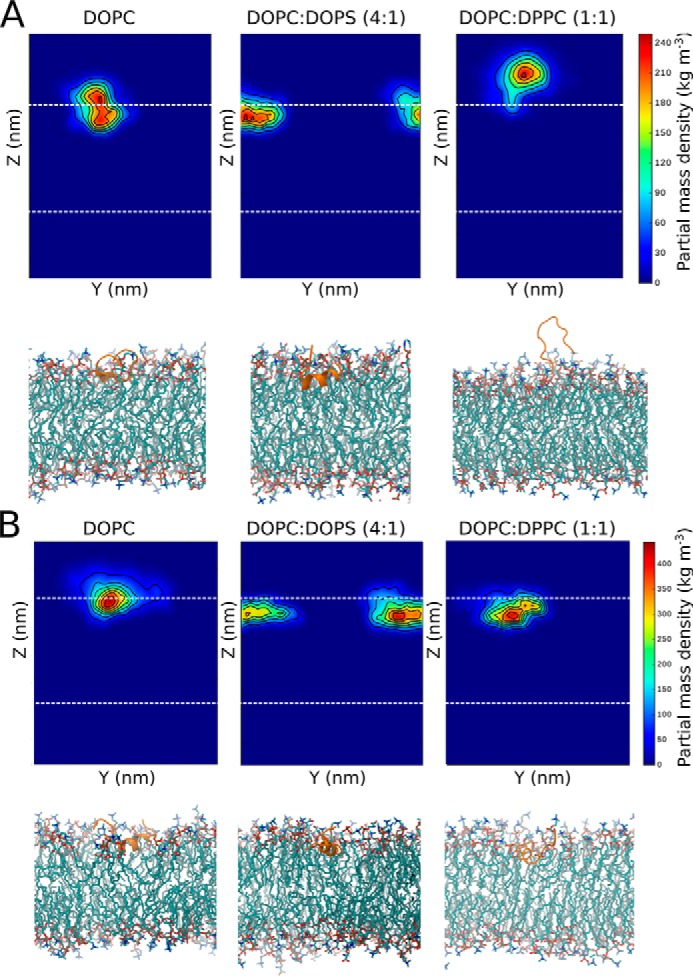
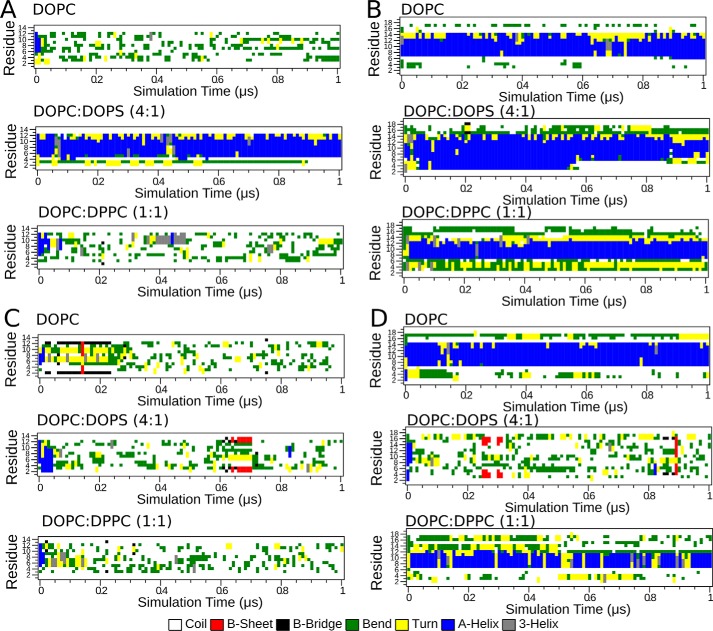
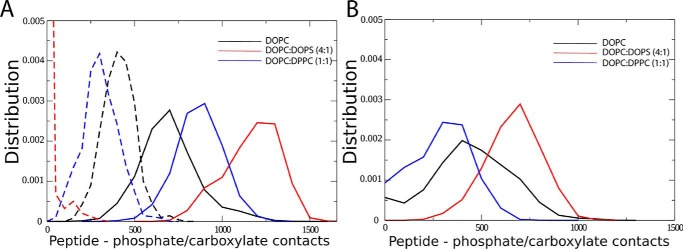
Dehydrins are intrinsically disordered proteins, generally expressed in plants as a response to embryogenesis and water-related stress. Their suggested functions are in membrane stabilization and cell protection. All dehydrins contain at least one copy of the highly conserved K-segment, proposed to be a membrane-binding motif. The dehydrin Lti30 (Arabidopsis thaliana) is up-regulated during cold and drought stress conditions and comprises six K-segments, each with two adjacent histidines. Lti30 interacts with the membrane electrostatically via pH-dependent protonation of the histidines. In this work, we seek a molecular understanding of the membrane interaction mechanism of Lti30 by determining the diffusion and molecular organization of Lti30 on model membrane systems by imaging total internal reflection- fluorescence correlation spectroscopy (ITIR-FCS) and molecular dynamics (MD) simulations. The dependence of the diffusion coefficient explored by ITIR-FCS together with MD simulations yields insights into Lti30 binding, domain partitioning, and aggregation. The effect of Lti30 on membrane lipid diffusion was studied on fluorescently labeled supported lipid bilayers of different lipid compositions at mechanistically important pH conditions. In parallel, we compared the mode of diffusion for short individual K-segment peptides. The results indicate that Lti30 binds the lipid bilayer via electrostatics, which restricts the mobility of lipids and bound protein molecules. At low pH, Lti30 binding induced lipid microdomain formation as well as protein aggregation, which could be correlated with one another. Moreover, at physiological pH, Lti30 forms nanoscale aggregates when proximal to the membrane suggesting that Lti30 may protect the cell by "cross-linking" the membrane lipids.
Keywords: Diffusion; K-segments; Lti30; disorder; fluorescence correlation spectroscopy (FCS); histidine; intrinsically disordered protein; lipid bilayer; membrane lipid; molecular dynamics; supported lipid bilayers.
© 2019 Gupta et al.
Conflict of interest statement
The authors declare that they have no conflicts of interest with the contents of this article.
Figures

Similar articles
-
Membrane-Induced Folding of the Plant Stress Dehydrin Lti30.Plant Physiol. 2016 Jun;171(2):932-43. doi: 10.1104/pp.15.01531. Epub 2016 Apr 26. Plant Physiol. 2016. PMID: 27208263 Free PMC article.
-
Tunable membrane binding of the intrinsically disordered dehydrin Lti30, a cold-induced plant stress protein.Plant Cell. 2011 Jun;23(6):2391-404. doi: 10.1105/tpc.111.085183. Epub 2011 Jun 10. Plant Cell. 2011. PMID: 21665998 Free PMC article.
-
The plant dehydrin Lti30 stabilizes lipid lamellar structures in varying hydration conditions.J Lipid Res. 2020 Jul;61(7):1014-1024. doi: 10.1194/jlr.RA120000624. Epub 2020 May 13. J Lipid Res. 2020. PMID: 32404333 Free PMC article.
-
Disorder and function: a review of the dehydrin protein family.Front Plant Sci. 2014 Oct 31;5:576. doi: 10.3389/fpls.2014.00576. eCollection 2014. Front Plant Sci. 2014. PMID: 25400646 Free PMC article. Review.
-
Structural and Functional Dynamics of Dehydrins: A Plant Protector Protein under Abiotic Stress.Int J Mol Sci. 2018 Oct 31;19(11):3420. doi: 10.3390/ijms19113420. Int J Mol Sci. 2018. PMID: 30384475 Free PMC article. Review.
Cited by
-
Genome-Wide Characterization of Wholly Disordered Proteins in Arabidopsis.Int J Mol Sci. 2025 Jan 28;26(3):1117. doi: 10.3390/ijms26031117. Int J Mol Sci. 2025. PMID: 39940886 Free PMC article.
-
Research progress on the physiological response and molecular mechanism of cold response in plants.Front Plant Sci. 2024 Jan 30;15:1334913. doi: 10.3389/fpls.2024.1334913. eCollection 2024. Front Plant Sci. 2024. PMID: 38352650 Free PMC article. Review.
-
Protein Disorder in Plant Stress Adaptation: From Late Embryogenesis Abundant to Other Intrinsically Disordered Proteins.Int J Mol Sci. 2024 Jan 18;25(2):1178. doi: 10.3390/ijms25021178. Int J Mol Sci. 2024. PMID: 38256256 Free PMC article. Review.
-
Multiple copies of a novel amphipathic α-helix forming segment in Physcomitrella patens dehydrin play a key role in abiotic stress mitigation.J Biol Chem. 2021 Jan-Jun;296:100596. doi: 10.1016/j.jbc.2021.100596. Epub 2021 Mar 26. J Biol Chem. 2021. PMID: 33781743 Free PMC article.
-
Plant Dehydrins: Expression, Regulatory Networks, and Protective Roles in Plants Challenged by Abiotic Stress.Int J Mol Sci. 2021 Nov 23;22(23):12619. doi: 10.3390/ijms222312619. Int J Mol Sci. 2021. PMID: 34884426 Free PMC article. Review.
References
-
- Clarke M. W., Boddington K. F., Warnica J. M., Atkinson J., McKenna S., Madge J., Barker C. H., and Graether S. P. (2015) Structural and functional insights into the cryoprotection of membranes by the intrinsically disordered dehydrins. J. Biol. Chem. 290, 26900–26913 10.1074/jbc.M115.678219 - DOI - PMC - PubMed
Publication types
MeSH terms
Substances
LinkOut - more resources
Full Text Sources
Molecular Biology Databases
