

Motional dynamics of single Patched1 molecules in cilia are controlled by Hedgehog and cholesterol
- PMID: 30819883
- PMCID: PMC6431229
- DOI: 10.1073/pnas.1816747116
Motional dynamics of single Patched1 molecules in cilia are controlled by Hedgehog and cholesterol
Abstract
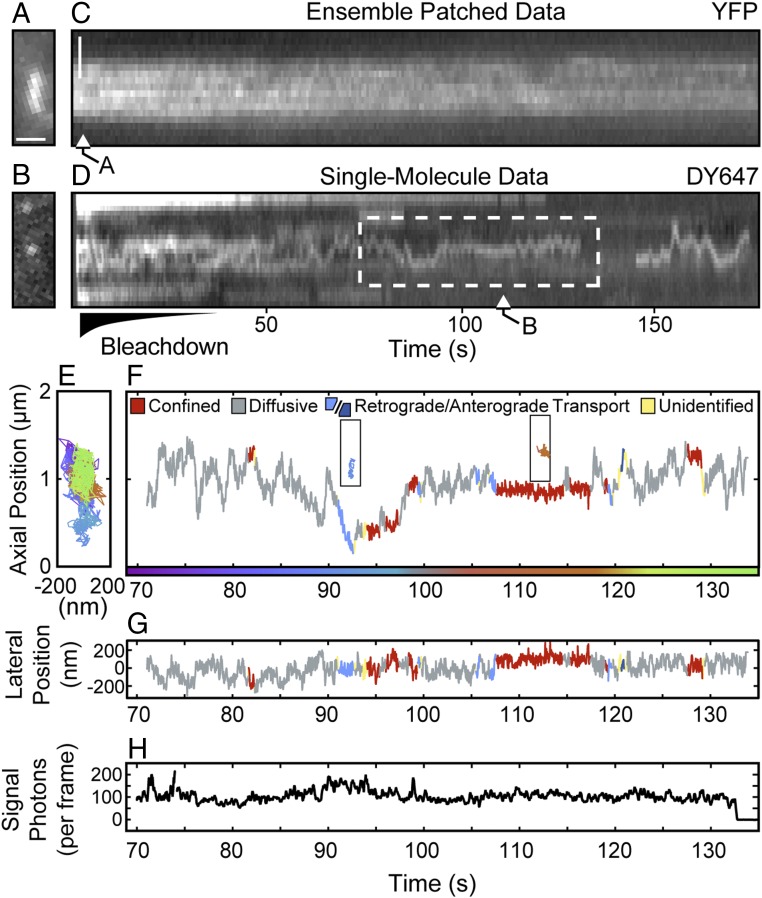
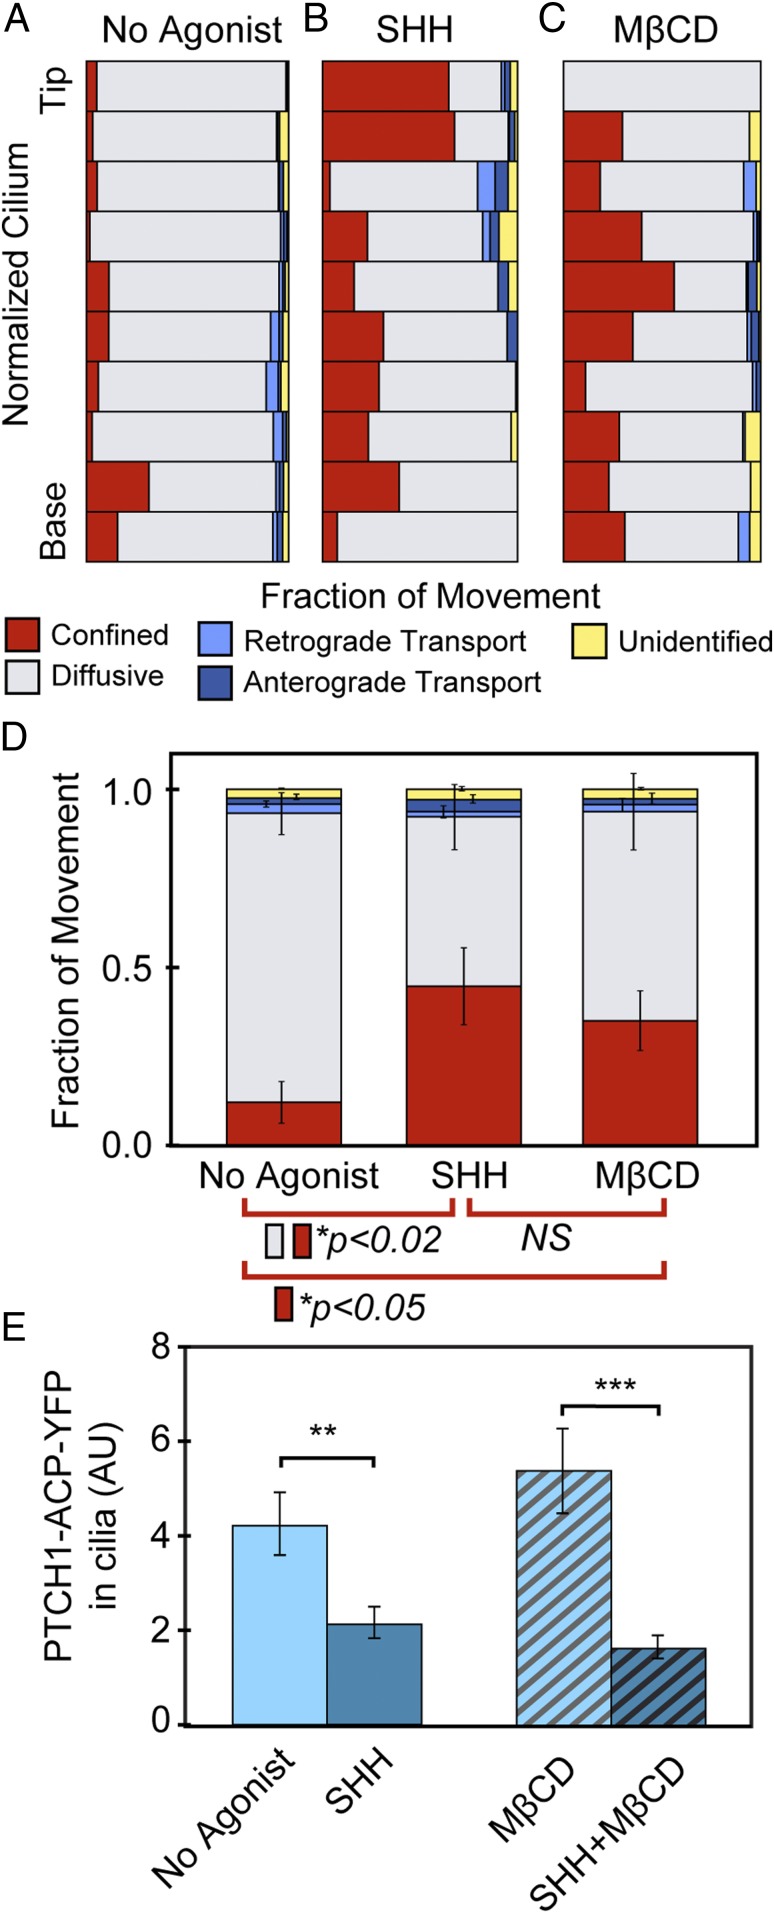
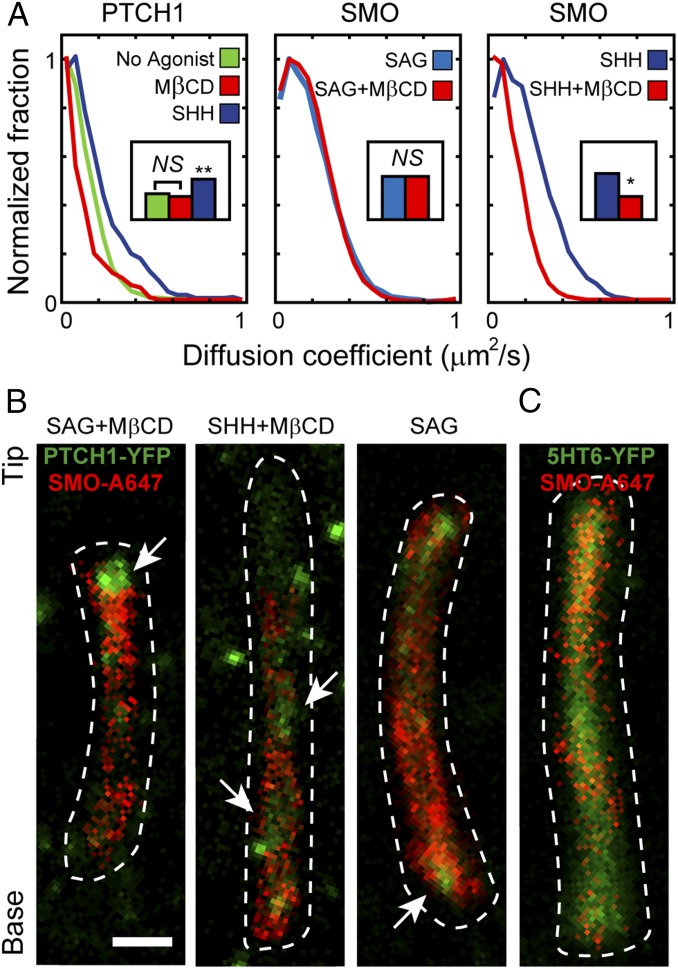
The Hedgehog-signaling pathway is an important target in cancer research and regenerative medicine; yet, on the cellular level, many steps are still poorly understood. Extensive studies of the bulk behavior of the key proteins in the pathway established that during signal transduction they dynamically localize in primary cilia, antenna-like solitary organelles present on most cells. The secreted Hedgehog ligand Sonic Hedgehog (SHH) binds to its receptor Patched1 (PTCH1) in primary cilia, causing its inactivation and delocalization from cilia. At the same time, the transmembrane protein Smoothened (SMO) is released of its inhibition by PTCH1 and accumulates in cilia. We used advanced, single molecule-based microscopy to investigate these processes in live cells. As previously observed for SMO, PTCH1 molecules in cilia predominantly move by diffusion and less frequently by directional transport, and spend a fraction of time confined. After treatment with SHH we observed two major changes in the motional dynamics of PTCH1 in cilia. First, PTCH1 molecules spend more time as confined, and less time freely diffusing. This result could be mimicked by a depletion of cholesterol from cells. Second, after treatment with SHH, but not after cholesterol depletion, the molecules that remain in the diffusive state showed a significant increase in the diffusion coefficient. Therefore, PTCH1 inactivation by SHH changes the diffusive motion of PTCH1, possibly by modifying the membrane microenvironment in which PTCH1 resides.
Keywords: Hedgehog signaling; Patched; Smoothened; primary cilia; single-molecule tracking.
Copyright © 2019 the Author(s). Published by PNAS.
Conflict of interest statement
The authors declare no conflict of interest.
Figures


Similar articles
-
Macroautophagy supports Sonic Hedgehog signaling by promoting Patched1 degradation.Biochim Biophys Acta Mol Cell Res. 2021 Nov;1868(12):119124. doi: 10.1016/j.bbamcr.2021.119124. Epub 2021 Aug 20. Biochim Biophys Acta Mol Cell Res. 2021. PMID: 34419491
-
Patched1-ArhGAP36-PKA-Inversin axis determines the ciliary translocation of Smoothened for Sonic Hedgehog pathway activation.Proc Natl Acad Sci U S A. 2019 Jan 15;116(3):874-879. doi: 10.1073/pnas.1804042116. Epub 2018 Dec 31. Proc Natl Acad Sci U S A. 2019. PMID: 30598432 Free PMC article.
-
Single-molecule imaging of Hedgehog pathway protein Smoothened in primary cilia reveals binding events regulated by Patched1.Proc Natl Acad Sci U S A. 2015 Jul 7;112(27):8320-5. doi: 10.1073/pnas.1510094112. Epub 2015 Jun 22. Proc Natl Acad Sci U S A. 2015. PMID: 26100903 Free PMC article.
-
Cholesterol access in cellular membranes controls Hedgehog signaling.Nat Chem Biol. 2020 Dec;16(12):1303-1313. doi: 10.1038/s41589-020-00678-2. Epub 2020 Nov 16. Nat Chem Biol. 2020. PMID: 33199907 Free PMC article. Review.
-
Structures of vertebrate Patched and Smoothened reveal intimate links between cholesterol and Hedgehog signalling.Curr Opin Struct Biol. 2019 Aug;57:204-214. doi: 10.1016/j.sbi.2019.05.015. Epub 2019 Jun 24. Curr Opin Struct Biol. 2019. PMID: 31247512 Free PMC article. Review.
Cited by
-
Relative Affinities of Protein-Cholesterol Interactions from Equilibrium Molecular Dynamics Simulations.J Chem Theory Comput. 2021 Oct 12;17(10):6548-6558. doi: 10.1021/acs.jctc.1c00547. Epub 2021 Sep 15. J Chem Theory Comput. 2021. PMID: 34523933 Free PMC article.
-
Cholesterol Contributes to Male Sex Differentiation Through Its Developmental Role in Androgen Synthesis and Hedgehog Signaling.Endocrinology. 2021 Jul 1;162(7):bqab066. doi: 10.1210/endocr/bqab066. Endocrinology. 2021. PMID: 33784378 Free PMC article. Review.
-
A mechanistic examination of salting out in protein-polymer membrane interactions.Proc Natl Acad Sci U S A. 2019 Nov 12;116(46):22938-22945. doi: 10.1073/pnas.1909860116. Epub 2019 Oct 28. Proc Natl Acad Sci U S A. 2019. PMID: 31659038 Free PMC article.
-
Transport and barrier mechanisms that regulate ciliary compartmentalization and ciliopathies.Nat Rev Nephrol. 2024 Feb;20(2):83-100. doi: 10.1038/s41581-023-00773-2. Epub 2023 Oct 23. Nat Rev Nephrol. 2024. PMID: 37872350 Review.
-
Drug and siRNA screens identify ROCK2 as a therapeutic target for ciliopathies.Commun Med (Lond). 2025 Apr 19;5(1):129. doi: 10.1038/s43856-025-00847-1. Commun Med (Lond). 2025. PMID: 40253509 Free PMC article.
References
-
- Ingham PW, Nakano Y, Seger C. Mechanisms and functions of Hedgehog signalling across the metazoa. Nat Rev Genet. 2011;12:393–406. - PubMed
-
- Briscoe J, Thérond PP. The mechanisms of Hedgehog signalling and its roles in development and disease. Nat Rev Mol Cell Biol. 2013;14:416–429. - PubMed
-
- Gould SE, et al. Discovery and preclinical development of vismodegib. Expert Opin Drug Discov. 2014;9:969–984. - PubMed
Publication types
MeSH terms
Substances
Grants and funding
LinkOut - more resources
Full Text Sources
Medical
Research Materials
Miscellaneous
