. 2019 Oct;104(10):2040-2052.
doi: 10.3324/haematol.2018.209981. Epub 2019 Feb 28.

p66Shc deficiency in the Eμ-TCL1 mouse model of chronic lymphocytic leukemia enhances leukemogenesis by altering the chemokine receptor landscape

Affiliations

p66Shc deficiency in the Eμ-TCL1 mouse model of chronic lymphocytic leukemia enhances leukemogenesis by altering the chemokine receptor landscape

Laura Patrussi et al. Haematologica. 2019 Oct.

Abstract

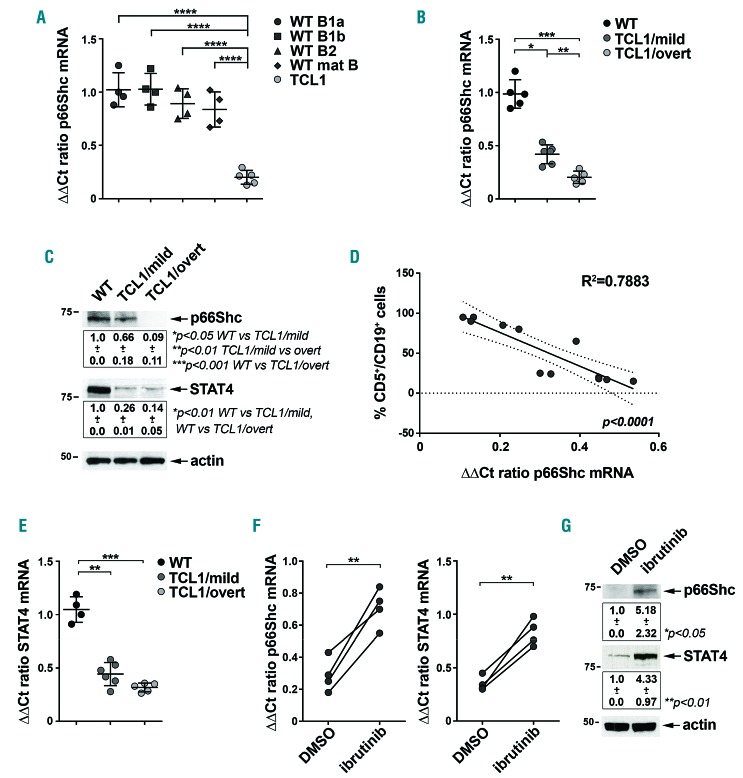
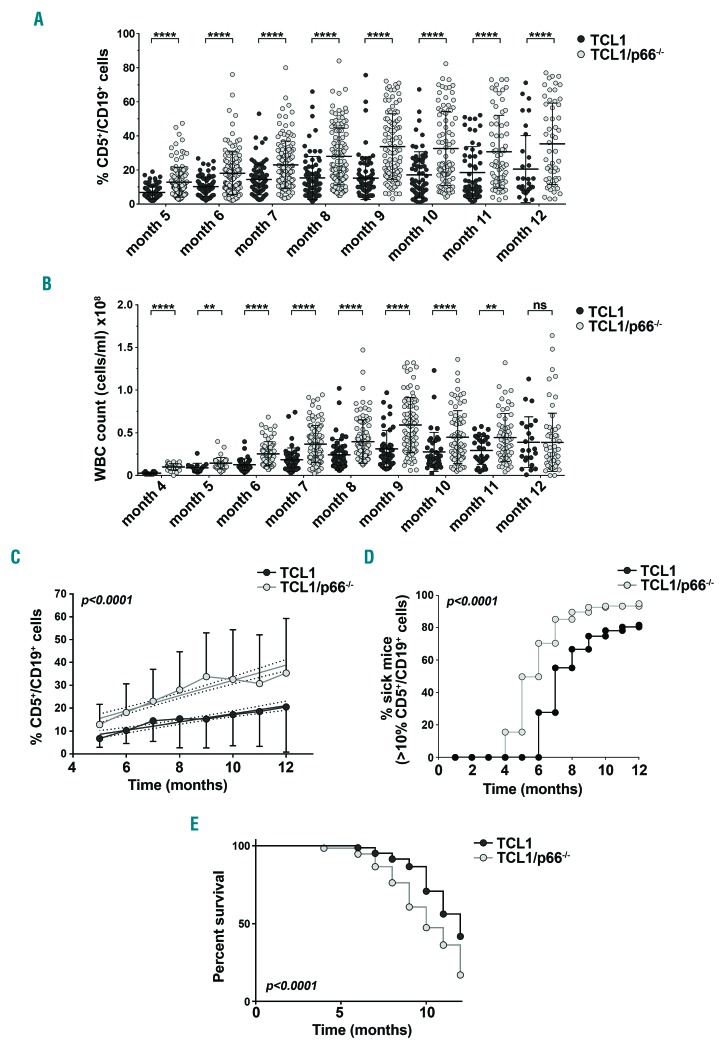
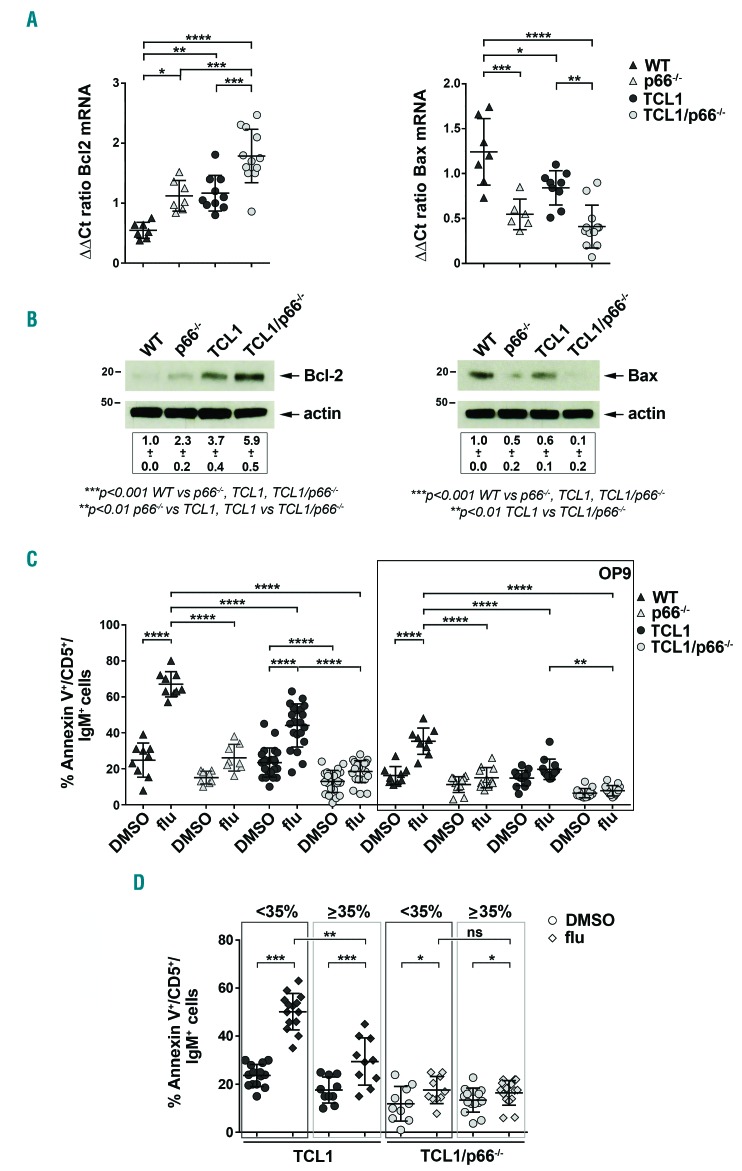
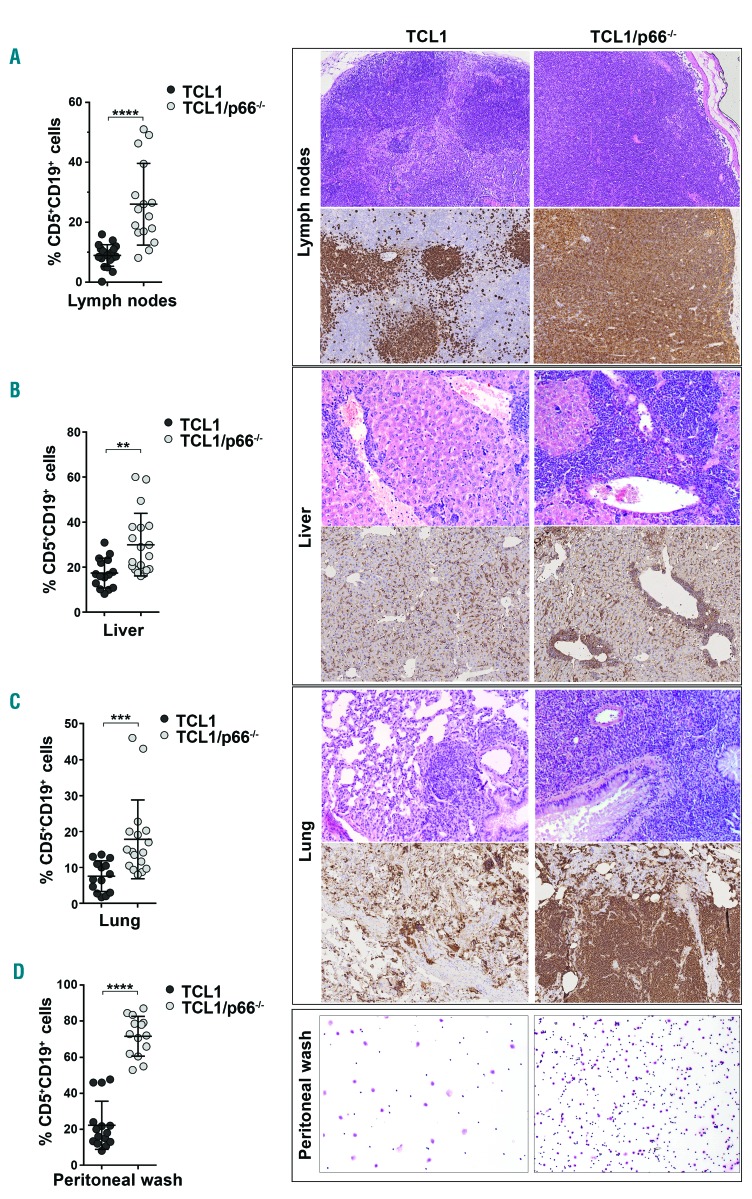
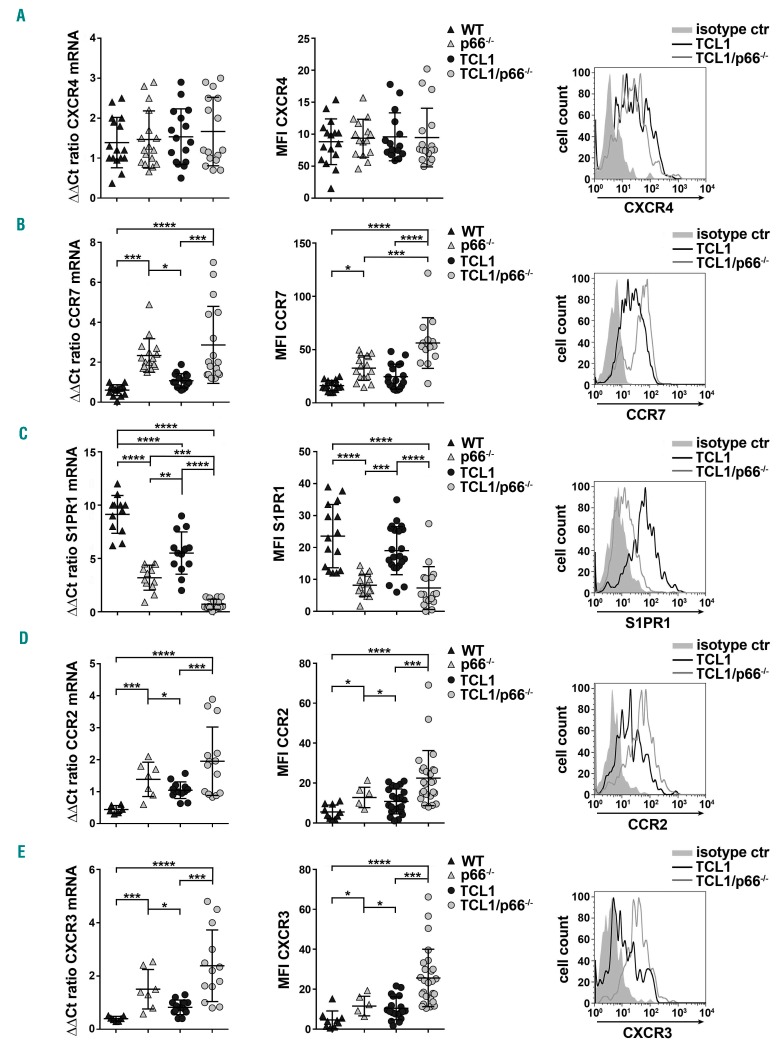
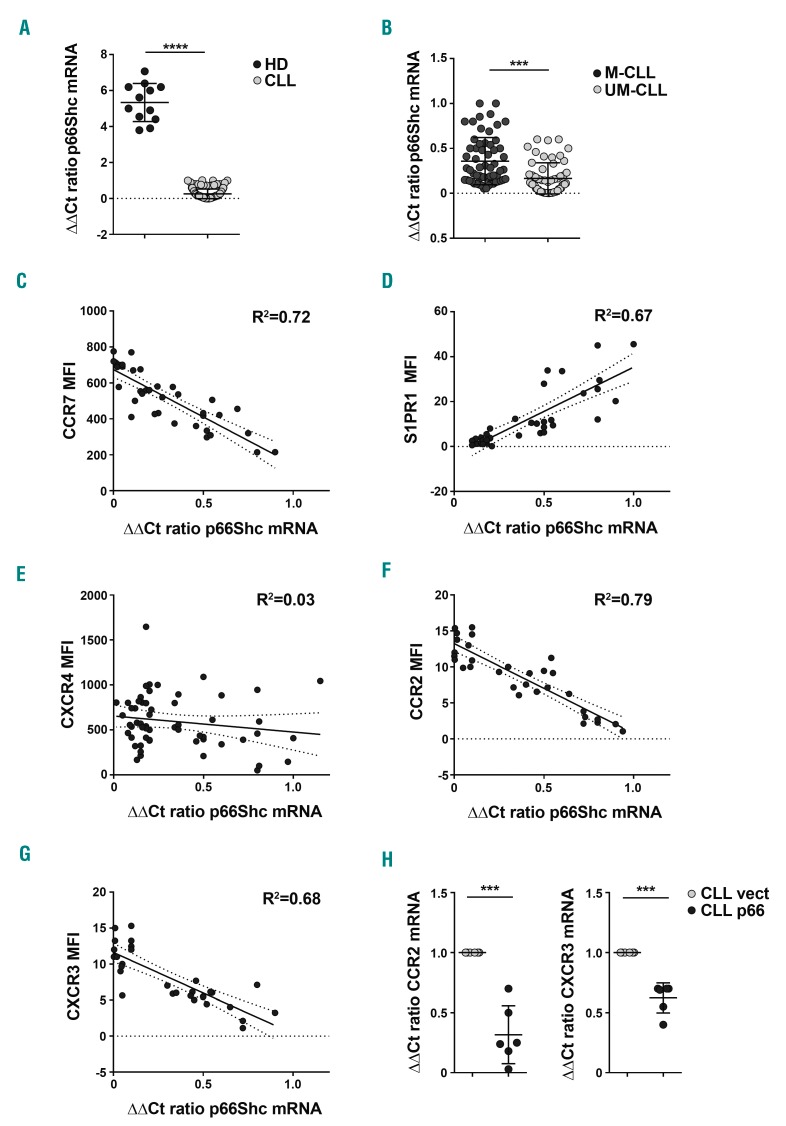
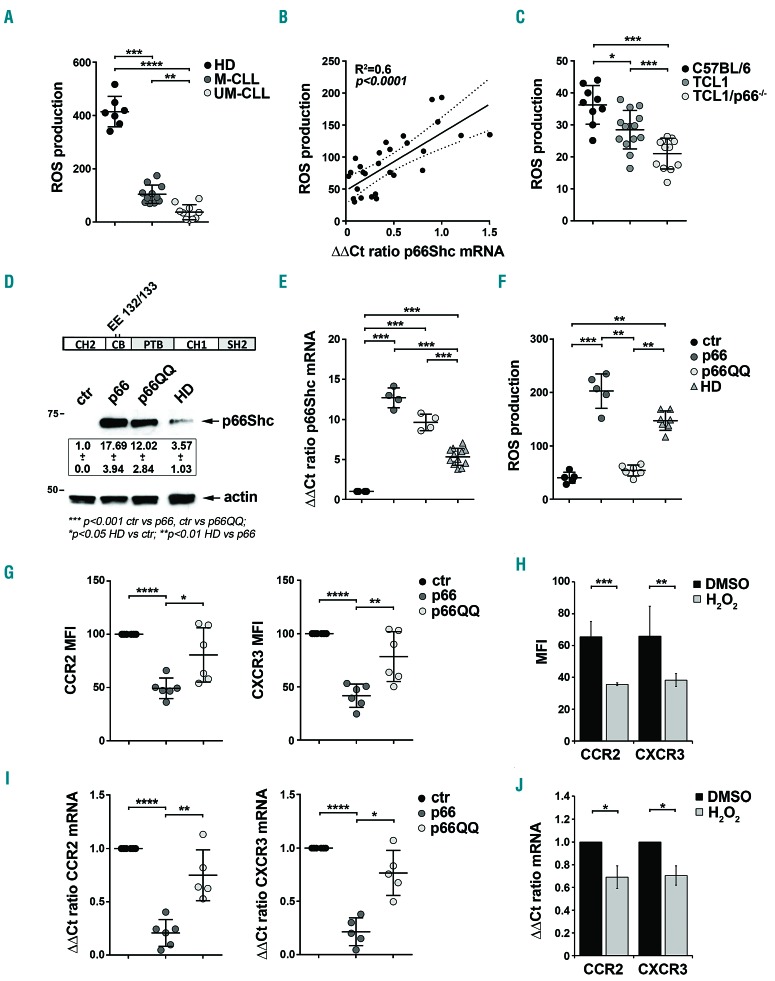
The Shc family adaptor p66Shc acts as a negative regulator of proliferative and survival signals triggered by the B-cell receptor and, by enhancing the production of reactive oxygen species, promotes oxidative stress-dependent apoptosis. Additionally, p66Shc controls the expression and function of chemokine receptors that regulate lymphocyte traffic. Chronic lymphocytic leukemia cells have a p66Shc expression defect which contributes to their extended survival and correlates with poor prognosis. We analyzed the impact of p66Shc ablation on disease severity and progression in the Eμ-TCL1 mouse model of chronic lymphocytic leukemia. We showed that Eμ-TCL1/p66Shc-/- mice developed an aggressive disease that had an earlier onset, occurred at a higher incidence and led to earlier death compared to that in Eμ-TCL1 mice. Eμ-TCL1/p66Shc-/- mice displayed substantial leukemic cell accumulation in both nodal and extranodal sites. The target organ selectivity correlated with upregulation of chemokine receptors whose ligands are expressed therein. This also applied to chronic lymphocytic leukemia cells, where chemokine receptor expression and extent of organ infiltration were found to correlate inversely with these cells' level of p66Shc expression. p66Shc expression declined with disease progression in Eμ-TCL1 mice and could be restored by treatment with the Bruton tyrosine kinase inhibitor ibrutinib. Our results highlight p66Shc deficiency as an important factor in the progression and severity of chronic lymphocytic leukemia and underscore p66Shc expression as a relevant therapeutic target.


Figures

Figure 1.
Figure 1.
p66Shc expression decreases during leukemia progression in tumoral cells from Eμ-TCL1 mice and can be restored by ibrutinib treatment. (A) Quantitative real-time polymerase chain reaction (qRT-PCR) analysis of p66Shc mRNA in B1a, B1b, B2 and total mature B lymphocytes purified from four wildtype (WT) mice and in leukemic cells purified from five Eμ-TCL1 sick mice. The relative gene transcript abundance was determined on triplicate samples using the DDCt method and normalized to GAPDH. (B, E). qRT-PCR analysis of p66Shc (B) and STAT4 (E) mRNA in B lymphocytes purified from five WT mice and in leukemic cells purified from Eμ-TCL1 mice with mild (~20% CD5+CD19+ cells in peripheral blood) (n=6) or overt leukemia (≥50% CD5+CD19+ cells and white cell count >10.7x10⁶/mL in peripheral blood) (n=5). The relative gene transcript abundance was determined on triplicate samples using the DDCt method. (C) Immunoblot analysis with anti-Shc and anti-STAT4 antibodies of postnuclear supernatants of leukemic cells purified from either WT (n=3) or Eμ-TCL1 mice with mild (n=3) or overt leukemia (n=3). The stripped filters were reprobed with anti-actin antibodies. (D) Correlation between the percentages of CD5+CD19+ cells and the mRNA levels of p66Shc in peripheral blood samples obtained from Eμ-TCL1 mice at different disease stages (n=12). (F) qRT-PCR analysis of p66Shc (left) and STAT4 (right) mRNA in leukemic cells purified from spleens of Eμ-TCL1 sick mice (n=4) incubated for 48 h with either dimethylsulfoxide (DMSO) (absolute cell viability: 88.4 ± 3.2% of annexin V/propidium iodide cells) or 1 μM ibrutinib (absolute cell viability: 84.9 ± 2.9% of annexin V/propidium iodide cells). The relative gene transcript abundance was determined on triplicate samples using the DDCt method. (G) Immunoblot analysis with anti-Shc and anti-STAT4 antibodies of postnuclear supernatants of leukemic cells purified from spleens of Eμ-TCL1 sick mice (n=3) incubated for 48 h with either DMSO or 1 μM ibrutinib. The stripped filters were reprobed with anti-actin antibodies. Mean ± standard deviation. One-way analysis of variance (ANOVA), multiple comparisons. ****P≤0.0001; ***P≤0.001; **P≤0.01; *P≤0.05
Figure 2.
Figure 2.
p66Shc deficiency accelerates leukemogenesis in Eμ-TCL1 mice. (A, B) Flow cytometric analysis of the percentages (A) and white blood cell (WBC) counts (B) of CD5+CD19+ cells in peripheral blood samples from either Eμ-TCL1 (n=87) or Eμ-TCL1/p66Shc−/−(n=134) mice collected at the indicated months. (C) Trend-lines calculated on the monthly average percentages of CD5+CD19+ cells in the Eμ-TCL1 and Eμ-TCL1/p66Shc−/−mice shown in (A). (D) Analysis of the percentages of sick mice, calculated as the percentage of mice with ≥10% CD5+CD19+ cells, calculated on the percentages of CD5+CD19+ cells shown in (A). (E) Log-rank survival analysis of the Eμ-TCL1 or Eμ-TCL1/p66Shc−/− mice shown in (A). Mean ± standard deviation. Mann-Whitney rank sum test. ****P≤0.0001; ***P≤0.001; **P≤0.01; ns: not significant.
Figure 3.
Figure 3.
p66Shc deficiency in leukemic cells results in enhanced chemoresistance. (A) Quantitative real-time polymerase chain reaction analysis of Bcl-2 and Bax mRNA in leukemic cells purified from either wildtype (WT) (n=7) or p66Shc−/− (n=7) mice and from Eμ-TCL1 (n=10) or Eμ-TCL1/p66Shc−/− (n=12) mice with overt leukemia. The relative gene transcript abundance was determined on triplicate samples using the DDCt method. (B) Immunoblot analysis with anti-Bcl-2 (left) and anti-Bax (right) antibodies of postnuclear supernatants of leukemic cells purified from either WT (n=3) or p66Shc−/− (n=3) mice and from Eμ-TCL1 (n=3) or Eμ-TCL1/p66Shc−/−(n=3) mice with overt leukemia. The stripped filters were reprobed with anti-actin antibodies. (C) Flow cytometric analysis of the percentages of annexin V+CD5+IgM+ cells in peripheral blood from either WT (n=9) or p66Shc−/− (n=8) mice and from Eμ-TCL1 (n=20) or Eμ-TCL1/p66Shc−/− (n=22) mice. Samples were treated with either dimethylsulfoxide (DMSO) or 35 μM fludarabine (flu) for 16 h at 37°C. (D) Flow cytometric analysis of the percentages of annexin V+CD5+IgM+ cells in peripheral blood from either Eμ-TCL1 (n=20) or Eμ-TCL1/p66Shc−/− (n=22) mice with <35% (black boxes) or ≥35% (gray boxes) CD5+CD19+ leukemic cells in peripheral blood, treated with either DMSO or 35 μM fludarabine for 16 h at 37°C. Mean ± standard deviation. One-way analysis of variance (ANOVA), multiple comparisons. ****P≤0.0001; ***P≤0.001; **P≤0.01; *P≤0.05
Figure 4.
Figure 4.
Nodal and extranodal accumulation of leukemic cells lacking p66Shc. (A-D) (Left) Flow cytometric analysis of the percentages of CD5+CD19+ cells in lymph nodes (A), liver (B), lung (C) and peritoneal wash (D) from either Eμ-TCL1 (n=15) or Eμ-TCL1/p66Shc−/− (n=15) mice with overt leukemia. (Right) Hematoxylin & eosin staining (upper panels) and immunohistochemical analysis of B220 (lower panels) in lymph nodes (A), liver (B), lung (C) and peritoneal wash (D) from either Eμ-TCL1 (n=5) or Eμ-TCL1/p66Shc−/− (n=10) with overt leukemia. (Immunoperoxidase staining; original magnification, 5x, 10x and 20x). Mean ± standard deviation. Mann-Whitney rank sum test. ****P≤0.0001; ***P≤0.001; **P≤0.01.
Figure 5.
Figure 5.
p66Shc deficiency in leukemic cells results in enhanced expression of homing receptors and reduced expression of the egress receptor S1PR1. (A-E) Quantitative real-time polymerase chain reaction analysis of the mRNA levels (left) and flow cytometric analysis of surface expression (right) of CXCR4 (A), CCR7 (B), S1PR1 (C), CCR2 (D) and CXCR3 (E) in CD5+CD19+ cells purified from either wildtype (WT) (n=16) or p66Shc−/− (n=15) mice (B1a cells) and from Eμ-TCL1 (n≥16) or Eμ-TCL1/p66Shc−/− (n≥16) mice with overt leukemia. The relative gene transcript abundance was determined on triplicate samples using the DDCt method. Representative flow cytometric plots of the indicated stains are shown on the right. Chemotaxis toward the respective chemokines is shown in Online Supplementary Figure S6. Mean ± standard deviation. One-way analysis of variance (ANOVA), multiple comparisons. ****P≤0.0001; ***P≤0.001; **P≤0.01; *P≤0.05.
Figure 6.
Figure 6.
p66Shc deficiency is associated with abnormal expression of chemokine receptors and lymphadenopathy in human chronic lymphocytic leukemia. (A, B) Quantitative real-time polymerase chain reaction (qRT-PCR) analysis of p66Shc mRNA in B cells purified from either healthy donors (HD) (n=12) or patients with chronic lymphocytic leukemia (CLL) (n=157) (A), or B cells purified from CLL patients, grouped into those with mutated CLL (M-CLL) (n=67) or unmutated CLL (UM-CLL) (n=64) (B). (C-G) Correlation between mRNA levels of p66Shc and surface expression levels of CCR7 (C), S1PR1 (D), CXCR4 (E), CCR2 (F) and CXCR3 (G) in B cells purified from CLL patients (n≤89). (H) qRT-PCR analysis of CCR2 (left) and CXCR3 (right) mRNA in purified CLL B cells (n=6), nucleofected with either empty vector (CLL vect) or an expression construct encoding p66Shc (CLL p66). The relative gene transcript abundance was determined on triplicate samples using the DDCt method. Mean ± standard deviation. Mann-Whitney rank sum test. ***P≤0.001” to “****P≤0.0001; ***P≤0.001”.
Figure 7.
Figure 7.
The pro-oxidant activity of p66Shc modulates CCR2 and CXCR3 expression. (A, C) Flow cytometric analysis of reactive oxygen species (ROS) production in B cells purified from either healthy donors (HD, n=7) or patients with chronic lymphocytic leukemia (CLL) grouped according to whether they had mutated CLL (M-CLL) (n=11) or unmutated CLL (UM-CLL) (n=9) (A) and in B1a cells from wildtype (C57BL/6, n=9) mice and from Eμ-TCL1 (n=13) or Eμ-TCL1/p66Shc−/− (n=12) sick mice (C), loaded with CM-H2DCFDA. Data refer to duplicate samples from each patient/donor/mouse. (B) Correlation between mRNA levels of p66Shc and ROS production in B cells purified from CLL patients (n=28). (D, E) Immunoblot analysis of Shc expression (D) and quantitative real-time polymerase chain reaction (qRT-PCR) analysis of p66Shc mRNA (E) in MEC1 B cells stably transfected with empty vector (ctr) or an expression construct encoding either wildtype p66Shc (p66) or the EE132/133QQ (p66QQ) mutant, and in B cells purified from healthy donors (HD) (n=3). A control anti-actin blot of the stripped filter is shown below. The migration of molecular mass markers is indicated. The domain structure of p66Shc showing the localization of the amino acid residues substituted in the mutants is schematized at the top of the panel. (F) Flow cytometric analysis of ROS production in the MEC1 B-cell transfectants and in B cells purified from healthy donors (B cell, n=5) loaded with CM-H2DCFDA. Data refer to duplicate samples from five independent experiments. (G, I). Flow cytometric analysis (G) and qRT-PCR analysis of the mRNA levels (I) of CCR2 (left) and CXCR3 (right) in MEC1 transfectants. Data refer to duplicate samples from five independent experiments. (H, J). Flow cytometric analysis (H) and qRT-PCR analysis of the mRNA levels (J) of CCR2 and CXCR3 in MEC1 cells treated for 24 h with either dimethylsulfoxide (DMSO) or 50 μM H2O2. Data refer to duplicate samples from four independent experiments. The relative gene transcript abundance was determined on triplicate samples using the ΔΔCt method. Mean ± standard deviation. Mann-Whitney rank sum test. ****P≤0.0001; ***P≤0.001**P≤0.01; *P≤0.05. MFI: mean fluorescence intensity.

Comment in

Similar articles

Cited by

References

    1. Dighiero G, Hamblin TJ. Chronic lymphocytic leukaemia. Lancet. 2008;371(9617): 1017–1029. - PubMed
    1. Ortiz-Maldonado V, Mozas P, Delgado J. The biology behind B-cell lymphoma 2 as a target in chronic lymphocytic leukemia. Ther Adv Hematol. 2016;7(6):321–329. - PMC - PubMed
    1. Burger JA. Nurture versus nature: the microenvironment in chronic lymphocytic leukemia. Hematol Am Soc Hematol Educ Progr. 2011;2011(1):96–103. - PubMed
    1. Giorgio M, Migliaccio E, Orsini F, et al. Electron transfer between cytochrome c and p66Shc generates reactive oxygen species that trigger mitochondrial apoptosis. Cell. 2005;122(2):221–233. - PubMed
    1. Finetti F, Savino MT, Baldari CT. Positive and negative regulation of antigen receptor signaling by the Shc family of protein adapters. Immunol Rev. 2009;232(1):115–134. - PubMed

Publication types

MeSH terms

Substances

LinkOut - more resources