

Senescence-accelerated mice (SAMP1/TA-1) treated repeatedly with lipopolysaccharide develop a condition that resembles hemophagocytic lymphohistiocytosis
- PMID: 30819910
- PMCID: PMC6886438
- DOI: 10.3324/haematol.2018.209551
Senescence-accelerated mice (SAMP1/TA-1) treated repeatedly with lipopolysaccharide develop a condition that resembles hemophagocytic lymphohistiocytosis
Abstract
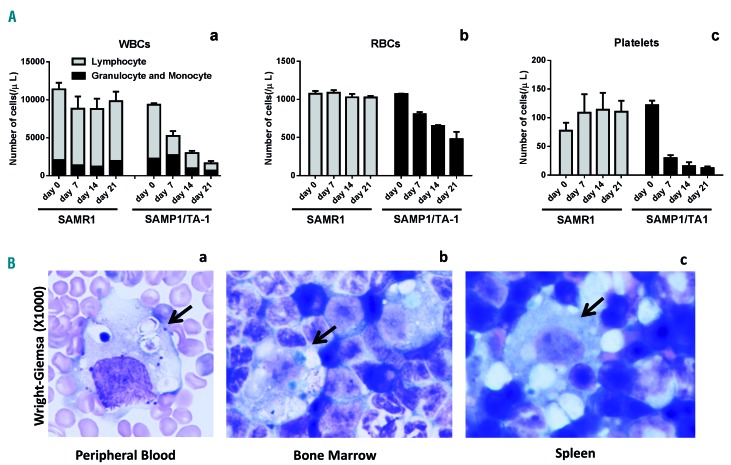
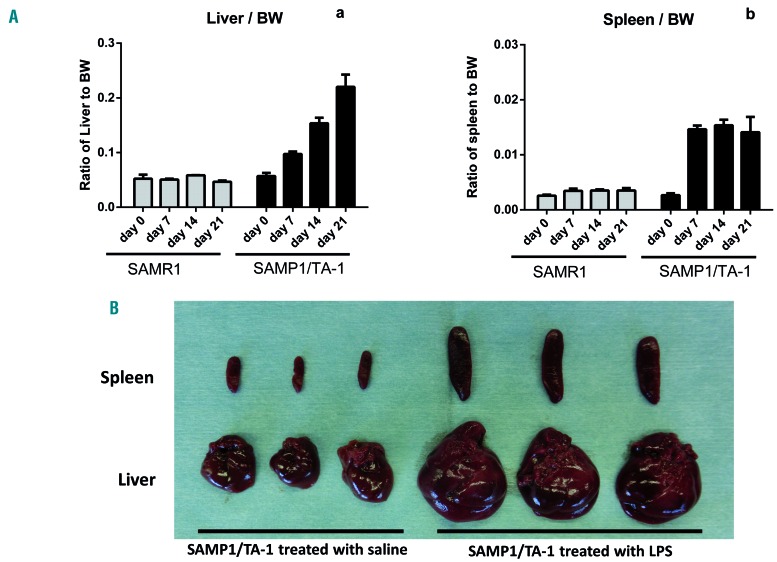
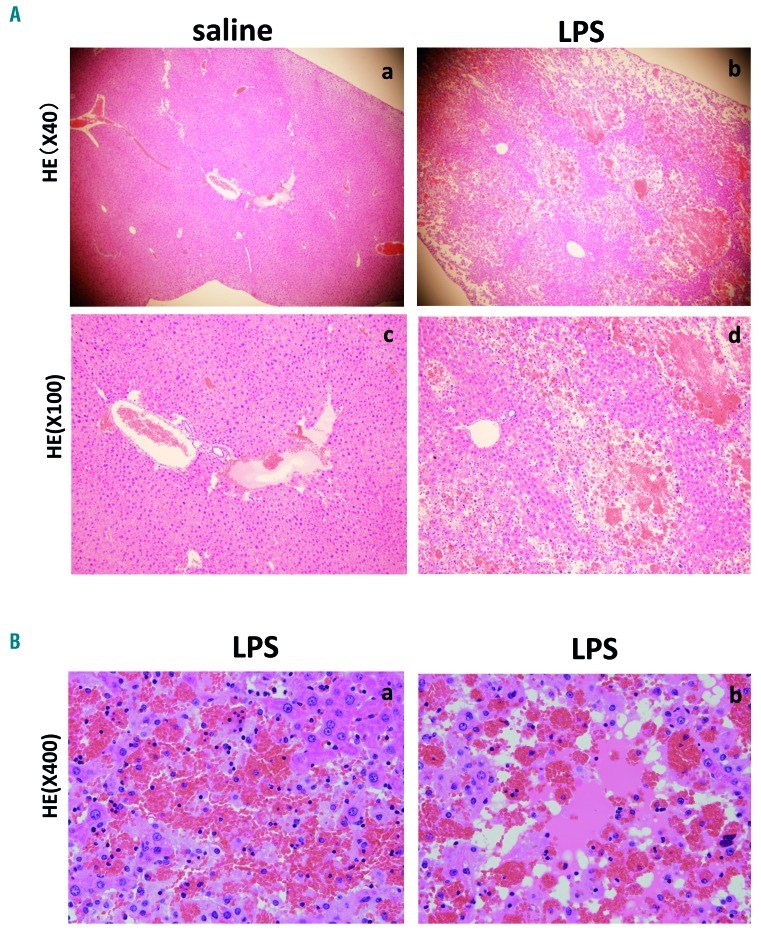
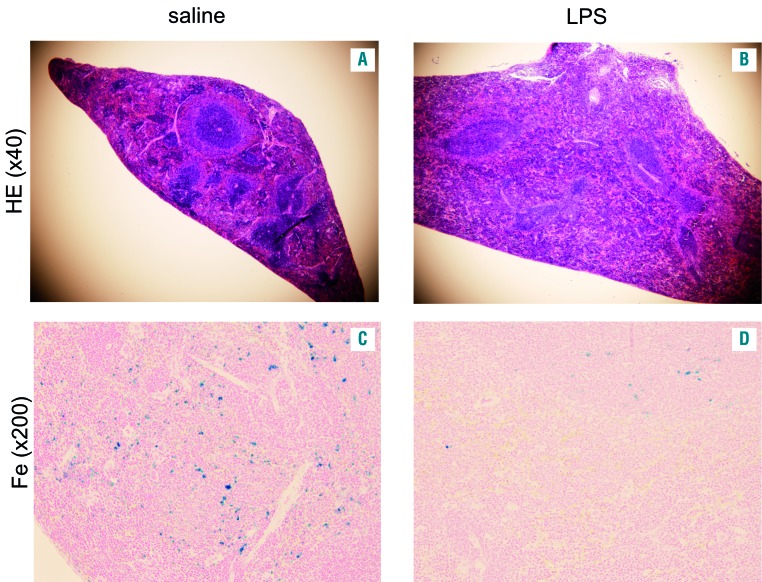
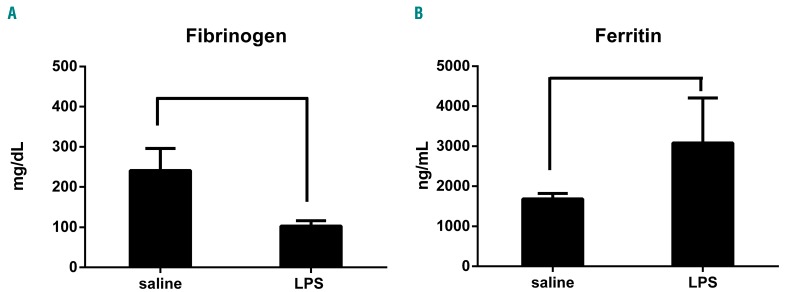
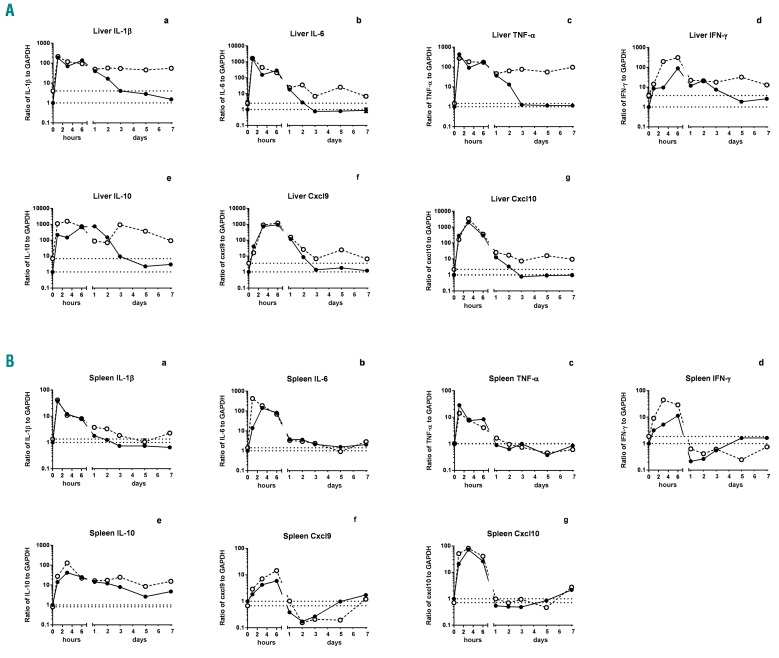
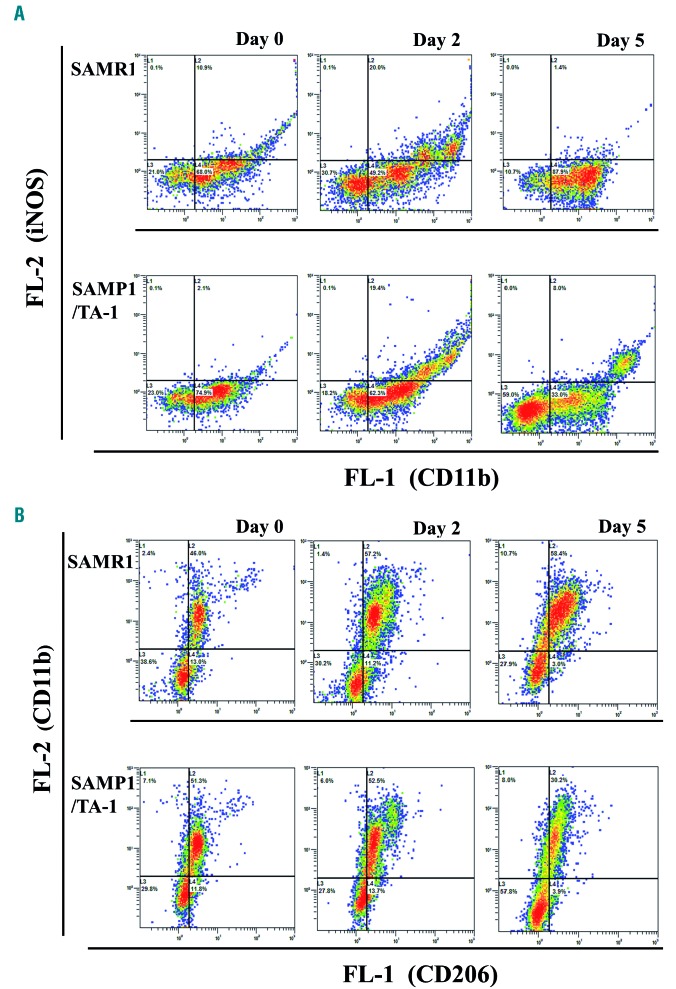
Hemophagocytic lymphohistiocytosis is a life-threatening systemic hyperinflammatory disorder with primary and secondary forms. Primary hemophagocytic lymphohistiocytosis is associated with inherited defects in various genes that affect the immunological cytolytic pathway. Secondary hemophagocytic lymphohistiocytosis is not inherited, but complicates various medical conditions including infections, autoinflammatory/autoimmune diseases, and malignancies. When senescence-accelerated mice (SAMP1/TA-1) with latent deterioration of immunological function and senescence-resistant control mice (SAMR1) were treated repeatedly with lipopolysaccharide, SAMP1/TA-1 mice displayed the clinicopathological features of hemophagocytic lymphohistiocytosis such as hepatosplenomegaly, pancytopenia, hypofibrinogenemia, hyperferritinemia, and hemophagocytosis. SAMR1 mice showed no features of hemophagocytic lymphohistiocytosis. Lipopolysaccharide induced upregulation of proinflammatory cytokines such as interleukin-1β, interleukin-6, tumor necrosis factor-α, and interferon-γ, and interferon-γ-inducible chemokines such as c-x-c motif chemokine ligands 9 and 10 in the liver and spleen in both SAMP1/TA-1 and SAMR1 mice. However, upregulation of proinflammatory cytokines and interferon-γ-inducible chemokines in the liver persisted for longer in SAMP1/TA-1 mice than in SAMR1 mice. In addition, the magnitude of upregulation of interferon-γ in the liver and spleen after lipopolysaccharide treatment was greater in SAMP1/TA-1 mice than in SAMR1 mice. Furthermore, lipopolysaccharide treatment led to a prolonged increase in the proportion of peritoneal M1 macrophages and simultaneously to a decrease in the proportion of M2 macrophages in SAMP1/TA-1 mice compared with SAMR1 mice. Lipopolysaccharide appeared to induce a hyperinflammatory reaction and prolonged inflammation in SAMP1/TA-1 mice, resulting in features of secondary hemophagocytic lymphohistiocytosis. Thus, SAMP1/TA-1 mice represent a useful mouse model to investigate the pathogenesis of bacterial infection-associated secondary hemophagocytic lymphohistiocytosis.
Copyright© 2019 Ferrata Storti Foundation.
Figures
Similar articles
-
Macrophage depletion using clodronate liposomes reveals latent dysfunction of the hematopoietic microenvironment associated with persistently imbalanced M1/M2 macrophage polarization in a mouse model of hemophagocytic lymphohistiocytosis.Ann Hematol. 2023 Dec;102(12):3311-3323. doi: 10.1007/s00277-023-05425-w. Epub 2023 Sep 1. Ann Hematol. 2023. PMID: 37656190
-
Imbalanced M1 and M2 Macrophage Polarization in Bone Marrow Provokes Impairment of the Hematopoietic Microenvironment in a Mouse Model of Hemophagocytic Lymphohistiocytosis.Biol Pharm Bull. 2022;45(11):1602-1608. doi: 10.1248/bpb.b22-00108. Biol Pharm Bull. 2022. PMID: 36328495
-
Dynamics of hematopoiesis is disrupted by impaired hematopoietic microenvironment in a mouse model of hemophagocytic lymphohistiocytosis.Ann Hematol. 2020 Jul;99(7):1515-1523. doi: 10.1007/s00277-020-04095-2. Epub 2020 Jun 6. Ann Hematol. 2020. PMID: 32506245
-
[CME: Acquired Hemophagocytic Lymphohistiocytosis].Praxis (Bern 1994). 2018 Aug;107(16):873-881. doi: 10.1024/1661-8157/a003040. Praxis (Bern 1994). 2018. PMID: 30086677 Review. German.
-
Hemophagocytic syndrome: primary forms and predisposing conditions.Curr Opin Immunol. 2017 Dec;49:20-26. doi: 10.1016/j.coi.2017.08.004. Epub 2017 Sep 1. Curr Opin Immunol. 2017. PMID: 28866302 Review.
Cited by
-
NR4A2 may be a potential diagnostic biomarker for myocardial infarction: A comprehensive bioinformatics analysis and experimental validation.Front Immunol. 2022 Dec 22;13:1061800. doi: 10.3389/fimmu.2022.1061800. eCollection 2022. Front Immunol. 2022. PMID: 36618351 Free PMC article.
-
Macrophage depletion using clodronate liposomes reveals latent dysfunction of the hematopoietic microenvironment associated with persistently imbalanced M1/M2 macrophage polarization in a mouse model of hemophagocytic lymphohistiocytosis.Ann Hematol. 2023 Dec;102(12):3311-3323. doi: 10.1007/s00277-023-05425-w. Epub 2023 Sep 1. Ann Hematol. 2023. PMID: 37656190
-
Murine Models of Secondary Cytokine Storm Syndromes.Adv Exp Med Biol. 2024;1448:497-522. doi: 10.1007/978-3-031-59815-9_34. Adv Exp Med Biol. 2024. PMID: 39117836 Review.
-
Causal associations of immune cells with benign prostatic hyperplasia: insights from a Mendelian randomization study.World J Urol. 2024 Apr 6;42(1):216. doi: 10.1007/s00345-024-04913-6. World J Urol. 2024. PMID: 38581575
-
Harnessing stem cell therapeutics in LPS-induced animal models: mechanisms, efficacies, and future directions.Stem Cell Res Ther. 2025 Apr 12;16(1):176. doi: 10.1186/s13287-025-04290-w. Stem Cell Res Ther. 2025. PMID: 40221751 Free PMC article. Review.
References
-
- Henter JI, Horne A, Aricó M, et al. HLH-2004: diagnostic and therapeutic guideline for hemophagocytic lymphohistiocytosis. Pediatr Blood Cancer. 2007;48(2):124-131. - PubMed
-
- Janka GE. Familial and acquired hemphagohistiocytosis. Annu Rev Med. 2012;(63):233-246. - PubMed
-
- Créput C, Galicier L, Buyse S, Azoulay E. Understanding organ dysfunction in hemophagocytic lymphohistiocytosis. Intensive Care Med. 2008;34(7):1177-1187. - PubMed
-
- Stepp SE, Dufourcq-Lagelouse R, Le Deist F, et al. Perforin gene defects in familial hemophagocytic lymphohistiocytosis. Science. 1999;286(5446):1957-1959. - PubMed
-
- Voskoboinik I, Smyth MJ, Trapani JA. Perforin-mediated target-cell death and immune homeostasis. Nat Rev Immunol. 2006;6(12):940-952. - PubMed
Publication types
MeSH terms
Substances
LinkOut - more resources
Full Text Sources
Medical
