Observational Study
. 2019 Mar 1;363(6430):eaau0780.
doi: 10.1126/science.aau0780.

Binodal, wireless epidermal electronic systems with in-sensor analytics for neonatal intensive care

Affiliations
Observational Study

Binodal, wireless epidermal electronic systems with in-sensor analytics for neonatal intensive care

Ha Uk Chung et al. Science. .

Abstract

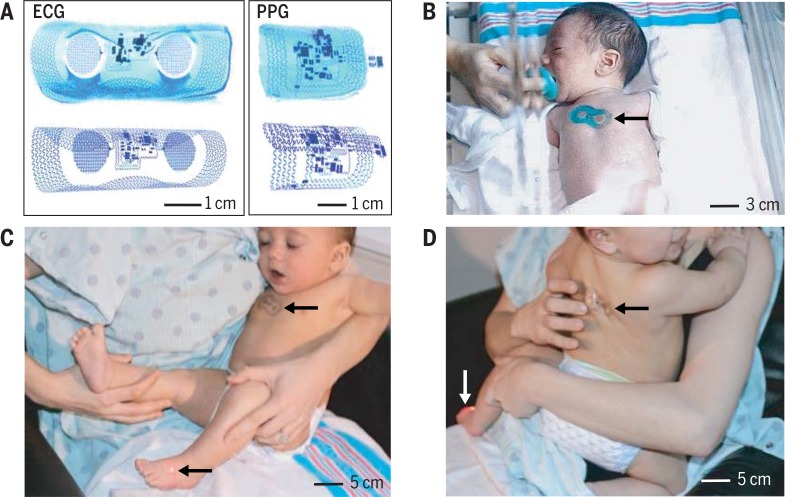
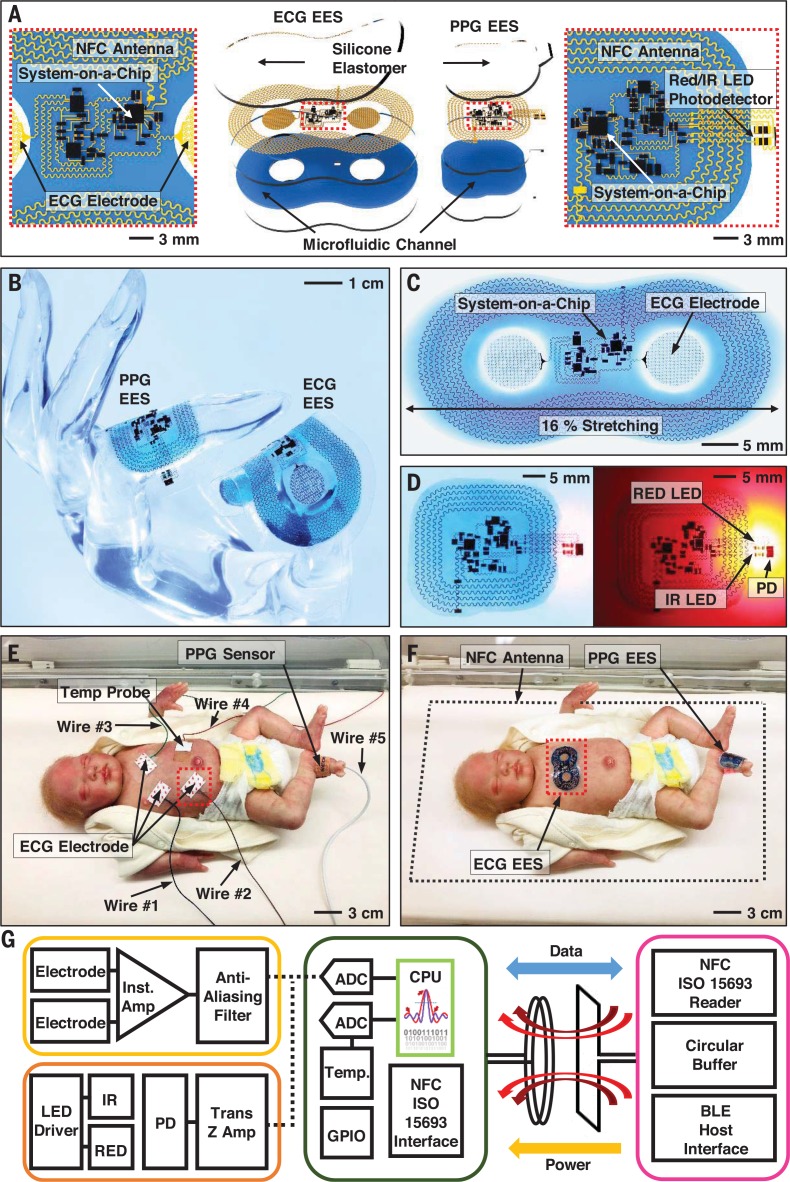
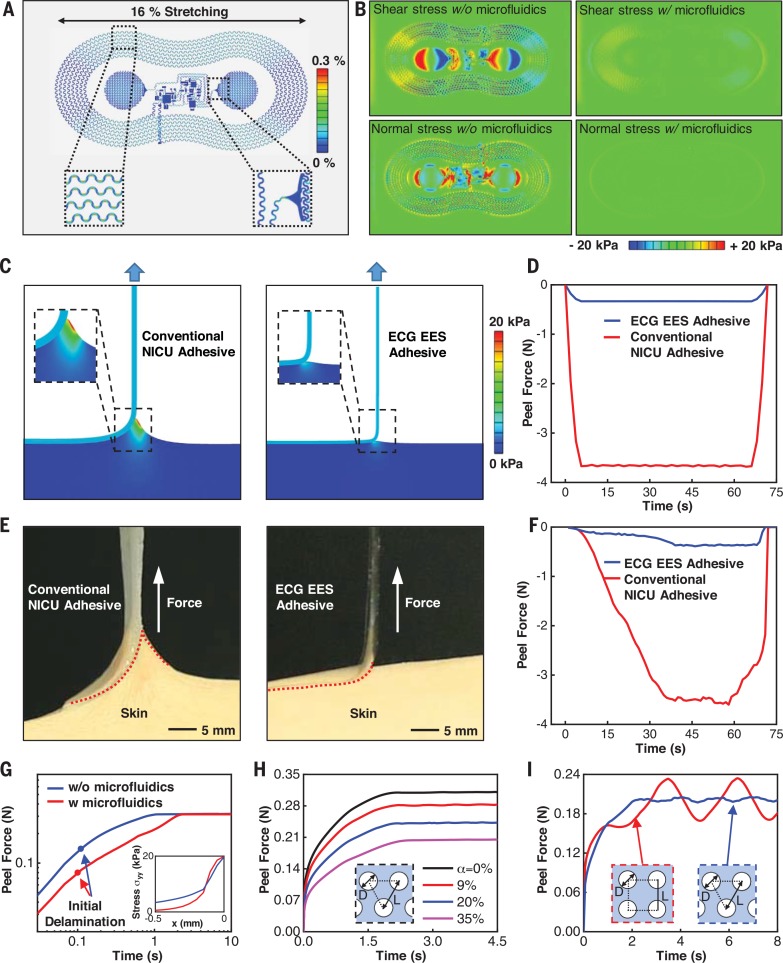
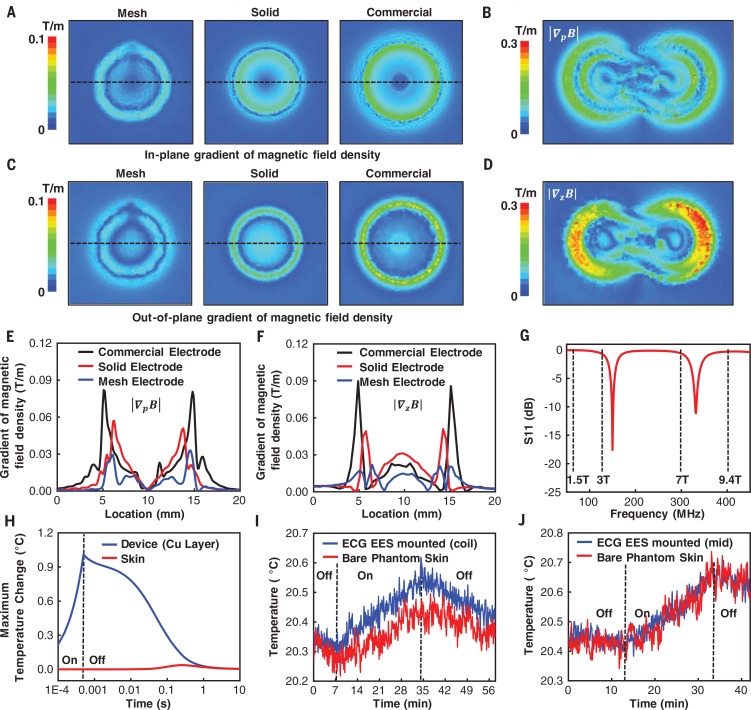
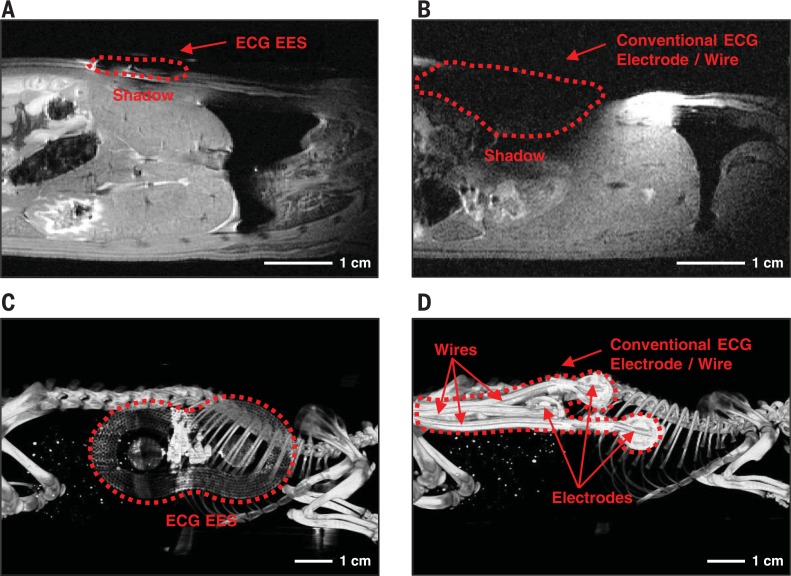
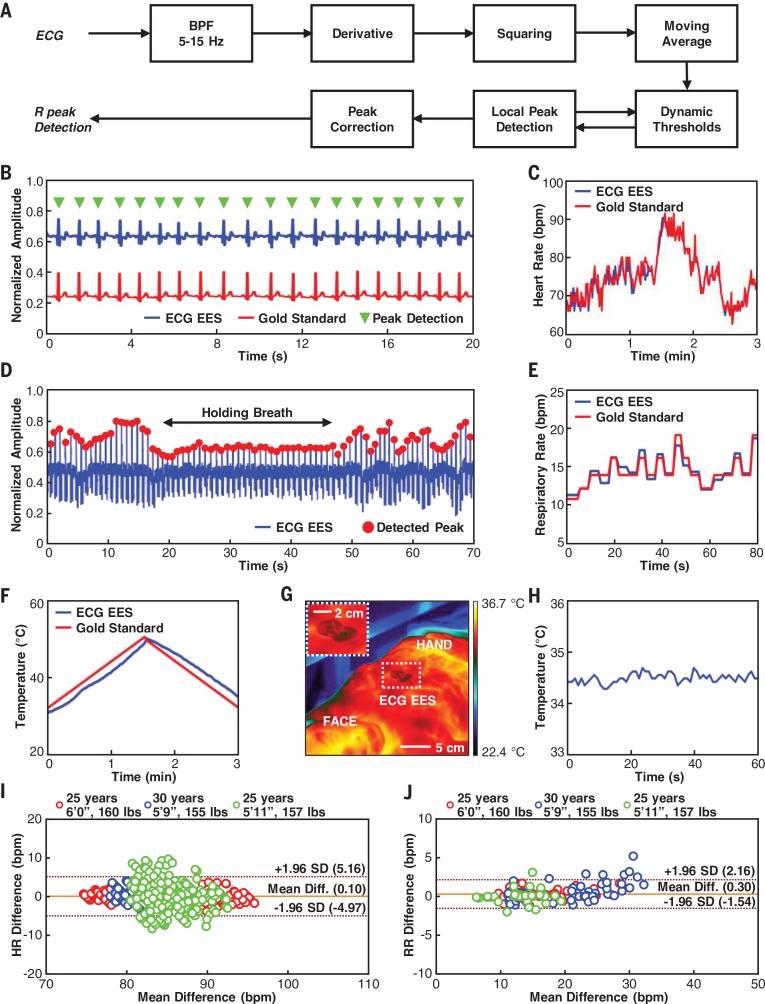
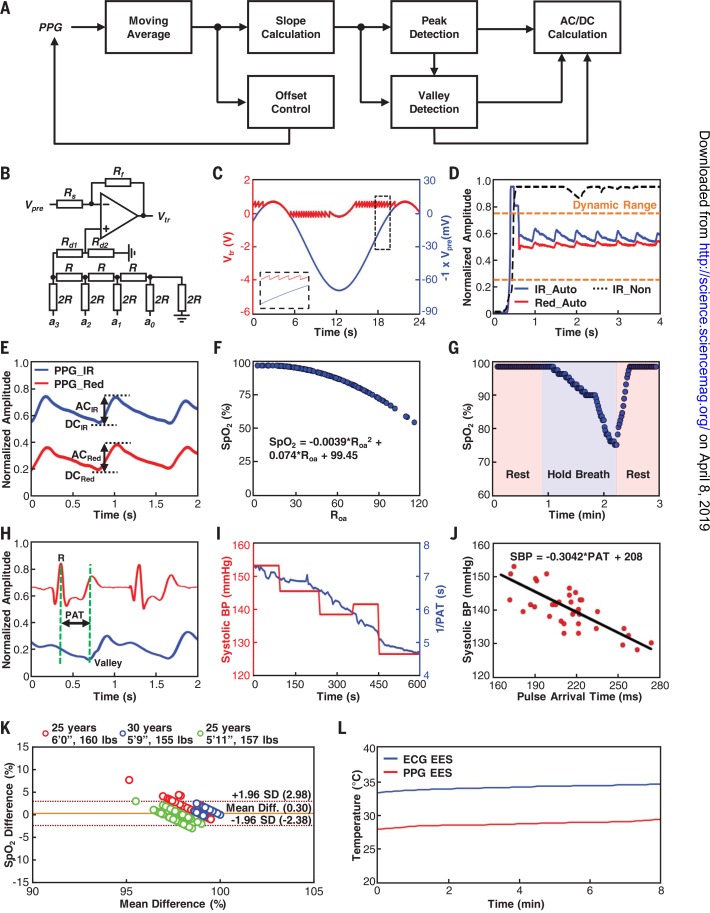
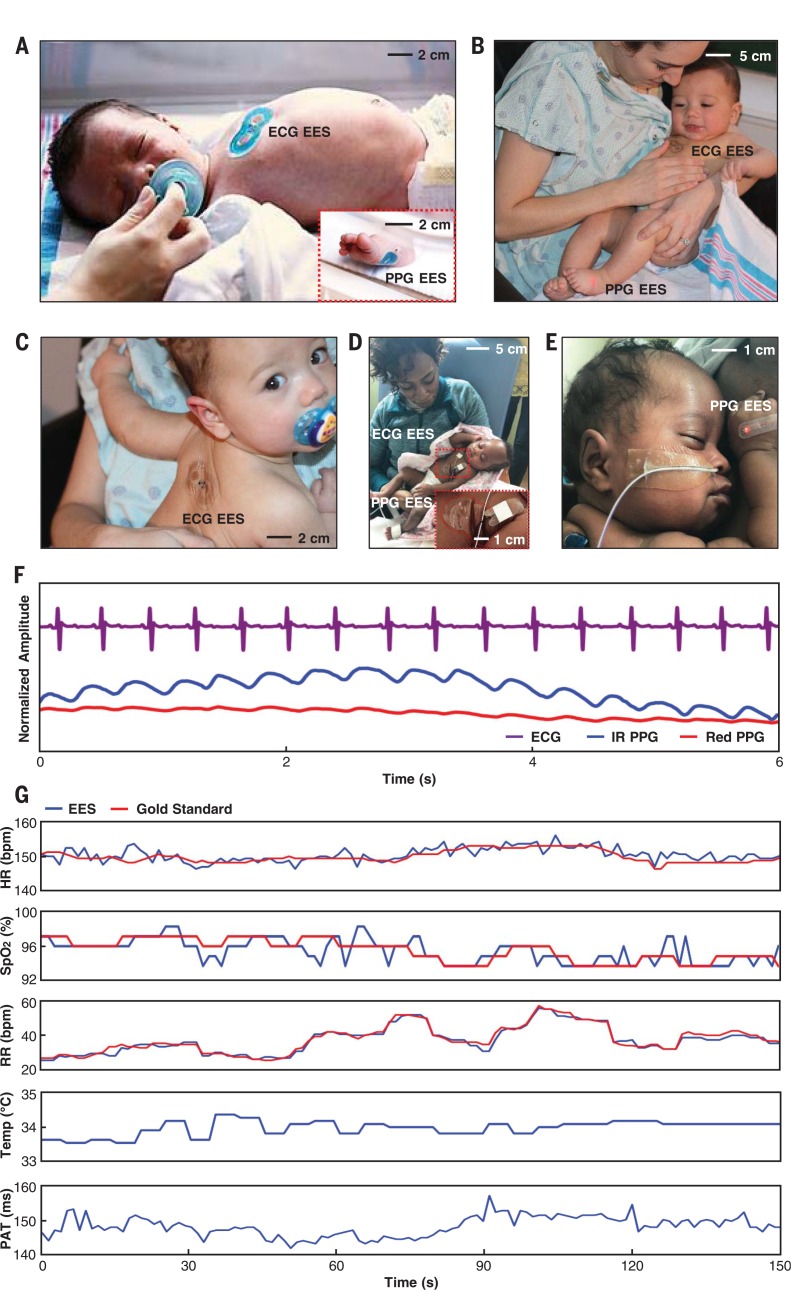
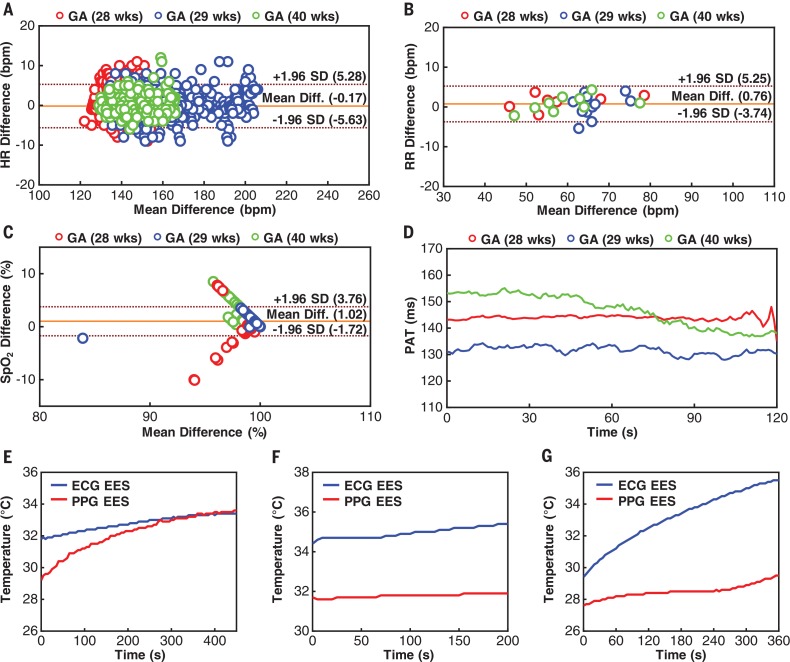
Existing vital sign monitoring systems in the neonatal intensive care unit (NICU) require multiple wires connected to rigid sensors with strongly adherent interfaces to the skin. We introduce a pair of ultrathin, soft, skin-like electronic devices whose coordinated, wireless operation reproduces the functionality of these traditional technologies but bypasses their intrinsic limitations. The enabling advances in engineering science include designs that support wireless, battery-free operation; real-time, in-sensor data analytics; time-synchronized, continuous data streaming; soft mechanics and gentle adhesive interfaces to the skin; and compatibility with visual inspection and with medical imaging techniques used in the NICU. Preliminary studies on neonates admitted to operating NICUs demonstrate performance comparable to the most advanced clinical-standard monitoring systems.


Conflict of interest statement

H.U.C., B.H.K., J.Y.L., J.L., K.L., S.X., and J.A.R. are inventors on a patent application (U.S. 62/753,303) submitted by Northwestern University and the University of Illinois. H.U.C., S.X., and J.A.R. declare equity ownership in a company that is pursuing commercialization of the technology described here. J.A.R. also declares an advisory role with this company.

Figures

None
Wireless, skin-like systems for vital signs monitoring in neonatal intensive care. (A) Images and finite-element modeling results for ECG and PPG devices bent around glass cylinders. (B) A neonate with an ECG device on the chest. (C and D) A mother holding her infant with a PPG device on the foot and an ECG device on the chest (C) and on the back (D).
Fig. 1
Fig. 1
Schematic illustrations and photographic images of ultrathin, skin-like wireless modules for full vital signs monitoring in the neonatal intensive care unit (NICU) with comparisons to clinical-standard instrumentation. (A) Schematic illustration of wireless, battery-free modules for recording electrocardiogram (ECG) and photoplethysmogram (PPG) data and skin temperature. The ionic liquid in the microfluidic channel contains blue dye for visualization purposes. (B) Images of devices draped over the fingers of a life-sized, transparent mannequin hand to illustrate the sizes and physical form factors of these devices. (C) Image of an ECG EES stretched uniaxially in the horizontal direction by ~16%. (D) Device for capturing PPG data during operation in a lighted and a dark room. PD, photodiode. (E and F) NICU setting with a life-sized neonate doll configured with conventional measurement hardware (E) and with a binodal (chest and foot) deployment of skin-like wireless devices designed to provide the same functionality and measurement fidelity (F). (G) Functional block diagram showing analog front end of each EES, components of the NFC SoC including microcontroller, GPIO, and radio interface, with a host reader platform that includes an NFC reader module and a BLE interface with circular buffer.
Fig. 2
Fig. 2
Fundamental aspects of mechanical stresses and soft adhesion at the interface with the skin. (A) Simulation results for the deformed geometry and distribution of strain in the copper layer of an ECG EES during uniaxial stretch (~16%). (B) Simulation results for the distribution of shear and normal stresses at the interface between an ECG EES and underlying skin during deformation for devices without (left) and with (right) the microfluidic channel. Stresses in the latter case are less than ~20 kPa, the threshold of skin sensation. (C) Simulation results for the distribution of von Mises stress on the skin due to peeling of a conventional NICU adhesive (left) and the ECG EES adhesive (right). (D) Simulation result for the time dependence of the peel force during removal of a conventional NICU adhesive and the ECG EES adhesive from the skin. (E) Images that highlight experimental studies of peeling of a conventional NICU adhesive (left) and the ECG EES adhesive (right) from the skin of a healthy adult. (F) Experimental measurement of the time dependence of the peel force during removal of a conventional NICU adhesive and the ECG EES adhesive from the skin. (G) Simulation results that highlight the role of the microfluidic channel in the peel force associated with removal of an ECG EES from the skin, with emphasis on the initial, non–steady-state regime during peel initiation. The circles denote the instants of initial delamination, when the interfacial cohesive strength is reached. The inset shows the normal stress distribution, ᵟyy, along the interface at the instant of initial delamination, where its peak is the cohesive strength. (H) The computed peel force as a function of time for an EES adhesive with a triangular pattern of small holes (diameter D = 200 µm) on the skin.The hole area fraction 3πD2/6L2.(I) The computed peel force as a function of time for triangular and square patterns of large holes (diameter D = 1 mm) with the hole area fraction a = 35%, where α = πD2 /4L2 and 3πD2/6L2 for square and triangular patterns, respectively.
Fig. 3
Fig. 3
Theoretical and experimental aspects of radiolucency. (A) Computational results for the distributions of the in-plane gradient of the magnetic field density associated with a mesh electrode as in Fig. 1A (left), a solid electrode (no mesh; center), and a commercial NICU electrode (right) for conditions associated with an MRI scan at 128 MHz. (B) Calculated in-plane gradients of the magnetic field density associated with a complete ECG EES at 128 MHz. (C) Distributions of the out-ofplane gradient of the magnetic field density associated with a mesh electrode, a solid electrode, and a commercial NICU electrode for conditions associated with an MRI scan at 128 MHz. (D) The out-of-plane gradients of magnetic field density induced on the ECG EES at 128 MHz. (E) The in-plane gradient of the magnetic field density evaluated along the horizontal dashed lines in (A). (F) The out-of-plane gradient of the magnetic field density along the horizontal dashed lines in (C). (G) S11 parameter of the ECG EEG as a function of frequency. The vertical dashed lines indicate operating frequencies of 1.5-T, 3-T, 7-T, and 9.4-T MRI scanners at 64 MHz, 128 MHz, 298 MHz, and 400 MHz, respectively. (H) Computational results for the maximum change in temperature of an ECG EES on skin during an MRI scan. (I) Temperature changes collected using two fiber-optic thermometers located at the interface between an ECG EES (at the loop antenna, coil) and a piece of phantom skin (blue) and on the surface of the phantom skin (red) during MRI scanning (3-T MRI). (J) Temperature changes collected by two fiber-optic thermometers at the interface between an ECG EES (at one of the mesh electrodes) and a piece of phantom skin (blue) and on the surface of the phantom skin (red) during MRI scanning (3-T MRI).
Fig. 4
Fig. 4
Visualization of radiolucent properties through medical imaging. (A) A coronal MRI image collected from the mid-dorsum of a rat cadaver with an ECG EES mounted on the skin. (B) A coronal MRI image collected from the mid-dorsum of a rat cadaver with conventional ECG leads mounted on the skin. (C) An x-ray image collected from the right flank of a rat cadaver with an ECG EES mounted on the skin. (D) An x-ray image collected from the right flank of a rat cadaver with conventional ECG leads mounted on the skin.
Fig. 5
Fig. 5
Operational characteristics of the ECG EES. (A) Block diagram of in-sensor analytics for peak detection from ECG waveforms. (B) ECG signals acquired simultaneously from an ECG EES (blue) and a gold standard (red), with detected peaks (green). (C) Comparison of heart rate determined using data from the ECG EES and a gold standard. (D) Respiration rate extracted from oscillations of the amplitudes of peaks extracted from the ECG waveforms. (E) Comparison of respiration rate determined using data from the ECG EES and manual count by a physician. (F) Comparison of skin temperature determined by the ECG EES and a gold-standard thermometer. (G) Thermal image of the chest collected using an IR camera. (H) Temperature wirelessly measured using an ECG EES. (I) Bland-Altman plot for heart rate collected from three healthy adults using an ECG EES and a clinical-standard system. (J) Bland-Altman plot for respiratory rate collected from three healthy adults using an ECG EES and a clinical-standard system.
Fig. 6
Fig. 6
Operational characteristics of the PPG EES. (A) Block diagram of in-sensor analytics for detection of peaks and valleys from PPG waveforms and for dynamic baseline control. (B) A circuit diagram with GPIO-enabled baseline control scheme. (C) Demonstration of dynamic baseline level control with a sinusoidal input (blue) and corresponding output changes (red). (D) Demonstration of operation of a PPG EES with (blue and red) and without (black dashed line) dynamic baseline control. Analytics on baseline level serves as an input to a control system that combines a GPIO port on the NFC SoC with an offset to ensure that the signal input to the ADC lies within its dynamic range (orange dashed lines). (E) Convention for calculating direct and alternating components of PPG waveforms collected in the red and IR, for purposes of calculating SpO2. (F) Empirical formula for SpO2 calculation using Roa based on comparison to a commercial pulse oximeter. (G) SpO2 determined using in-sensor analytics during a period of rest followed by a breath hold and then another period of rest. (H) Convention for measuring pulse arrival time (PAT) from R-peaks in the ECG waveforms and valleys in the PPG waveforms. (I) Values of 1/PAT acquired using an ECG EES and a PPG EES versus systolic BP data acquired using a cuff monitor. (J) Correlation curve between PAT and systolic BP with linear fit. (K) Bland-Altman plot for SpO2 collected from three adults using a PPG EES and a clinicalstandard system. (L) Temperature plot showing the capability for measuring differential skin temperatures between the torso and the foot using an ECG EES and a PPG EES.
Fig. 7
Fig. 7
Data collection from neonates in clinical and home settings. (A) A healthy term neonate with an ECG EES and a PPG EES on the chest and the bottom of the foot, respectively. (B and C) A mother holding a healthy term neonate showing skin-to-skin interaction with an ECG EES mounted on the chest (B) and an ECG EES mounted on the back (C). (D) A mother holding her neonate in the NICU; the inset is a magnified view of the ECG EES. (E) A neonate in the NICU with a PPG EES mounted on an alternative location on the hand. (F) Representative ECG and PPG waveforms acquired in this manner from a healthy term neonate. (G) Comparison of vital signs calculated from the ECG EES and a gold standard. Temperature and PAT data are displayed without reference data because these measurements are only periodically acquired with conventional devices.
Fig. 8
Fig. 8
Data collection from neonates in operating neonatal intensive care units. (A) Bland-Altman plot for HR using data from an ECG EES and a clinical standard. (B) Bland-Altman plot for RR using data from an ECG EES and a clinical standard. (C) Bland-Altman plot for SpO2 using data from a PPG EES and a clinical standard. (D) Representative results for PAT determined using combined data from an ECG EES and a PPG EES. (E to G) Differential temperature data collected from an ECG EES and a PPG EES for three recruited neonates with gestational ages of 28 weeks (E), 29 weeks (F), and 40 weeks (G). The other data presented here were collected from this same set of neonates. See fig. S40 for additional data.

Comment in

References

    1. Harrison W., Goodman D., Epidemiologic trends in neonatal intensive care, 2007-2012. JAMA Pediatr. 169, 855–862 (2015). doi: 10.1001/jamapediatrics.2015.1305; pmid: - DOI - PubMed
    1. Cartlidge P. H., Fox P. E., Rutter N., The scars of newborn intensive care . Early Hum. Dev. 21, 1–10 (1990). doi: 10.1016/0378-3782(90)90105-R; pmid: - DOI - PubMed
    1. Lund C., Medical adhesives in the NICU. Newborn Infant Nurs. Rev. 14, 160–165 (2014). doi: 10.1053/j.nainr.2014.10.001 - DOI
    1. Tottman A. C., Alsweiler J. M., Bloomfield F. H., Harding J. E., Presence and pattern of scarring in children born very preterm. Arch. Dis. Child Fetal Neonatal Ed. 103, F277–F279 (2018). doi: 10.1136/archdischild-2016-311999; pmid: - DOI - PubMed
    1. Bouwstra S., Chen W., Feijs L., Oetomo S. B., in 2009 Sixth International Workshop on Wearable and Implantable Body Sensor Networks (IEEE, 2009), pp. 162–167. doi: 10.1109/BSN.2009.40 - DOI

Publication types