Microcomputed Tomography Calibration Using Polymers and Minerals for Enamel Mineral Content Quantitation
- PMID: 30820021
- PMCID: PMC6597939
- DOI: 10.1159/000499186
Microcomputed Tomography Calibration Using Polymers and Minerals for Enamel Mineral Content Quantitation
Abstract
Objective: The aim of this paper was to develop calibration standards (CSs) that are readily available for clinical researchers for the quantitation of enamel mineral content.
Method: Polyethylene terephthalate (PET), acetal, polyphenylene sulfide (PPS), selenite, Egyptian alabaster, aragonite, and fluorite were fashioned into discs, and their densities were measured and stacked for microcomputed tomography examination. Frame averaging, flat-field correction, pre-filtration, and beam-hardening correction were applied. CSs were checked for homogeneity. The linear relationship between the mean greyscale value (GSV) of each disc and its physically calculated density was explored, and reproducibility was tested. A calibration function was established and then validated using a bovine enamel disc and sound enamel of extracted human premolar teeth.
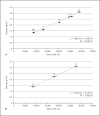
Results: Measured densities were PET (ρ = 1.38 g/cm3), acetal (ρ = 1.41 g/cm3), PPS (ρ = 1.64 g/cm3), selenite (ρ = 2.24 g/cm3), Egyptian alabaster (ρ = 2.7 g/cm3), aragonite (ρ = 2.72 g/cm3), and fluorite (ρ = 3.11 g/cm3). Examination of the profile sections of CSs confirmed the uniformity of GSVs with minimal beam-hardening effect. A squared Pearson correlation coefficient of R2 = 0.994 was determined between the mean GSV of each CS and its calculated density and was reproduced at different settings with R2 >0.99. A linear regression equation of density (y) versus GSV (x) was established using the least squares regression equation method. The estimated density of the bovine enamel disc (2.48 g/cm3) showed high accuracy when compared to the physically measured value (2.45 g/cm3). The -relative error was 1.2%. Densities of sound enamel in the extracted human premolar teeth were 2.6-3.1 g/cm3.
Conclusions: This is a simple, valid, and reproducible method to quantitate enamel mineral content. This simple, yet accurate system could be used to expand knowledge in the field of enamel caries research.
Keywords: Calibration standards; Early enamel lesions; Microcomputed tomography; Minerals; Polymers.
©2019 The Author(s) Published by S. Karger AG, Basel.
Conflict of interest statement
The authors have no conflicts of interest to declare.
Figures


Similar articles
-
Quantitative characterization and micro-CT mineral mapping of natural fissural enamel lesions.J Dent. 2016 Mar;46:23-9. doi: 10.1016/j.jdent.2016.01.012. Epub 2016 Feb 2. J Dent. 2016. PMID: 26836704
-
Mineral density of hypomineralised enamel.J Dent. 2010 Jan;38(1):50-8. doi: 10.1016/j.jdent.2009.09.002. J Dent. 2010. PMID: 19737596
-
Micro-CT analysis of naturally arrested brown spot enamel lesions.J Dent. 2017 Jan;56:105-111. doi: 10.1016/j.jdent.2016.11.007. Epub 2016 Nov 21. J Dent. 2017. PMID: 27884718
-
Application of polychromatic µCT for mineral density determination.J Dent Res. 2011 Jan;90(1):18-30. doi: 10.1177/0022034510378429. Epub 2010 Sep 21. J Dent Res. 2011. PMID: 20858779 Free PMC article. Review.
-
A review of quantitative methods for studies of mineral content of intra-oral caries lesions.J Dent Res. 1991 Jan;70(1):2-14. doi: 10.1177/00220345910700010301. J Dent Res. 1991. PMID: 1991857 Review.
Cited by
-
Guidelines for Micro-Computed Tomography Analysis of Rodent Dentoalveolar Tissues.JBMR Plus. 2021 Mar 3;5(3):e10474. doi: 10.1002/jbm4.10474. eCollection 2021 Mar. JBMR Plus. 2021. PMID: 33778330 Free PMC article. Review.
-
Characterization of Enamel and Dentine about a White Spot Lesion: Mechanical Properties, Mineral Density, Microstructure and Molecular Composition.Nanomaterials (Basel). 2020 Sep 21;10(9):1889. doi: 10.3390/nano10091889. Nanomaterials (Basel). 2020. PMID: 32967152 Free PMC article.
References
-
- Ten Bosch JJ, Angmar-Månsson B. A review of quantitative methods for studies of mineral content of intra-oral caries lesions. J Dent Res. 1991 Jan;70((1)):2–14. - PubMed
-
- Arends J, ten Bosch JJ. Demineralization and remineralization evaluation techniques. J Dent Res. 1992 Apr;71((Spec No)):924–8. - PubMed
-
- Wong FS, Willmott NS, Davis GR. Dentinal carious lesion in three dimensions. Int J Paediatr Dent. 2006 Nov;16((6)):419–23. - PubMed
Publication types
MeSH terms
Substances
LinkOut - more resources
Full Text Sources
Other Literature Sources
Medical

