Automatic analysis of the retinal avascular area in the rat oxygen-induced retinopathy model
- PMID: 30820138
- PMCID: PMC6382473
Automatic analysis of the retinal avascular area in the rat oxygen-induced retinopathy model
Abstract
Purpose: The aim of this study was to create an algorithm to automate, accelerate, and standardize the process of avascular area segmentation in images from a rat oxygen-induced retinopathy (OIR) model.
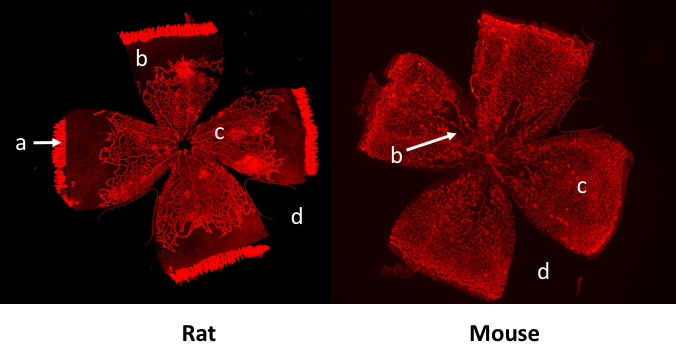
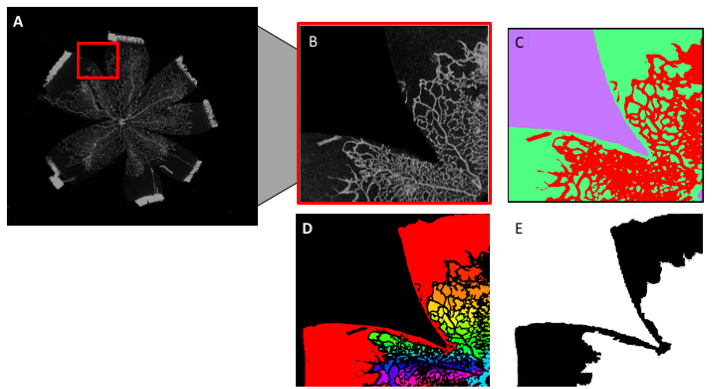
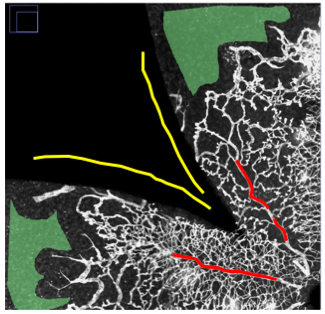
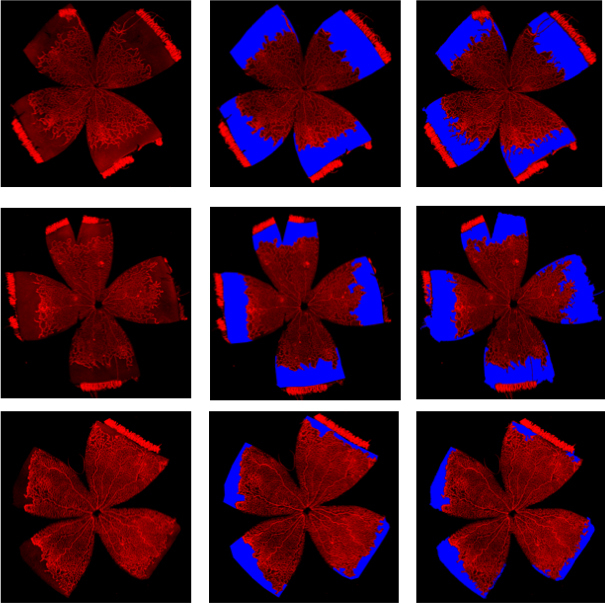
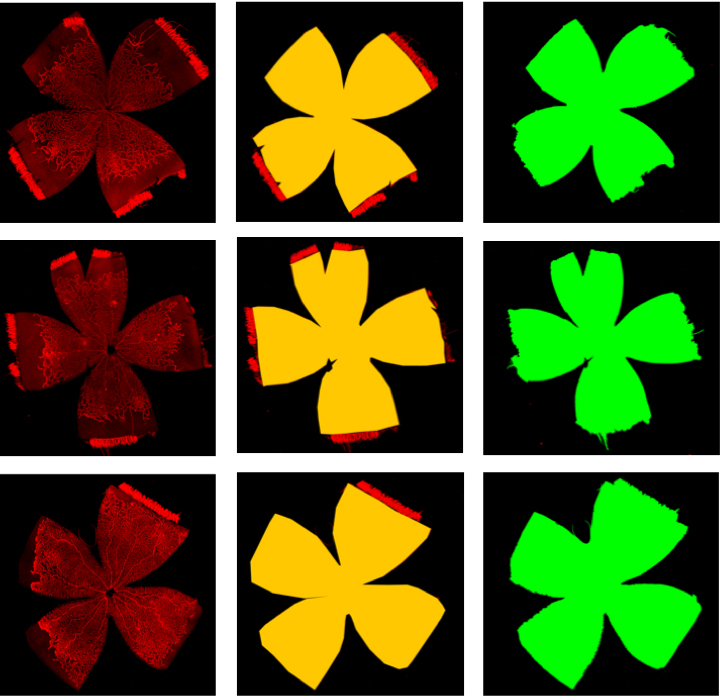
Methods: Within 6 h of birth, full-term pups born to Sprague Dawley rat dams that had undergone partial bilateral uterine artery ligation at embryonic day 19.5 were placed into a controlled oxygen environment (Oxycycler, BioSpherix, Parish, NY) at 50% oxygen for 48 h, followed by cycling between 10% and 50% oxygen every 24 h until day 15. The pups were then moved into room air until day 18.5. Ten lectin-stained retinal flat mounts were imaged in montage fashion at 10x magnification. Three masked human reviewers measured two parameters, total retinal area and peripheral avascular area, for each image using the ImageJ freehand selection tool. The outputs of each read were measured as number of pixels. The gold standard value for each image was the mean of the three human reads. Interrater agreement for the measurement of total retinal area, avascular area, and percent avascular area was calculated using type A intraclass correlation coefficients (ICCs) with a two-way random effects model. Automated avascular area identification (A3ID) is a method written in ImageJ Macro that is intended for use in the Fiji (Fiji is Just ImageJ) image processing platform. The input for A3ID is a rat retinal image, and the output is the avascular area (in pixels). A3ID utilizes a random forest classifier with a connected-components algorithm and post-processing filters for size and shape. A separate algorithm calculates the total retinal area. We compared the output of both algorithms to gold standard measurements by calculating ICCs, performing linear regression, and determining the Dice coefficients for both algorithms. We also constructed a Bland-Altman plot for A3ID output.
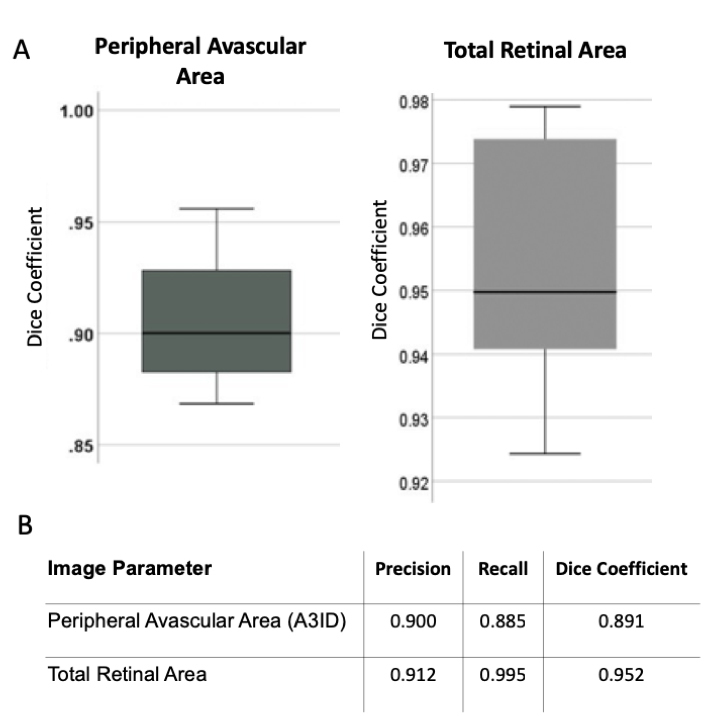
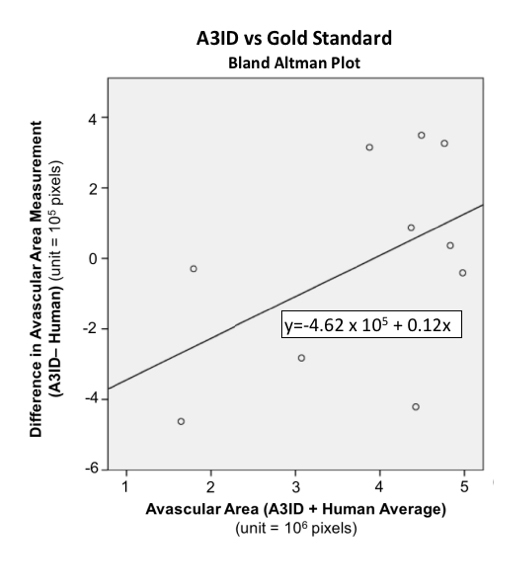
Results: The ICC for percent peripheral avascular/total area between human readers was 0.995 (CI: 0.974-0.999), with p<0.001. The ICC between A3ID and the gold standard was calculated for three image parameters-avascular area: 0.974 (CI: 0.899-0.993), with p<0.001; total retinal area: 0.465 (CI: 0.0-0.851), with p=0.001; and the percent peripheral avascular/total area: 0.94 (CI: 0.326-0.989), with p<0.001. In the linear regression analysis, the slope for prediction of the gold standard percent peripheral avascular/total area from A3ID was 0.98, with R2=0.975. A3ID and the total retinal area algorithm achieve an average Dice coefficient of 0.891 and 0.952, respectively. The Bland-Altman analysis revealed a trend for computer underestimation of the peripheral avascular area in images with low peripheral avascular area and overestimation of peripheral avascular area in images with large peripheral avascular areas.
Conclusions: A3ID reliably predicts peripheral avascular area based on rat OIR retinal images. When the peripheral avascular area is particularly high or low, hand segmentation of images may be superior.
Figures
Similar articles
-
Effect of subretinal injection on retinal structure and function in a rat oxygen-induced retinopathy model.Mol Vis. 2017 Nov 29;23:832-843. eCollection 2017. Mol Vis. 2017. PMID: 29259390 Free PMC article.
-
Effect(s) of preterm birth on normal retinal vascular development and oxygen-induced retinopathy in the neonatal rat.Curr Eye Res. 2013 Dec;38(12):1266-73. doi: 10.3109/02713683.2013.813556. Epub 2013 Jul 25. Curr Eye Res. 2013. PMID: 23885967
-
Correspondence of retinal thinning and vasculopathy in mice with oxygen-induced retinopathy.Exp Eye Res. 2014 May;122:119-22. doi: 10.1016/j.exer.2014.03.010. Epub 2014 Apr 2. Exp Eye Res. 2014. PMID: 24703909 Free PMC article.
-
Early retinal blood vessel growth in normal and growth restricted rat pups raised in oxygen and room air.Br J Ophthalmol. 2011 Nov;95(11):1592-6. doi: 10.1136/bjophthalmol-2011-300276. Epub 2011 Aug 17. Br J Ophthalmol. 2011. PMID: 21849349
-
Strain-dependent differences in oxygen-induced retinopathy in the inbred rat.Invest Ophthalmol Vis Sci. 2005 Apr;46(4):1445-52. doi: 10.1167/iovs.04-0708. Invest Ophthalmol Vis Sci. 2005. PMID: 15790914
Cited by
-
Applications of Deep Learning: Automated Assessment of Vascular Tortuosity in Mouse Models of Oxygen-Induced Retinopathy.Ophthalmol Sci. 2023 May 25;4(1):100338. doi: 10.1016/j.xops.2023.100338. eCollection 2024 Jan-Feb. Ophthalmol Sci. 2023. PMID: 37869029 Free PMC article.
-
Development of an Open-Source Dataset of Flat-Mounted Images for the Murine Oxygen-Induced Retinopathy Model of Ischemic Retinopathy.Transl Vis Sci Technol. 2024 Dec 2;13(12):4. doi: 10.1167/tvst.13.12.4. Transl Vis Sci Technol. 2024. PMID: 39625436 Free PMC article.
References
-
- Patz A, Hoeck LE, De La Cruz E. Studies on the Effect of High Oxygen Administration in Retrolental Fibroplasia*: I. Nursery Observations. Am J Ophthalmol. 1952;35:1248–53. - PubMed
-
- Penn JS, Henry MM, Tolman BL. Exposure to alternating hypoxia and hyperoxia causes severe proliferative retinopathy in the newborn rat. Pediatr Res. 1994;36:724–31. - PubMed
Publication types
MeSH terms
Substances
Grants and funding
LinkOut - more resources
Full Text Sources