. 2019 Feb 26:5:6.
doi: 10.1038/s41540-019-0085-4. eCollection 2019.

Synergy from gene expression and network mining (SynGeNet) method predicts synergistic drug combinations for diverse melanoma genomic subtypes

Affiliations

Synergy from gene expression and network mining (SynGeNet) method predicts synergistic drug combinations for diverse melanoma genomic subtypes

Kelly E Regan-Fendt et al. NPJ Syst Biol Appl. .

Abstract

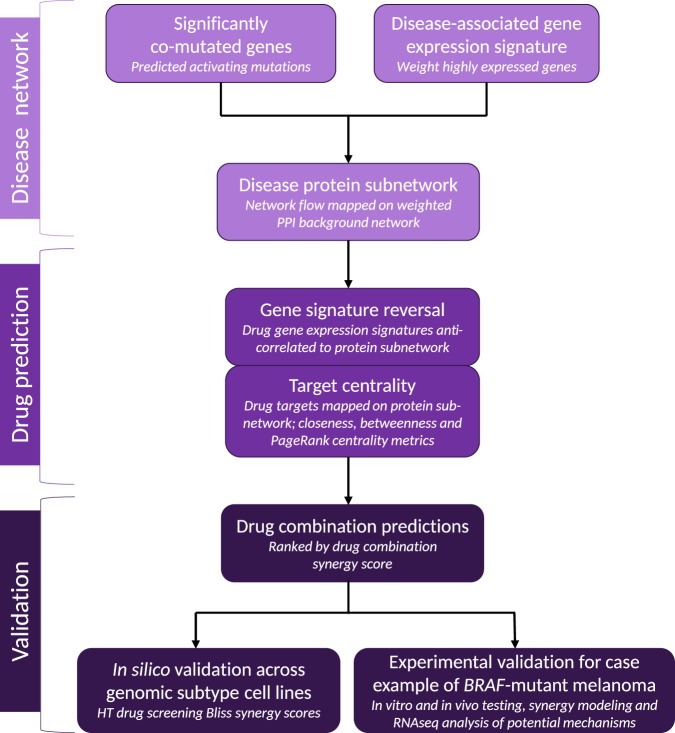
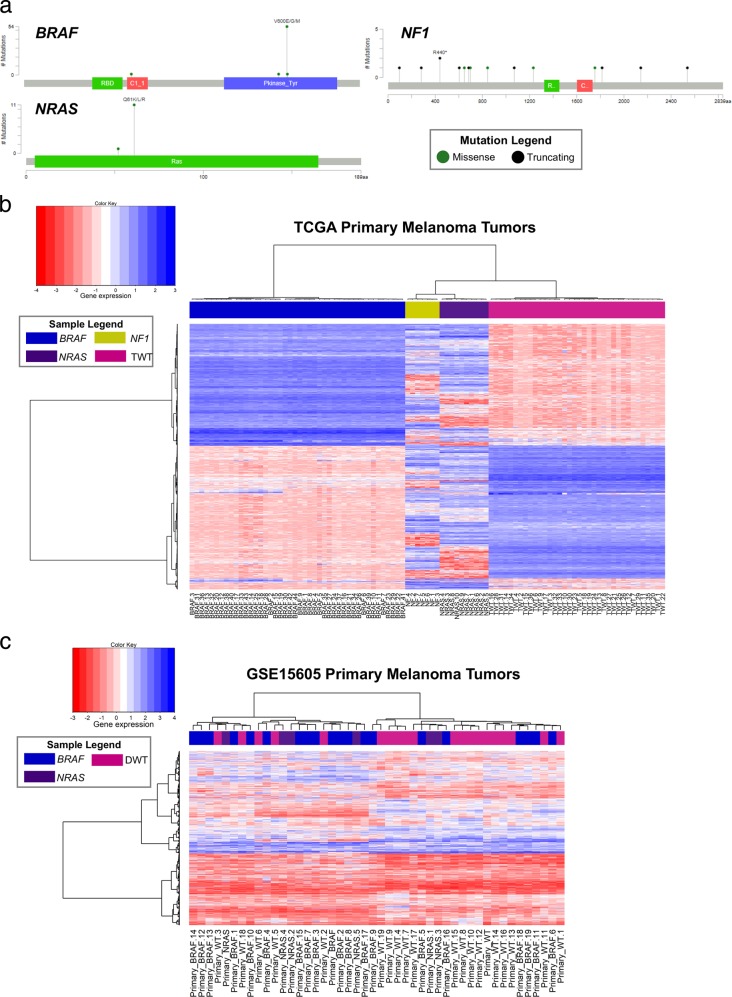
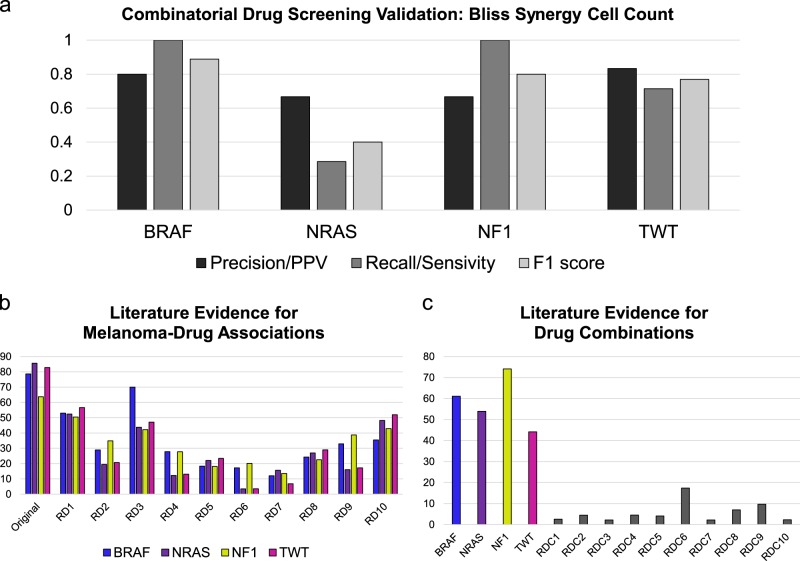
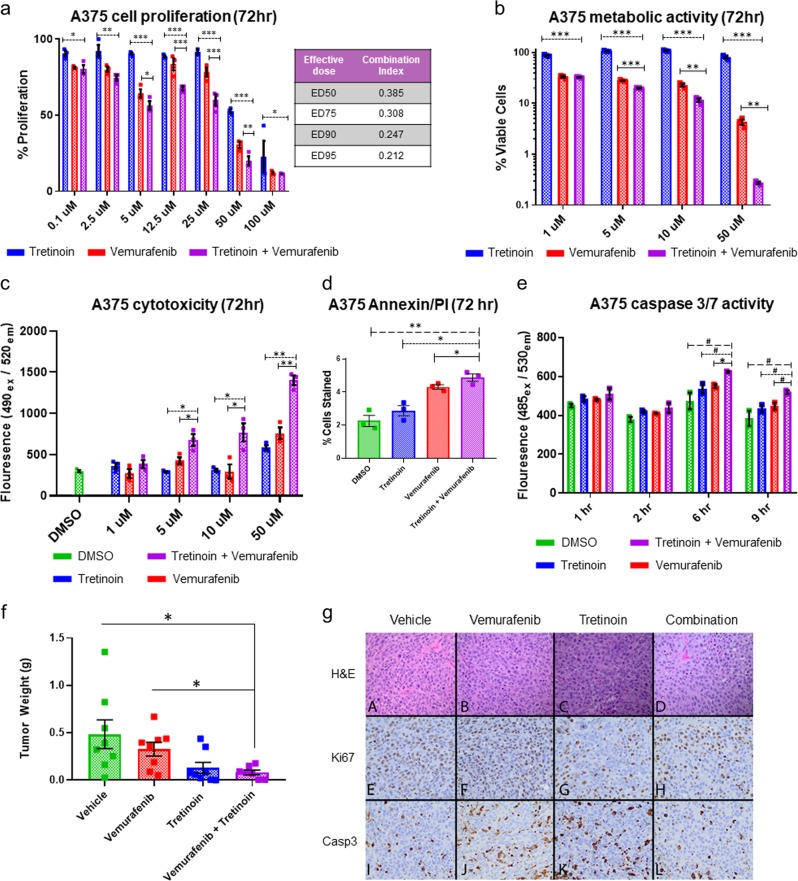
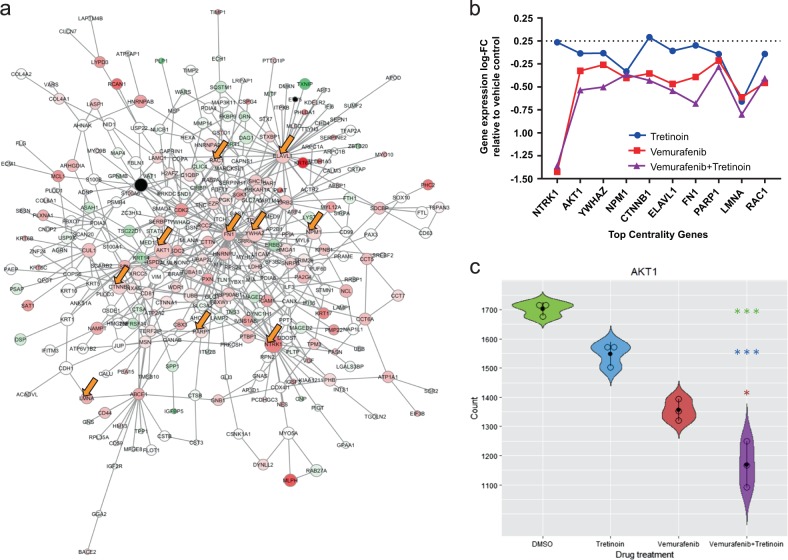
Systems biology perspectives are crucial for understanding the pathophysiology of complex diseases, and therefore hold great promise for the discovery of novel treatment strategies. Drug combinations have been shown to improve durability and reduce resistance to available first-line therapies in a variety of cancers; however, traditional drug discovery approaches are prohibitively cost and labor-intensive to evaluate large-scale matrices of potential drug combinations. Computational methods are needed to efficiently model complex interactions of drug target pathways and identify mechanisms underlying drug combination synergy. In this study, we employ a computational approach, SynGeNet (Synergy from Gene expression and Network mining), which integrates transcriptomics-based connectivity mapping and network centrality analysis to analyze disease networks and predict drug combinations. As an exemplar of a disease in which combination therapies demonstrate efficacy in genomic-specific contexts, we investigate malignant melanoma. We employed SynGeNet to generate drug combination predictions for each of the four major genomic subtypes of melanoma (BRAF, NRAS, NF1, and triple wild type) using publicly available gene expression and mutation data. We validated synergistic drug combinations predicted by our method across all genomic subtypes using results from a high-throughput drug screening study across. Finally, we prospectively validated the drug combination for BRAF-mutant melanoma that was top ranked by our approach, vemurafenib (BRAF inhibitor) + tretinoin (retinoic acid receptor agonist), using both in vitro and in vivo models of BRAF-mutant melanoma and RNA-sequencing analysis of drug-treated melanoma cells to validate the predicted mechanisms. Our approach is applicable to a wide range of disease domains, and, importantly, can model disease-relevant protein subnetworks in precision medicine contexts.


Conflict of interest statement

The authors declare no competing interests.

Figures

Fig. 1
Fig. 1
Overview of SynGeNet drug combination prediction study design. The first step of our method involves generating melanoma genotype-specific protein subnetworks from a source of disease-associated root genes (i.e., significantly co-mutated) from which network flow is propagated across a background network of protein–protein interactions (PPI) using up-regulated gene expression data (e.g., tumor vs. normal samples) via the belief propagation algorithm. Next, drug combinations are predicted using the resulting networks, where drug synergy scores are calculated based on the degree of drug-induced gene signature reversal (i.e., negative gene set enrichment analysis connectivity scores) and the weighted sum of centrality metrics calculated for the combined set drug targets in the network for each drug pair. Finally, predicted drug combinations are ranked according to a final synergy score. Drug predictions were validated in this study in two settings: (i) retrospectively, using Bliss synergy score results from a high-throughput drug screening across melanoma cell lines with different genomic backgrounds, and (ii) prospectively, where a top-ranked drug combination predicted for BRAF-mutant melanoma was selected as a case study for prospective validation using in vitro and in vivo models of BRAF-mutant melanoma, and the mechanistic basis for this drug combination prediction was investigated via RNA-seq gene expression analysis and the subnetwork level and for individual genes determined to be highly central
Fig. 2
Fig. 2
Spectrum of gene mutations and associated gene expression profiles across melanoma genomic subtypes in the The Cancer Genome Atlas Skin Cutaneous Melanoma (TCGA SKCM) dataset. a Gene mutation plots including location and frequency of mutations in the BRAF, NRAS, and NF1 genes are shown for primary melanoma tumor samples in the TCGA SKCM dataset. Mutation marker height corresponds to the number of mutations and color corresponds to mutation type: missense (green) and truncating, including nonsense, nonstop, frameshift deletion, frameshift insertion, and splice site (black). Somatic mutation frequency for each gene in this cohort is as follows: BRAF (42.3%), NRAS (9.6%), and NF1 (9.6%). Protein families visualized for each gene include BRAF: protein tyrosine kinase (457–714), C1 domain (235– 282), and Raf-like Ras-binding domain (156–225); NRAS: Ras family (5–165); NF1: GTPase-activator protein for Ras-like GTPase (1324– 1451), and CRAL/TRIO domain (1602-1736). Hierarchical clustering (Euclidean distance) of primary melanoma tumors samples from the TCGA SKCM (b) and GEO GSE15605 (c) datasets. For the TCGA SKCM dataset, sample labels are color coded according to genomic subtype: BRAF (blue), NRAS (purple), NF1 (yellow), and triple wild-type (magenta). For the GSE15605 dataset, samples are color coded according to genomic subtype: BRAF (blue), NRAS (purple), and double wild-type (DWT)
Fig. 3
Fig. 3
Validation of drug combination predictions across melanoma genomic subtypes using high-throughput drug screening data and literature evidence. a Bliss synergy scores obtained from drug combinations from a high-throughput drug screening study evaluating 5778 drug combinations among 108 drugs in BRAF-mutant (A375), NRAS-mutant (IPC-298), NF1- mutant (MeWo), and TWT (COLO792) cell lines were used to assess precision and recall of drug combination predictions. The geometric mean of precision and recall (F1 score) is also reported for each set of genomic subtype-specific drug combination predictions. b The mean number of PubMed abstracts for melanoma–drug associations for single drugs constituent of drug combinations for the original predictions and random samplings of the Food and Drug Administration (FDA)-approved drug dataset of equal size for each of the four genomic subtypes. c The mean number of PubMed abstracts for drug–drug associations for the top 50 drug combinations for the original drug combination predictions in each genomic subtype (color-coded bars) as well as random samplings of drug pairs (n = 50 pairs) from the FDA-approved drug dataset (gray bars)
Fig. 4
Fig. 4
In vitro and in vivo validation of vemurafenib + tretinoin combination in BRAF-mutant melanoma models. a Percent proliferation of A375 cells following 72 h of treatment with tretinoin (blue), vemurafenib (red), and tretinoin + vemurafenib combination (purple) relative to dimethyl sulfoxide (DMSO) vehicle treatment as determined by MTS assay. Combination index (CI) values calculated by the Chou–Talalay method for drug combination synergy are reported for effective doses ED50, ED75, ED90, and ED95 values. b Percent viable A375 cells following 72 h of treatment with tretinoin (blue), vemurafenib (red), and tretinoin + vemurafenib combination (purple) relative to DMSO vehicle treatment quantified by ATP luminescence. c Cytotoxicity was measured in A375 cells via fluorescent cyanine dye bound to DNA released following cell death at 72 h following treatment with vehicle control (DMSO 1 μM), tretinoin (blue), vemurafenib (red), and tretinoin + vemurafenib combination (purple). d A375 cells were treated with 5 μM of DMSO (green), tretinoin (blue), vemurafenib (red), or tretinoin + vemurafenib combination (purple) for 72 h and stained for Annexin V and propidium iodide (PI). Cell populations were analyzed for apoptosis via flow cytometry and quantified with FlowJo software and shown as the mean for double-positive Annexin V/PI-stained cells. e Apoptosis was measured by caspase-3/7 enzymatic activity via a fluorescence based assay at 1, 2, 6, and 9 h time intervals following treatment (1 μM) with DMSO vehicle control (green), tretinoin (blue), vemurafenib (red), and tretinoin + vemurafenib combination (purple). f A375 cells were injected subcutaneously (1 × 106 cells) into 8-week old athymic nude mice. After 10 days of tumor growth, mice were randomized to the following treatment groups (8 mice/group): daily oral gavage (6 days/week) with vemurafenib (50 mg/kg daily), tretinoin (10 mg/kg), combination or vehicle (20% PEG-400 (v/v) + 5% TPGS (v/v) + 75% ddH2O). Treatment concluded after 15 days, and tumors were harvested and weighed. g Representative images are shown for hematoxylin (H&E) (top; ad) and immunohistochemical staining for Ki67 (middle; eh) and caspase-3 (bottom; il) from formalin-fixed tumors resected from mice on day 15 of treatment. Error bars represent SEM. Significance was determined using unpaired t tests: #P < 0.10, *P < 0.05, **P < 0.005, and ***P < 0.0005
Fig. 5
Fig. 5
Vemurafenib + tretinoin combination decreases gene expression in the BRAF-melanoma network. a Network visualization of original BRAF network with gene expression log-fold change (false discovery rate (FDR) <0.05) from RNA-sequencing (RNA-seq) analysis of combination-treated A375 cells relative to vehicle control-treated A375 cells superimposed to scale color-coding of gene nodes (green: positive fold change; red: negative fold change; white: weakly changed; black: not significantly differentially expressed). Yellow arrows denote top 10 centrality genes differentially expressed following combination treatment. b Top centrality genes ordered by highest centrality score (left) to lowest centrality score (right) with corresponding log-fold change for differential expression status of each gene following combination treatment relative to vehicle control. c Normalized RNA-seq gene expression count plot is shown for AKT1 (V-Akt murine thymoma viral oncogene homolog 1), a top centrality genes in the network, in response to each drug treatment condition. The differential expression status of the combination treatment group relative to other treatment groups are color-coded as follows: green = DMSO vehicle control; tretinoin = blue; vemurafenib = red; *adj. P < 0.05 and ***adj. P < 0.0005

References

    1. Ryall KA, Tan AC. Systems biology approaches for advancing the discovery of effective drug combinations. J. Cheminform. 2015;7:7. doi: 10.1186/s13321-015-0055-9. - DOI - PMC - PubMed
    1. Harrold JM, Ramanathan M, Mager DE. Network-based approaches in drug discovery and early development. Clin. Pharmacol. Ther. 2013;94:651–658. doi: 10.1038/clpt.2013.176. - DOI - PMC - PubMed
    1. Li J, et al. A survey of current trends in computational drug repositioning. Brief Bioinform. 2016;17:2–12. doi: 10.1093/bib/bbv020. - DOI - PMC - PubMed
    1. Hurle MR, et al. Computational drug repositioning: from data to therapeutics. Clin. Pharmacol. Ther. 2013;93:335–341. doi: 10.1038/clpt.2013.1. - DOI - PubMed
    1. Feala JD, et al. Systems approaches and algorithms for discovery of combinatorial therapies. Wiley Interdiscip. Rev. Syst. Biol. Med. 2010;2:181–193. doi: 10.1002/wsbm.51. - DOI - PubMed

Publication types

MeSH terms

Substances