. 2019 Feb 25:2:78.
doi: 10.1038/s42003-019-0305-x. eCollection 2019.

A simple high-throughput approach identifies actionable drug sensitivities in patient-derived tumor organoids

Affiliations

A simple high-throughput approach identifies actionable drug sensitivities in patient-derived tumor organoids

Nhan Phan et al. Commun Biol. .

Abstract

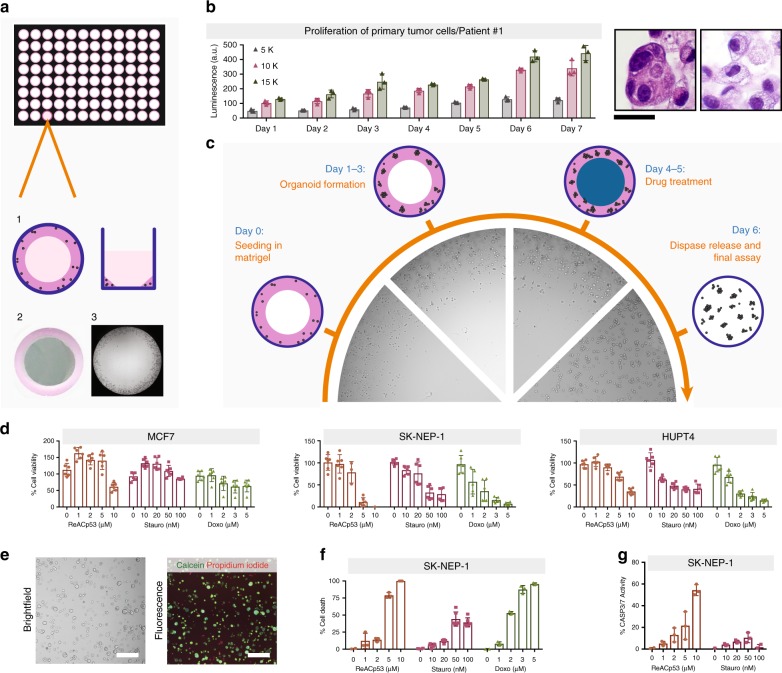
Tumor organoids maintain cell-cell interactions, heterogeneity, microenvironment, and drug response of the sample they originate from. Thus, there is increasing interest in developing tumor organoid models for drug development and personalized medicine applications. Although organoids are in principle amenable to high-throughput screenings, progress has been hampered by technical constraints and extensive manipulations required by current methods. Here we introduce a miniaturized method that uses a simplified geometry by seeding cells around the rim of the wells (mini-rings). This allows high-throughput screenings in a format compatible with automation as shown using four patient-derived tumor organoids established from two ovarian and one peritoneal high-grade serous carcinomas and one carcinosarcoma of the ovary. Using our automated screening platform, we identified personalized responses by measuring viability, number, and size of organoids after exposure to 240 kinase inhibitors. Results are available within a week from surgery, a timeline compatible with therapeutic decision-making.


Conflict of interest statement

The authors declare no competing interests.

Figures

Fig. 1
Fig. 1
The mini-ring method for 3D tumor cell biology. a Schematics of the mini-ring setup. Cells are plated to form a solid thin ring as depicted in 1 and photographed in 2. The picture in 3 acquired with a cell imager shows tumor organoids growing at the periphery of the well as desired, with no invasion of the center. b Proliferation of primary tumor cells as measured by ATP release. Different seeding densities were tested and compared. This clinical sample grew and maintained the heterogeneity and histology of the original ovarian tumor, which had a high-grade serous carcinoma component (H&E left picture) and a clear cell component (H&E right picture). Scale bar, 20 µm. c Schematic of the drug-treatment experiments performed in the mini-ring setting. The pictures are representative images as acquired on different days using a Celigo cell imager. dg Assays to monitor drug response of cell lines using the mini-ring configuration. Three drugs (ReACp53, Staurosporine, and Doxorubicin) were tested at five concentrations in triplicates for all cell lines. d ATP release assay (CellTiter-Glo 3D) readout. e,f Calcein/PI readout. e Representative image showing staining of MCF7 cells with the dyes and segmentation to quantify the different populations (live / dead). Scale bar, 400 nm. f Quantification of Calcein/PI assay for three-drug assay. g Quantification of cleaved caspase 3/7 assay. Doxorubicin was omitted due to its fluorescence overlapping with the caspase signal. For all graphs, symbols are individual replicates, bars represent the average, and error bars show SD
Fig. 2
Fig. 2
Comparison of different seeding procedures. a Bright-field images of rings and drops of MCF7 cells in Cultrex BME. Scale bar, 1 mm. b ATP assays showing identical sensitivities of mini-rings and drops to ReACp53, Staurosporine, and Doxorubicin tested at five concentrations in duplicates. Two independent experiments performed, all points shown. Bars represent the average, error bars show SD
Fig. 3
Fig. 3
Mini-ring approach to unveil drug response patterns in PDTOs. a Morphology of all PDTOs established in this study as visualized by bright-field microscopy. Morphology and 3D organization of the samples is highly variable. For instance, some of Patient #3 cells are arranged in fascicles within the Matrigel, likely representing the sarcomatous component of the tumor. Scale bar, 100 µm. b Results of kinase screening experiment for Patient #1 PDTOs. Three readouts were used for this assay: ATP quantification as measured by CellTiter-Glo 3D and organoid number or size quantification evaluated by bright-field imaging. Bright-field images were segmented and quantified using the Celigo S Imaging Cell Cytometer Software. Both organoid number and total area were evaluated for their ability to capture response to drugs. In this plot, each vertical line is one drug, all 240 tested are shown. Values are normalized to the respective vehicle controls for each method and expressed as %. AverageZ-score calculated as reported in Methods. c A representative image of the effects of the indicated drug treatments as visualized by the Celigo cell imager. Scale bar, 100 µm. d Small-scale kinase assay on Patient #1 primary PDTOs and PDX-derived cells. ATP readout. Four molecules not present in the primary screening were tested. Flavopiridol and BS-181 HCl are included as positive and negative control, respectively. t-test, **p < 0.01. e Comparison of the histology of the primary tumor with the established PDX. Scale bar: 100 µm
Fig. 4
Fig. 4
Individualized response of PDTOs to tyrosine kinase inhibitors. ac Results of kinase screening experiment on Patients #2–4 organoids. Each vertical line represents one of 241 tested drugs. Values are normalized to the respective vehicle controls (DMSO) for each method and expressed as %. d Expression of the multi-drug efflux protein ABCB1 in PDTOs as visualized by IHC. Patient #2 expresses very high levels of the ABC transporter. Scale bar: 60 µm. e Diagram illustrating limited overlap between the detected patterns of response identified through the mini-ring assay for all patients

References

    1. Cummings CA, Peters E, Lacroix L, Andre F, Lackner MR. The role of next-generation sequencing in enabling personalized oncology therapy. Clin. Transl. Sci. 2016;9:283–292. doi: 10.1111/cts.12429. - DOI - PMC - PubMed
    1. Simon R, Roychowdhury S. Implementing personalized cancer genomics in clinical trials. Nat. Rev. Drug Discov. 2013;12:358–369. doi: 10.1038/nrd3979. - DOI - PubMed
    1. Letai A. Functional precision cancer medicine-moving beyond pure genomics. Nat. Med. 2017;23:1028–1035. doi: 10.1038/nm.4389. - DOI - PubMed
    1. Vlachogiannis G, et al. Patient-derived organoids model treatment response of metastatic gastrointestinal cancers. Science. 2018;359:920–926. doi: 10.1126/science.aao2774. - DOI - PMC - PubMed
    1. Voest EE, Bernards R. DNA-guided precision medicine for cancer: a case of irrational exuberance? Cancer Discov. 2016;6:130–132. doi: 10.1158/2159-8290.CD-15-1321. - DOI - PubMed

Publication types

MeSH terms

Substances