. 2019 Mar 1;2(3):e190096.
doi: 10.1001/jamanetworkopen.2019.0096.

Comparative Accuracy of Diagnosis by Collective Intelligence of Multiple Physicians vs Individual Physicians

Affiliations

Comparative Accuracy of Diagnosis by Collective Intelligence of Multiple Physicians vs Individual Physicians

Michael L Barnett et al. JAMA Netw Open. .

Abstract

Importance: The traditional approach of diagnosis by individual physicians has a high rate of misdiagnosis. Pooling multiple physicians' diagnoses (collective intelligence) is a promising approach to reducing misdiagnoses, but its accuracy in clinical cases is unknown to date.

Objective: To assess how the diagnostic accuracy of groups of physicians and trainees compares with the diagnostic accuracy of individual physicians.

Design, setting, and participants: Cross-sectional study using data from the Human Diagnosis Project (Human Dx), a multicountry data set of ranked differential diagnoses by individual physicians, graduate trainees, and medical students (users) solving user-submitted, structured clinical cases. From May 7, 2014, to October 5, 2016, groups of 2 to 9 randomly selected physicians solved individual cases. Data analysis was performed from March 16, 2017, to July 30, 2018.

Main outcomes and measures: The primary outcome was diagnostic accuracy, assessed as a correct diagnosis in the top 3 ranked diagnoses for an individual; for groups, the top 3 diagnoses were a collective differential generated using a weighted combination of user diagnoses with a variety of approaches. A version of the McNemar test was used to account for clustering across repeated solvers to compare diagnostic accuracy.

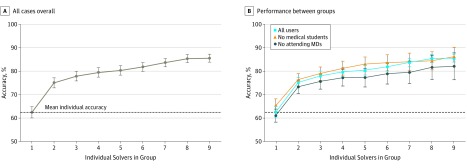
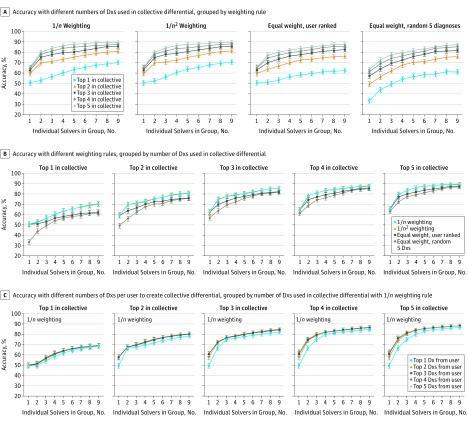
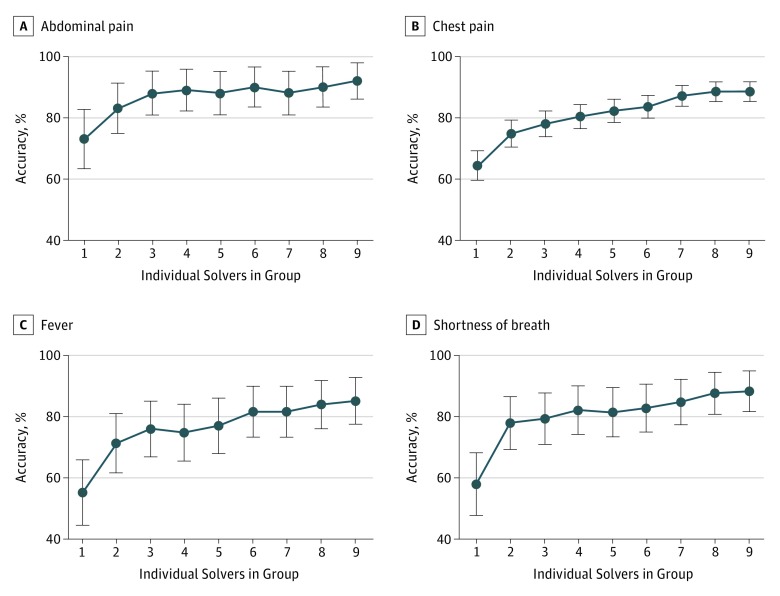
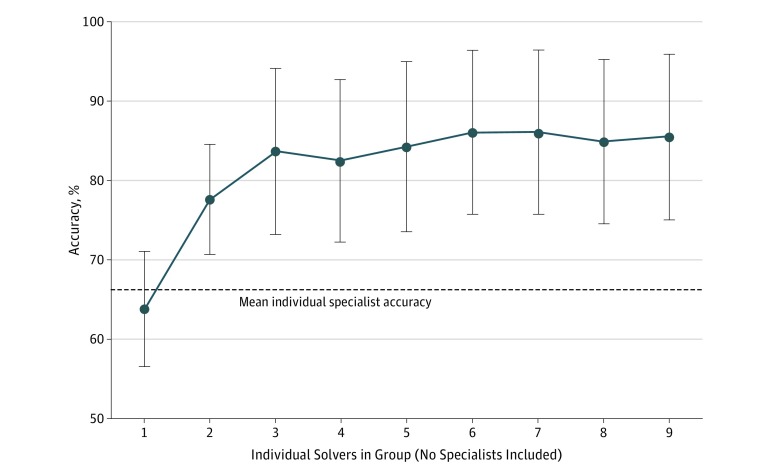
Results: Of the 2069 users solving 1572 cases from the Human Dx data set, 1228 (59.4%) were residents or fellows, 431 (20.8%) were attending physicians, and 410 (19.8%) were medical students. Collective intelligence was associated with increasing diagnostic accuracy, from 62.5% (95% CI, 60.1%-64.9%) for individual physicians up to 85.6% (95% CI, 83.9%-87.4%) for groups of 9 (23.0% difference; 95% CI, 14.9%-31.2%; P < .001). The range of improvement varied by the specifications used for combining groups' diagnoses, but groups consistently outperformed individuals regardless of approach. Absolute improvement in accuracy from individuals to groups of 9 varied by presenting symptom from an increase of 17.3% (95% CI, 6.4%-28.2%; P = .002) for abdominal pain to 29.8% (95% CI, 3.7%-55.8%; P = .02) for fever. Groups from 2 users (77.7% accuracy; 95% CI, 70.1%-84.6%) to 9 users (85.5% accuracy; 95% CI, 75.1%-95.9%) outperformed individual specialists in their subspecialty (66.3% accuracy; 95% CI, 59.1%-73.5%; P < .001 vs groups of 2 and 9).

Conclusions and relevance: A collective intelligence approach was associated with higher diagnostic accuracy compared with individuals, including individual specialists whose expertise matched the case diagnosis, across a range of medical cases. Given the few proven strategies to address misdiagnosis, this technique merits further study in clinical settings.


Conflict of interest statement

Conflict of Interest Disclosures: Dr Barnett reported receiving personal fees from Greylock McKinnon Associates outside the submitted work. Dr Nundy reported receiving personal fees from the Human Diagnosis Project (Human Dx) outside the submitted work, serving as nonprofit director of Human Dx at the time of this study, and being a previous employee of and having equity in Human Dx. Dr Bates reported consulting for EarlySense, which makes patient-safety monitoring systems and receiving compensation from CDI (Center for Diagnostic Innovation) (Negev), Ltd, a not-for-profit incubator for health information technology startups; and having equity in ValeraHealth, which makes software to help patients with chronic diseases; Clew, which makes software to support clinical decision making in intensive care; and MDClone, which takes clinical data and produces deidentified versions of it. No other conflicts were reported.

Figures

Figure 1.
Figure 1.. Diagnostic Accuracy for the Base Case Rule by Group Size Overall and by User Training
Each point shows the accuracy of groups using the base case rule of using all diagnoses from each to make a collective differential diagnosis list and assessing the top 3 weighted diagnoses in the collective for diagnostic success. A, Curve for all cases overall. B, Comparison of performance between groups with and without medical students or attending physicians. To create the collective differential diagnosis list, individuals’ diagnoses were weighted inversely to their position on a differential list (eg, the first diagnosis has a weight of 1, the second is 1/2, and so on). For each group, we summed diagnosis weights to produce a ranked list and used the top 3 diagnoses in this collective differential to assess accuracy. The y-axis represents accuracy, the percentage of cases with the correct diagnosis in the top 3 collective diagnoses listed, for increasing group sizes of randomly chosen users. The dashed line indicates the average accuracy for individual solvers across the 1572-case sample. Error bars indicate 95% CIs.
Figure 2.
Figure 2.. Range of Diagnostic Accuracy of Collective Differential Diagnoses (Dxs) Across Different Specifications
Each panel shows the accuracy of groups using multiple variations on the rules for making a collective differential and adjudicating a solution. The base case used in the other figures corresponds to 1/n weighting with 3 Dxs used in the collective differential. In all panels, the y-axis represents accuracy, the percentage of 1572 cases with the correct Dx in the collective differential, for increasing group sizes of randomly chosen physician users. Error bars indicate 95% CIs. A, A different weighting scheme was applied to the nth Dx for each user in the group: 1/n, 1/n2, equal weight to all Dxs, and equal weight for 5 randomly ordered Dxs per user. A separate colored curve is shown for the change in accuracy using the top 1 through 5 Dxs in the collective differential to adjudicate a solution. B, The same results as in part A, but each panel instead shows 4 separate colored curves for each weighting scheme using the top 1 through 5 Dxs in the collective differential to adjudicate a solution. C, The 1/n weighting rule, with each panel showing 5 separate curves for using the top 1 through 5 Dxs from each user’s solution to create the collective differential.
Figure 3.
Figure 3.. Diagnostic Accuracy and Group Size of Physicians by Presenting Symptom
Shown is the accuracy, the percentage of cases with the correct diagnosis in the top 3 diagnoses listed, for increasing group sizes of randomly chosen physician users across 4 subgroups of cases with the most prevalent presenting symptoms. The presenting symptoms are abdominal pain (81 cases), chest pain (380 cases), fever (84 cases), and shortness of breath (90 cases). Error bars indicate 95% CIs.
Figure 4.
Figure 4.. Diagnostic Accuracy for Nonspecialist Groups Compared With Individual Specialists
Shown is the accuracy, the percentage of cases with the correct diagnosis in the top 3 diagnoses listed, for increasing group sizes of randomly chosen nonspecialist physician users. Each group is composed of a set of users whose specialty does not match the specialty of the individual case. The dashed line indicates the individual accuracy of specialist physicians whose specialty matches the case (eg, cardiology for a cardiovascular presenting symptom). Error bars indicate 95% CIs.

Comment in

Similar articles

Cited by

References

    1. Sonderegger-Iseli K, Burger S, Muntwyler J, Salomon F. Diagnostic errors in three medical eras: a necropsy study. Lancet. 2000;355(9220):-. doi:10.1016/S0140-6736(00)02349-7 - DOI - PubMed
    1. Beam CA, Layde PM, Sullivan DC. Variability in the interpretation of screening mammograms by US radiologists: findings from a national sample. Arch Intern Med. 1996;156(2):209-213. doi:10.1001/archinte.1996.00440020119016 - DOI - PubMed
    1. Peabody JW, Luck J, Jain S, Bertenthal D, Glassman P. Assessing the accuracy of administrative data in health information systems. Med Care. 2004;42(11):1066-1072. doi:10.1097/00005650-200411000-00005 - DOI - PubMed
    1. Shojania KG, Burton EC, McDonald KM, Goldman L Autopsy as an outcome and performance measure: summary. Agency for Healthcare Research and Quality. https://www.ncbi.nlm.nih.gov/books/NBK11951/ Published 2002. Accessed January 28, 2019.
    1. Balogh E, Miller BT, Ball J. Improving Diagnosis in Health Care. Washington, DC: National Academies Press; 2015. doi:10.17226/21794 - DOI - PubMed

Publication types