Glass Dynamics and Domain Size in a Solvent-Polymer Weak Gel Measured by Multidimensional Magnetic Resonance Relaxometry and Diffusometry
- PMID: 30822092
- PMCID: PMC6546293
- DOI: 10.1103/PhysRevLett.122.068001
Glass Dynamics and Domain Size in a Solvent-Polymer Weak Gel Measured by Multidimensional Magnetic Resonance Relaxometry and Diffusometry
Abstract
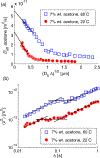
Nuclear magnetic resonance measurements of rotational and translational molecular dynamics are applied to characterize the nanoscale dynamic heterogeneity of a physically cross-linked solvent-polymer system above and below the glass transition temperature. Measured rotational dynamics identify domains associated with regions of solidlike and liquidlike dynamics. Translational dynamics provide quantitative length and timescales of nanoscale heterogeneity due to polymer network cross-link density. Mean squared displacement measurements of the solvent provide microrheological characterization of the system and indicate glasslike caging dynamics both above and below the glass transition temperature.
Figures


Similar articles
-
Probing diffusion dynamics during hydrate formation by high field NMR relaxometry and diffusometry.J Magn Reson. 2019 Jun;303:7-16. doi: 10.1016/j.jmr.2019.04.003. Epub 2019 Apr 4. J Magn Reson. 2019. PMID: 30980965
-
Self-diffusion studies by intra- and inter-molecular spin-lattice relaxometry using field-cycling: Liquids, plastic crystals, porous media, and polymer segments.Prog Nucl Magn Reson Spectrosc. 2017 Aug;101:18-50. doi: 10.1016/j.pnmrs.2017.04.001. Epub 2017 Apr 9. Prog Nucl Magn Reson Spectrosc. 2017. PMID: 28844220 Review.
-
Nuclear magnetic relaxation and diffusion study of the ionic liquids 1-ethyl- and 1-butyl-3-methylimidazolium bis(trifluoromethylsulfonyl)imide confined in porous glass.Magn Reson Chem. 2019 Aug;57(10):818-828. doi: 10.1002/mrc.4852. Epub 2019 Mar 28. Magn Reson Chem. 2019. PMID: 30770585
-
Coupling and decoupling between translational and rotational dynamics in supercooled monodisperse soft Janus particles.Soft Matter. 2019 Apr 17;15(16):3343-3352. doi: 10.1039/c9sm00165d. Soft Matter. 2019. PMID: 30951070
-
NMR Relaxometry Accessing the Relaxation Spectrum in Molecular Glass Formers.Int J Mol Sci. 2022 May 4;23(9):5118. doi: 10.3390/ijms23095118. Int J Mol Sci. 2022. PMID: 35563506 Free PMC article. Review.
Cited by
-
Real-time measurement of diffusion exchange rate in biological tissue.J Magn Reson. 2020 Aug;317:106782. doi: 10.1016/j.jmr.2020.106782. Epub 2020 Jul 8. J Magn Reson. 2020. PMID: 32679514 Free PMC article.
-
Magnetic resonance measurements of cellular and sub-cellular membrane structures in live and fixed neural tissue.Elife. 2019 Dec 12;8:e51101. doi: 10.7554/eLife.51101. Elife. 2019. PMID: 31829935 Free PMC article.
-
An electrochemical cell for in operando 13C nuclear magnetic resonance investigations of carbon dioxide/carbonate processes in aqueous solution.Magn Reson (Gott). 2021 May 6;2(1):265-280. doi: 10.5194/mr-2-265-2021. eCollection 2021. Magn Reson (Gott). 2021. PMID: 37904775 Free PMC article.
-
Experimental and Numerical Investigation on Oil Displacement Mechanism of Weak Gel in Waterflood Reservoirs.Gels. 2022 May 17;8(5):309. doi: 10.3390/gels8050309. Gels. 2022. PMID: 35621607 Free PMC article.
-
Passive water exchange between multiple sites can explain why apparent exchange rate constants depend on ionic and osmotic conditions in gray matter.bioRxiv [Preprint]. 2025 Jul 24:2025.05.27.655493. doi: 10.1101/2025.05.27.655493. bioRxiv. 2025. PMID: 40502053 Free PMC article. Updated. Preprint.
References
-
- Okuzono T, Ozawa K. y., and Doi M, Phys. Rev. Lett. 97, 136103 (2006). - PubMed
-
- Friesen DT, Shanker R, Crew M, Smithey DT, Curatolo WJ, and Nightingale JAS, Mol. Pharmaceutics 5, 1003 (2008). - PubMed
-
- Moller JT and Fredsted S, Chem. Eng. 116, 34 (2009).
-
- van Franeker JJ, Turbiez M, Li W, Wienk MM, and Janssen RAJ, Nat. Commun. 6, 6229 (2015). - PubMed
-
- Boateng JS, Matthews KH, Stevens HNE, and Eccleston GM, J. Pharm. Sci. 97, 2892 (2008). - PubMed
Grants and funding
LinkOut - more resources
Full Text Sources
