. 2019 Mar 1;15(3):e1007931.
doi: 10.1371/journal.pgen.1007931. eCollection 2019 Mar.

Intestinal NF-κB and STAT signalling is important for uptake and clearance in a Drosophila-Herpetomonas interaction model

Affiliations

Intestinal NF-κB and STAT signalling is important for uptake and clearance in a Drosophila-Herpetomonas interaction model

Lihui Wang et al. PLoS Genet. .

Abstract

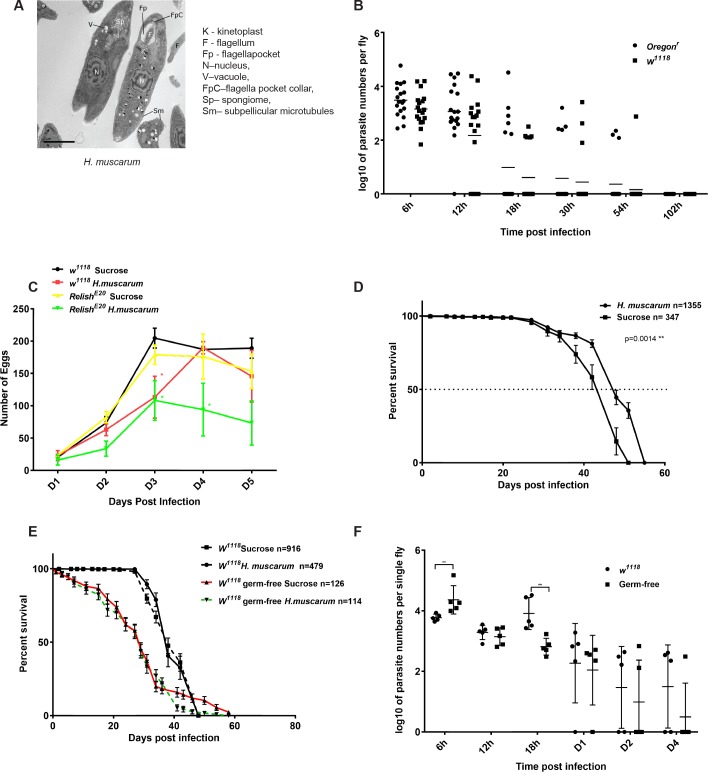
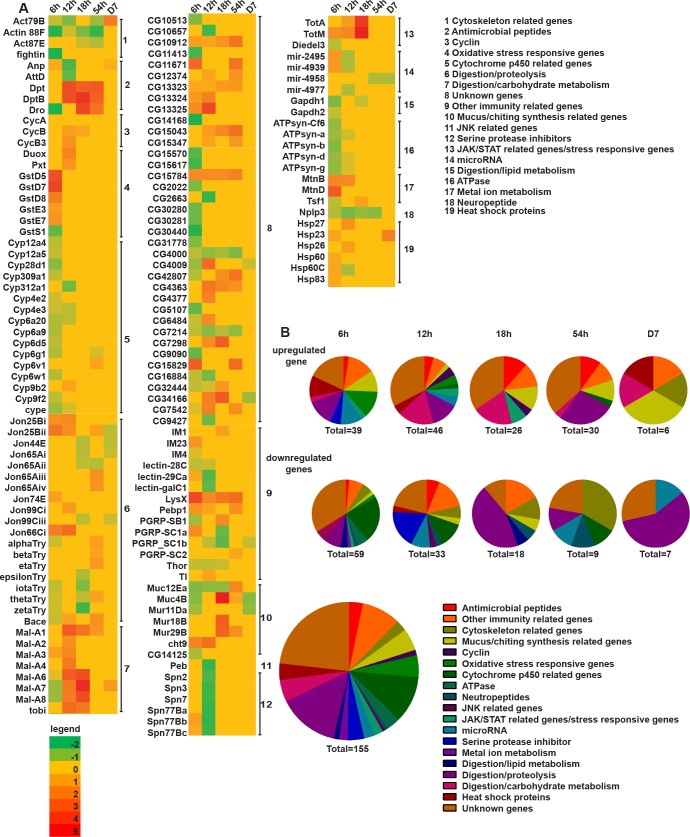
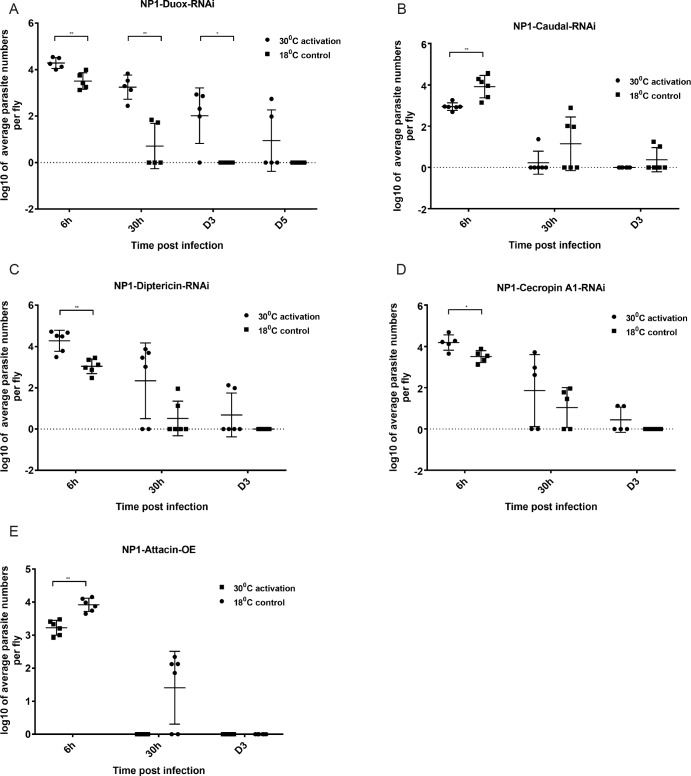
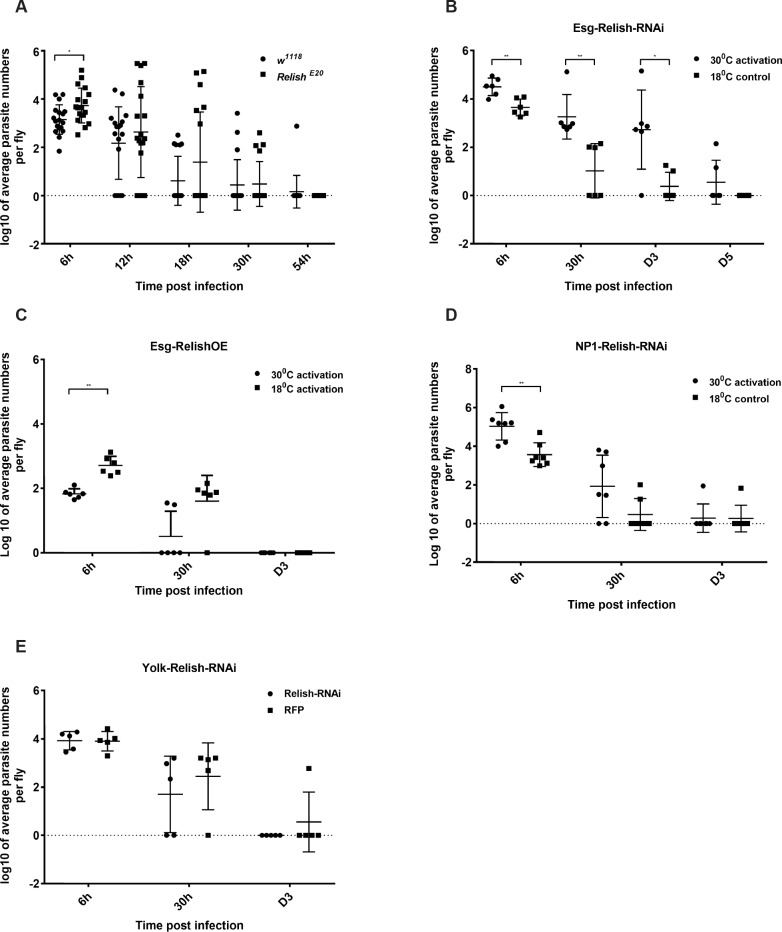
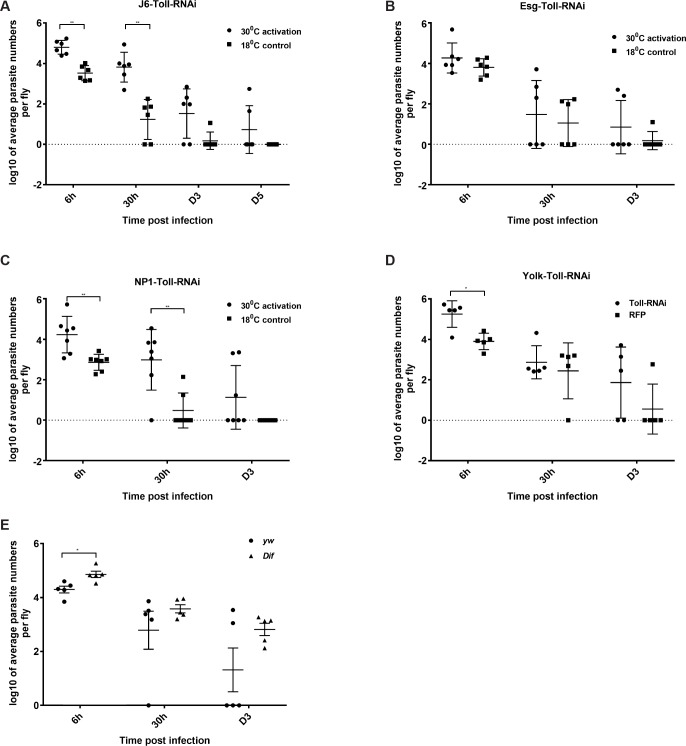
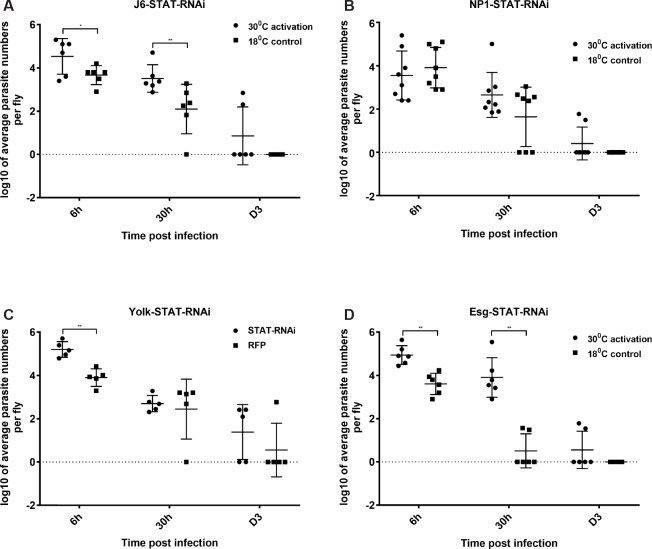
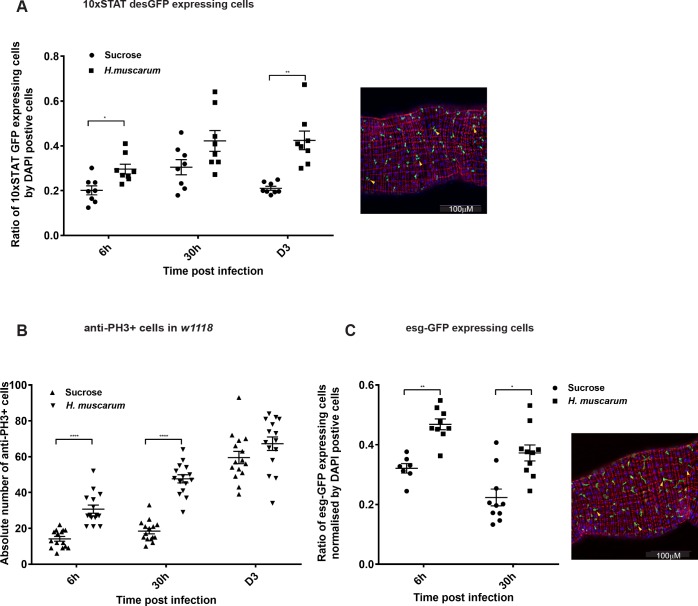
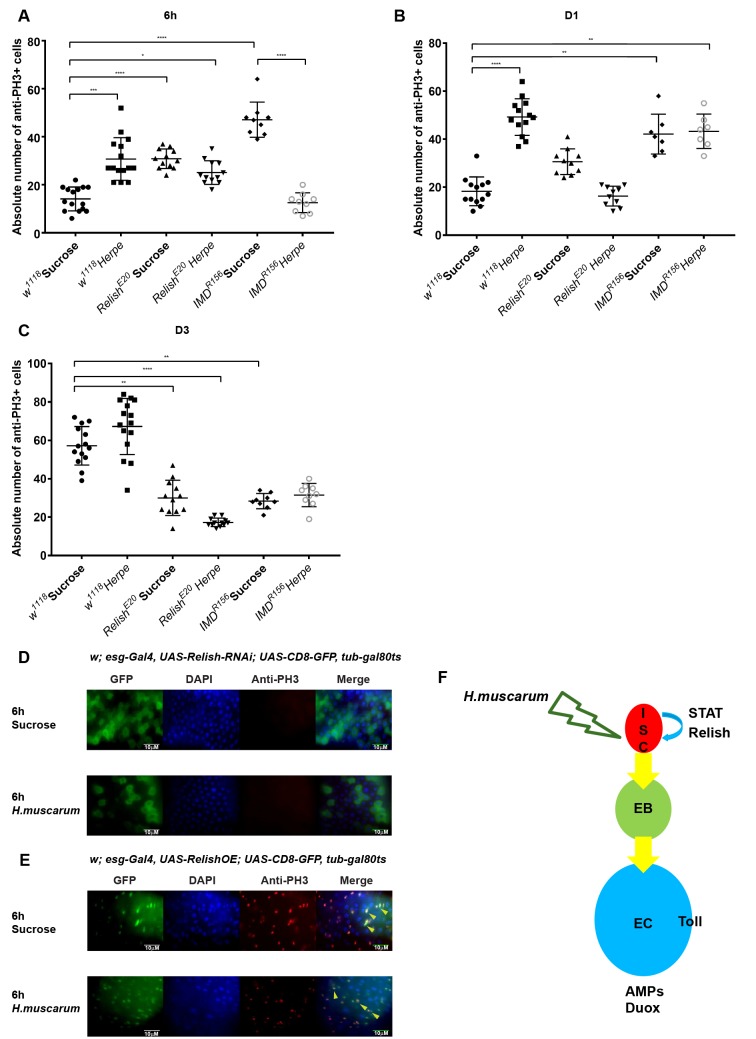
Dipteran insects transmit serious diseases to humans, often in the form of trypanosomatid parasites. To accelerate research in more difficult contexts of dipteran-parasite relationships, we studied the interaction of the model dipteran Drosophila melanogaster and its natural trypanosomatid Herpetomonas muscarum. Parasite infection reduced fecundity but not lifespan in NF-κB/Relish-deficient flies. Gene expression analysis implicated the two NF-κB pathways Toll and Imd as well as STAT signalling. Tissue specific knock-down of key components of these pathways in enterocytes (ECs) and intestinal stem cells (ISCs) influenced initial numbers, infection dynamics and time of clearance. Herpetomonas triggered STAT activation and proliferation of ISCs. Loss of Relish suppressed ISCs, resulting in increased parasite numbers and delayed clearance. Conversely, overexpression of Relish increased ISCs and reduced uptake. Finally, loss of Toll signalling decreased EC numbers and enabled parasite persistence. This network of signalling may represent a general mechanism with which dipteran respond to trypanosomatids.


Conflict of interest statement

The authors have declared that no competing interests exist.

Figures

Fig 1
Fig 1. Infection of Drosophila melanogaster with its natural parasite H.muscarum.
(A) EM of H. muscarum from culture. (B) Both OregonR and w1118 flies took up to 3 days to clear the parasites after an initial 6h oral feeding infection. (C) Fecundity assays of w1118 and w1118; relish flies where infection reduced egg laying in both strains compared to sucrose-only treatment (D) Median and maximum life span of OregonR flies was modestly (but significantly) increased after H. muscarum parasite oral infection compared to sucrose control. (E) Life span of w1118 flies infected with H. muscarum was statistically indistinguishable compared to sucrose-only fed controls either conventionally reared or germ free. (F) In the absence of gut microbiota, more parasite intake was observed during the first 6 hours of infection compared to conventionally reared flies. However, at 18h post-infection germ-free flies exhibited significantly reduced parasite numbers. Two-way ANOVA was used to analyse all data. For fecundity assays, statistical difference was observed on D3 between w1118 sucrose fed controls and w1118 infected flies and on D3 and D4 between RelE20 sucrose fed controls and RelE20 infected flies. On D4, w1118 sucrose fed controls, w1118 infected and RelE20 sucrose fed were statistically indistinguishable and significantly different from RelE20 infected flies.
Fig 2
Fig 2. Host transcriptomics analysis of H. muscarum infection reveals the dynamics and gene networks involved.
(A) Heat map showing the list of significantly regulated transcripts (>log2) compared to the corresponding sucrose control at each time point over the course of parasite infection. The list underlines the systemic temporal and spatial regulatory networks in response to H.muscarum. (B) This can be seen more clearly when the list in A is transformed into a pie chart comparing percentage, gene numbers and gene ontology of transcripts both upregulated and downregulated over the time course of infection.
Fig 3
Fig 3. Influence of Reactive Oxygen Species (ROS) and AMPs on H. muscarum intake, infection dynamics and clearance.
(A) Activation of the GAL4/GAL80ts system and silencing of Duox (needed for ROS production) increased parasite numbers and delayed clearance beyond D5. (B) De-repressing transcription of a number of AMPs by knocking down caudal in ECs, reduced the parasite number intake and shortened the time for the parasites to be cleared. (C) Knocking down in ECs of diptericin (Dpt), a target of IMD pathway, increased the parasite number intake and but not the clearance time. (D). RNAi of the AMP gene Cecropin in ECs (NP1-GAL4) also increased the initial parasite load. (E). In contrast, overexpression of the AMP gene Attacin in ECs cleared parasite infection in less than 30h. Two-way ANOVA was used to analyse all data (*p = 0.1, **p = 0.001, ***p = 0.0001).
Fig 4
Fig 4. The influence of Relish on H. muscarum intake, infection dynamics and clearance in immunocompetent tissues.
(A) Flies with loss of function of Relish (RelishE20), showed significant increase in parasite number intake only at 6h following infection. (B). A significant increase in both parasite numbers and clearance time was observed when Relish was blocked in ISCs. (C) Conversely, overexpression of Relish in ISCs significantly decreased parasite intake. (D) In contrast, a modest increase in parasite number intake was observed when Relish was blocked in ECs while (E) no effect when Relish was blocked in the fat body was observed. Two-way ANOVA was used to analyse all data (*p<0.01, **p<0.001, ***p<0.0001).
Fig 5
Fig 5. The influence of Toll on H. muscarum intake, infection dynamics and clearance in immunocompetent tissues.
(A) Ubiquitous knocking down of Toll significantly increased parasite intake and slowed down clearance. (B) Knocking down of Toll in ISCs did not significantly influence parasite intake or clearance time. (C) In contrast, knocking down of Toll in ECs increased the parasite intake and clearance time. (D) Absence of Toll in the fat body showed significant increase in parasite intake compared to the RFP control. (E) Downstream of Toll, dif flies exhibited significantly increased parasite intake as well as delayed clearance. At the end of the observation period (D3) none of the dif flies had cleared the parasite. Two-way ANOVA was used to analyse all data (*p<0.01, **p<0.001, ***p<0.0001).
Fig 6
Fig 6. JAK-STAT signaling in H.muscarum intake and clearance.
(A) Knocking down of STAT transcription factor in all immunocompetent tissues significantly increased parasite intake and slowed down clearance. (B) In contrast, knocking down STAT in ECs did not influence parasite intake number or clearance time. (C) This was also the case when STAT was knock down in the fat body where only parasite numbers at the earliest time point of 6h were increased. (D) The most significant effect was observed when STAT was silenced in the ISCs, significantly increasing both parasite number intake and clearance time. Two-way ANOVA was used to analyse all data (*p<0.01, **p<0.001, ***p<0.0001).
Fig 7
Fig 7. STAT activation & ISC proliferation following H.muscarum infection.
(A) Increased JAK-STAT activity could be observed and quantified by measuring the GFP-expressing cells in the gut following parasite infection with a reporter line where GFP was under the control of 10 copies of STAT binding sites (10xSTAT-desGFP). A selected region of the midgut at 20x magnification is shown (right panel). Yellow arrows indicate the GFP cells co-localizing with DAPI which were counted. Quantification of GFP expressing cells normalized with DAPI from 12 guts is shown (left panel). Results in the graph are from three independent infections. Following parasite infection, the number of GFP-expressing cells showed significant upregulation at 6h and D1 post infection. (B) The number of proliferating ISCs stained by anti-histone 3 (anti-PH3) antibody in infected w1118 flies, showed significant increase at 6h and 30h post infection. (C) Increased number of ISCs and EBs following parasite infection at day 1, could be observed and quantified by measuring GFP expressing cells in the gut of esg-CD8-GFP, UAS-Gal4, tub-Gal80ts flies after an initial 6-day incubation at 30°C (infection and subsequent culture at 25°C). A selected region of the midgut at 20x magnification is shown (right panel). Yellow arrows indicate counted GFP cells co-localizing with DAPI. Quantification of GFP expressing cells normalized by DAPI from between 7 and 11 guts for each time point and three independent infections is shown in the graph (left panel). Two-way ANOVA was used to analyse all data (*p<0.01, **p<0.001, ***p<0.0001).
Fig 8
Fig 8. ISC proliferation and parasite infection.
ISC proliferation dynamics following H.muscarum infection at 6h (A), Day 1 (B) and Day 2 (C) post-challenge; the parasite was able to suppress ISC proliferation in the absence of Relish (6h, D1 and D3) and to a lesser extend Imd (6h). (D) Relish also played a role in the proliferation of ISCs as loss of Relish blocked ISC proliferation (PH3-red channel) following parasite challenge while (E) Relish overexpression induced ISC proliferation even in the absence of the parasite (see PH3 in sucrose control) (F) A cartoon illustrating a working model of the H. muscarum oral infection model in Drosophila. Both STAT and Relish transcription factors are essential for ISC proliferation and differentiation whereas Toll signaling as well as ROS generation (through Duox) is important in ECs. Parasite infection can also induce Relish-dependent transcription as seen in the upregulation of IMD controlled AMPs. Our hypothesis is that the combinatorial effect from STAT-mediated signaling and Relish-dependent transcription encourages a hyper proliferation of ISCs which eventually results in a fast epithelium turn over in the Drosophila gut. Such a mechanism, together with the expression of effector molecules like AMPs and ROS would be able to remove the parasite quickly and efficiently. Two-way ANOVA was used to analyse all data (*p<0.01, **p<0.001, ***p<0.0001).

Similar articles

Cited by

References

    1. Hotez PJ. (2008) Neglected infections of poverty in the United States of America. PLoS Negl Trop Dis. 2, e256 10.1371/journal.pntd.0000256 - DOI - PMC - PubMed
    1. Hotez PJ. 2009. The neglected tropical diseases and their devastating health and economic impact on the member nations of the Organisation of the Islamic Conference. PLoS Negl Trop Dis. October 27;3(10):e539 10.1371/journal.pntd.0000539 - DOI - PMC - PubMed
    1. Hotez PJ, Pecoul B. "Manifesto" for advancing the control and elimination of neglected tropical diseases. PLoS Negl Trop Dis. 2010. May 25;4(5):e718 10.1371/journal.pntd.0000718 - DOI - PMC - PubMed
    1. Aksoy S, Lehane M and Levashina E (2004) Immune responses and parasite transmission in blood sucking insects Trends Parasitol 20: 433–439 - PubMed
    1. Lehane MJ, Msangi AR (1991) Lectin and peritrophic membrane development in the gut of Glossina m. morsitans and a discussion of their role in protecting the fly against trypanosome infection Med Vet Entomol 5: 495–501. - PubMed

Publication types

MeSH terms

LinkOut - more resources