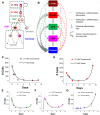
. 2019 Mar 1;14(3):e0212502.
doi: 10.1371/journal.pone.0212502. eCollection 2019.

A computational model of feedback-mediated hematopoietic stem cell differentiation in vitro

Affiliations

A computational model of feedback-mediated hematopoietic stem cell differentiation in vitro

Bhushan Mahadik et al. PLoS One. .

Abstract

Hematopoietic stem cells (HSCs) play an important physiological role as regulators of all blood and immune cell populations, and are of clinical importance for bone marrow transplants. Regulating HSC biology in vitro for clinical applications requires improved understanding of biological inducers of HSC lineage specification. A significant challenge for controlled HSC expansion and differentiation is the complex network of molecular crosstalk between multiple bone marrow niche components influencing HSC biology. We describe a biology-driven computational approach to model cell kinetics in vitro to gain new insight regarding culture conditions and intercellular signaling networks. We further investigate the balance between self-renewal and differentiation that drives early and late hematopoietic progenitor populations. We demonstrate that changing the feedback driven by cell-secreted biomolecules alters lineage specification in early progenitor populations. Using a first order deterministic model, we are able to predict the impact of media change frequency on cell kinetics, as well as distinctions between primitive long-term HSCs and differentiated myeloid progenitors. Integrating the computational model and sensitivity analyses we identify critical culture parameters for regulating HSC proliferation and myeloid lineage specification. Our analysis suggests that accurately modeling the kinetics of hematopoietic sub-populations in vitro requires direct contributions from early progenitor differentiation along with the more traditionally considered intermediary oligopotent progenitors. While consistent with recent in vivo results, this work suggests the need to revise our perspective on HSC lineage engineering in vitro for expansion of discrete hematopoietic populations.


Conflict of interest statement

The authors have declared that no competing interests exist.

Figures
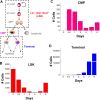
Fig 1
Fig 1. FACS analysis of cell progenitor populations over time.
(A) Schematic of the classical HSC differentiation hierarchy where early progenitors (identified as LSK) differentiate into CMPs before maturing into fully developed myeloid cells (Terminal). (C-D) Total number of each cell sub-population (LSK, CMP, Terminal) in culture over time. While the LSK cells recover some of their numbers, CMP population show variable kinetics but overall low numbers, and Terminal cells grow at an exponential rate. Error bars represent standard error of mean.
Fig 2
Fig 2. Computational set up of a 3-state cell model and experimental verification.
(A) A 3-state computational model featuring the LSK, CMP and Terminal hematopoietic cells. Culture dynamics is influenced via feedback from cell-secreted biomolecules that stimulate and/or inhibit the proliferation and differentiation rates of each cell type. Additionally, a fraction of LSKs would be available to transition directly into Terminal (‘jump’). (B-D) The model simulation is able to capture the dynamics and scale of the experimental data for all 3 cell profiles (B: LSK; C: CMP; D: Terminal). The initial model further predicted a peak in CMP population prior to day 1 of culture. (E-G) Further experiments were performed to capture data before and after the 1 day data point (12hr; 48hr) for all three cell sub-populations (E: LSK; F: CMP; G: Terminal) to substantiate the initial model predictions. Error bars represent standard error of mean.
Fig 3
Fig 3. Model fit and predictions for intermediate media exchange frequencies.
(A—C) Undisturbed culture conditions over the 9 day period (denoted as 10 day), led to a drop in all cell populations as compared to the 2-day media exchange. Model parameters were optimized to obtain a high degree of correlation with experimental data simply by changing media frequency change in the model to 10 days. The model was able to predict the system response to a 5-day media exchange for all the 3 cell populations, without any parameter optimization. Subtle differences in cell numbers were captured over long term culture. Inset: a close up of the model and data fit between days 7–9. Error bars represent standard deviation.
Fig 4
Fig 4. A five state model framework for HSC lineage specification.
(A) A schematic of the classical HSC differentiation hierarchy where long-term progenitors (LT-HSC) differentiate into short-term (ST-HSC) progenitors, then multipotent (MPP), then common myeloid progenitors (CMP) before maturing into fully developed myeloid cells (Terminal). (B) A 5-state computational model featuring the LT-HSC, ST-HSC, MPP, CMP, and Terminal cell types. Culture dynamics may be influenced via feedback from cell-secreted biomolecules that stimulate and/or inhibit the proliferation and differentiation rates of each cell type. Additionally, a fraction of ST-HSCs and MPPs would be available to transition directly into Terminal cells without going through CMP differentiation (‘jump’). (C-G) The model simulation is able to capture the dynamics and scale of the experimental data for all 5 cell profiles (C: LT-HSC; D: ST-HSC; E: MPP; F: CMP; G: Terminal) over a 9 day period. Error bars represent standard deviation.
Fig 5
Fig 5. Parameter sensitivity matrix of the 5-state HSC differentiation model, broken down by cell state (LT-HSC, ST-HSC, MPP, CMP, Terminal) and type of model parameter.
Red nodes in the matrix indicate that model sensitivity is >1% for a 1% change in parameter values. This is indicative of high parameter sensitivity and system instability, but also design parameters for future experimental optimization. Terminal cells, on account of their large and heterogeneous populations, are relatively insensitive to several model parameters except their proliferation rates (PRTermmax).

Similar articles

Cited by

References

    1. Boulais PE, Frenette PS. Making sense of hematopoietic stem cell niches. Blood. 2015;125(17):2621–9. Epub 2015/03/13. 10.1182/blood-2014-09-570192 - DOI - PMC - PubMed
    1. Morrison SJ, Scadden DT. The bone marrow niche for haematopoietic stem cells. Nature. 2014;505(7483):327–34. Epub 2014/01/17. 10.1038/nature12984 . - DOI - PMC - PubMed
    1. Bonig H, Papayannopoulou T. Hematopoietic stem cell mobilization: updated conceptual renditions. Leukemia. 2013;27(1):24–31. Epub 2012/09/07. 10.1038/leu.2012.254 - DOI - PMC - PubMed
    1. Kopp HG, Avecilla ST, Hooper AT, Rafii S. The bone marrow vascular niche: home of HSC differentiation and mobilization. Physiology (Bethesda). 2005;20:349–56. 10.1152/physiol.00025.2005 . - DOI - PubMed
    1. Lai CY, Yamazaki S, Okabe M, Suzuki S, Maeyama Y, Iimura Y, et al. Stage-specific roles for CXCR4 signaling in murine hematopoietic stem/progenitor cells in the process of bone marrow repopulation. Stem Cells. 2014;32(7):1929–42. Epub 2014/02/11. 10.1002/stem.1670 . - DOI - PubMed

Publication types