. 2019 Jul:317:66-77.
doi: 10.1016/j.expneurol.2019.01.014. Epub 2019 Feb 26.

Caffeine inhibits hypoxia-induced nuclear accumulation in HIF-1α and promotes neonatal neuronal survival

Affiliations

Caffeine inhibits hypoxia-induced nuclear accumulation in HIF-1α and promotes neonatal neuronal survival

Hsiu-Ling Li et al. Exp Neurol. 2019 Jul.

Abstract

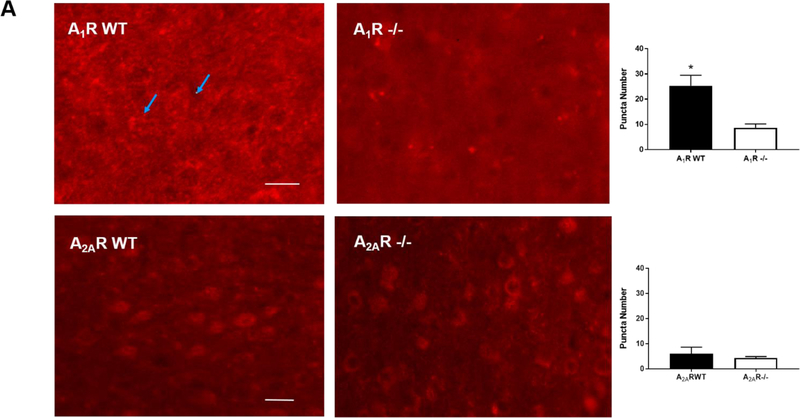
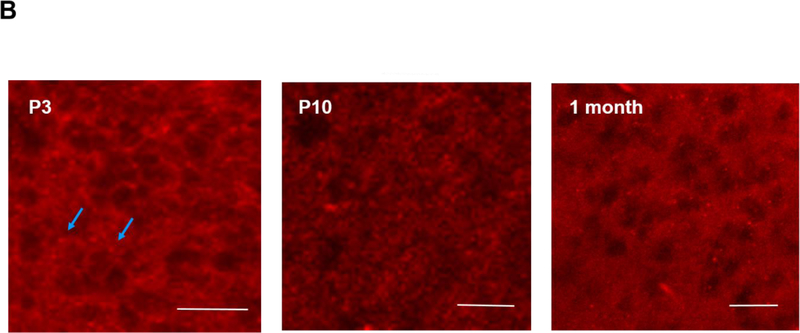
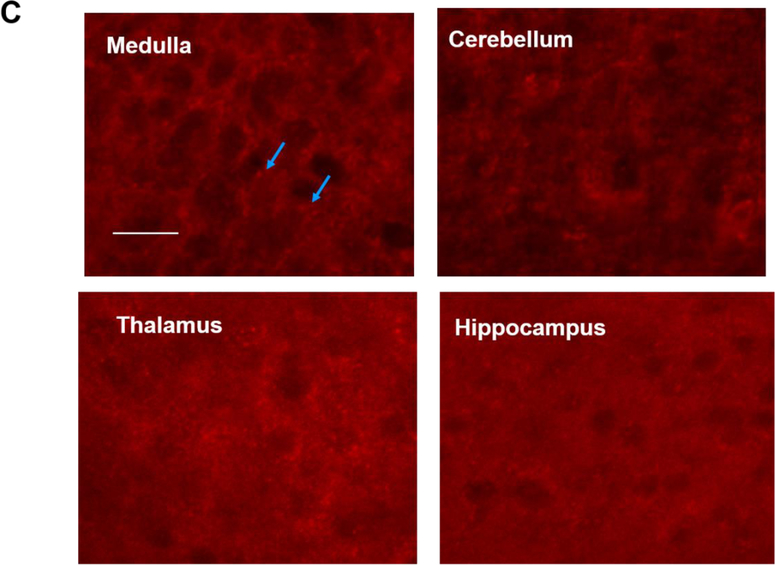
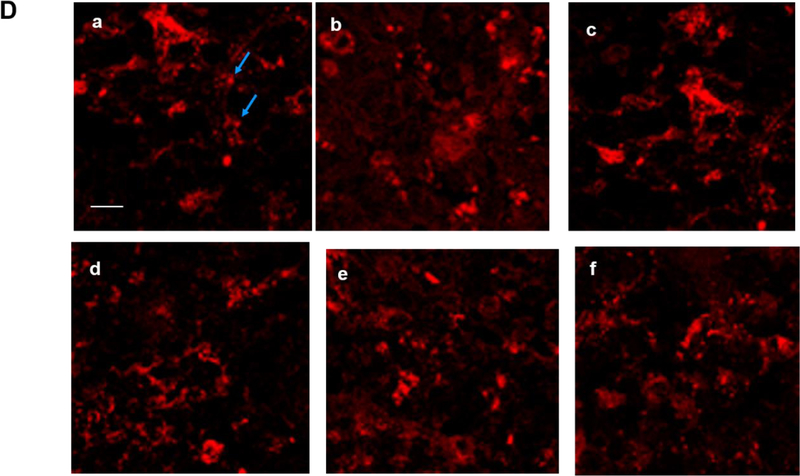
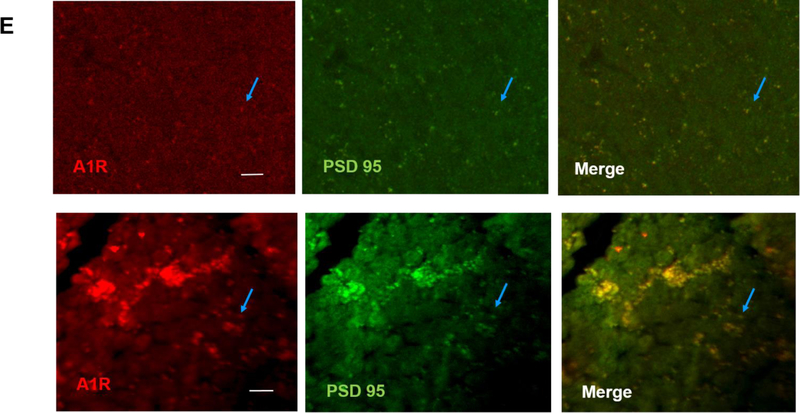
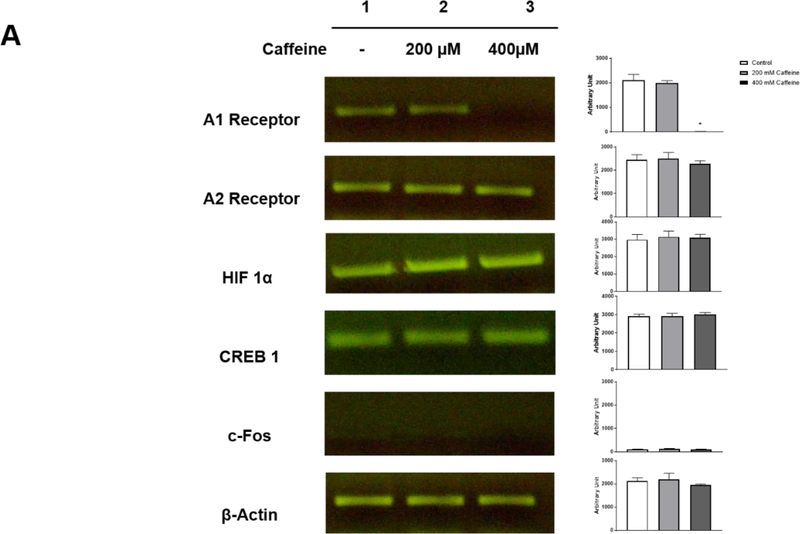
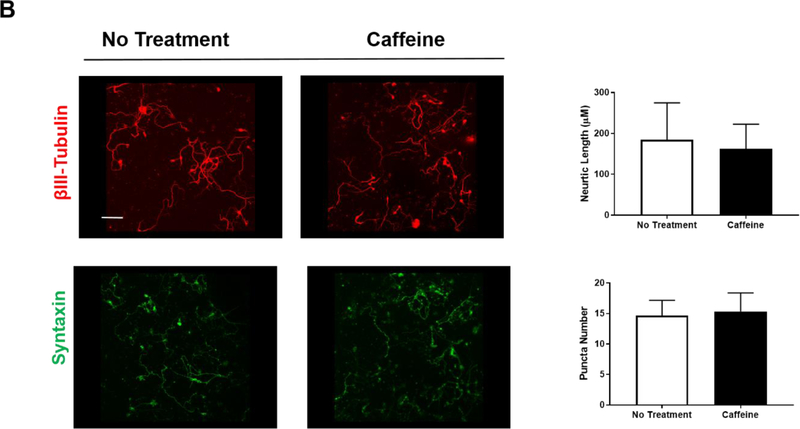
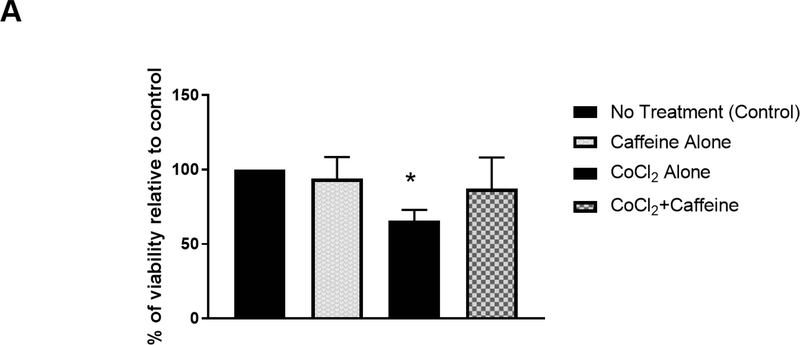
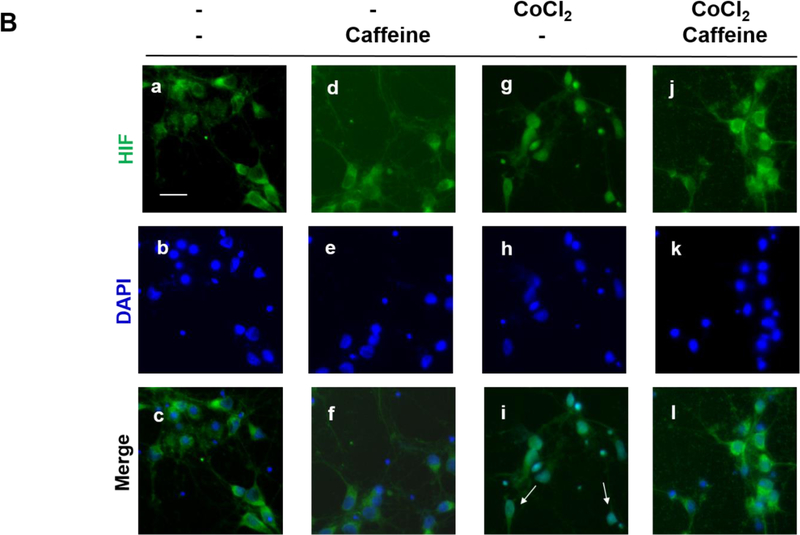
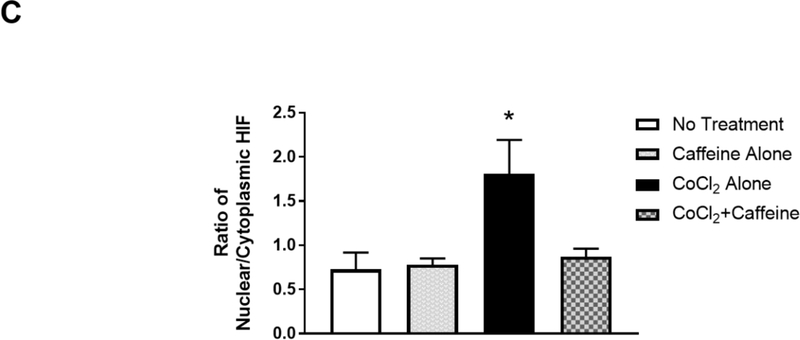
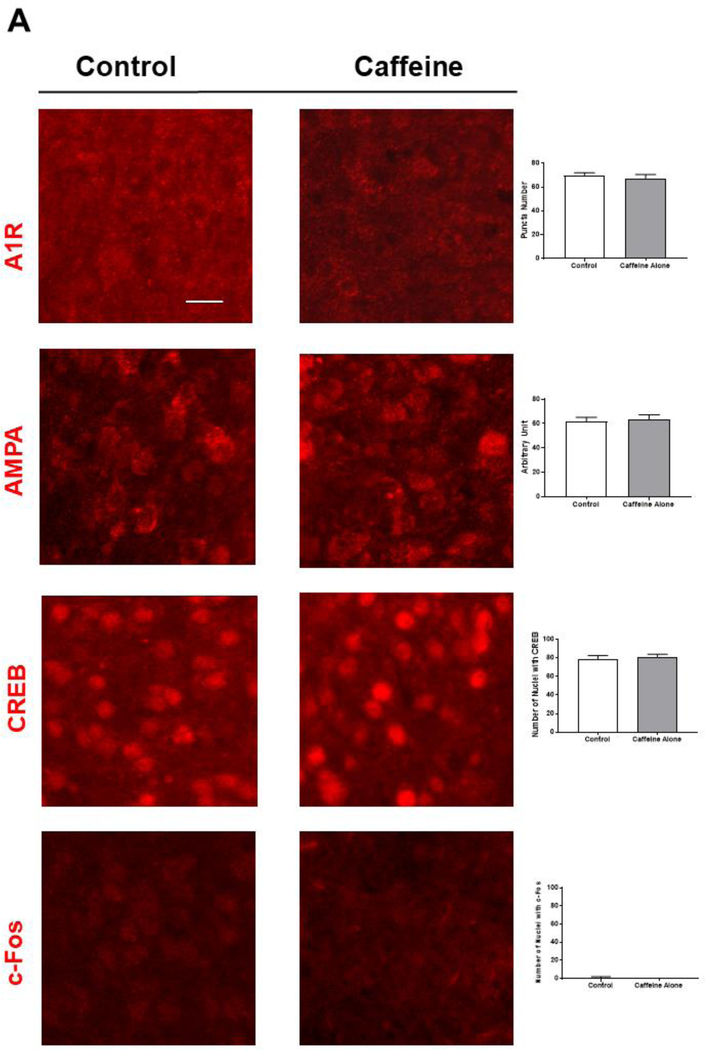
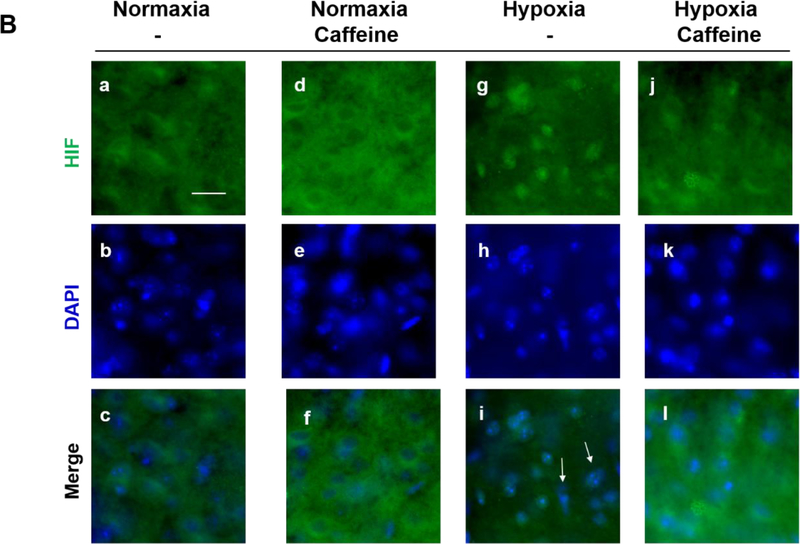
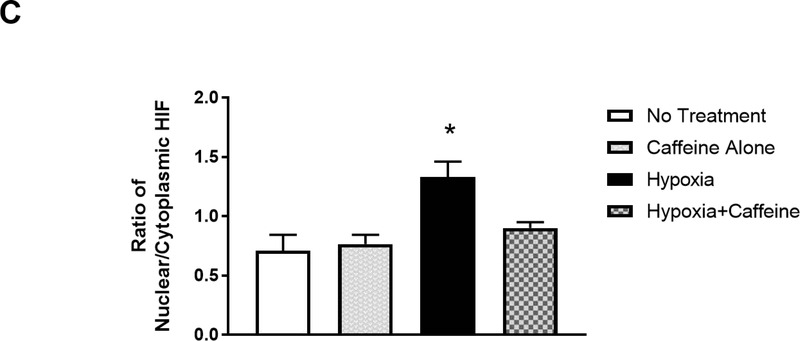
Apnea of prematurity (AOP) defined as cessation of breathing for 15-20 s, is commonly seen in preterm infants. Caffeine is widely used to treat AOP due to its safety and effectiveness. Caffeine releases respiratory arrest by competing with adenosine for binding to adenosine A1 and A2A receptors (A1R and A2AR). Long before its use in treating AOP, caffeine has been used as a psychostimulant in adult brains. However, the effect of caffeine on developing brains remains unclear. We found that A1R proteins for caffeine binding were expressed in the brains of neonatal rodents and preterm infants (26-27 weeks). Neonatal A1R proteins colocalized with PSD-95, suggesting its synaptic localization. In contrast, our finding on A2R expression in neonatal neurons was restricted to the mRNA level as detected by single cell RT/PCR due to the lack of specific A2AR antibody. Furthermore, caffeine (200 μM) at a dose twice higher than the clinically relevant dose (36-130 μM) had minor or no effects on several basic neuronal functions, such as neurite outgrowth, synapse formation, expression of A1R and transcription of CREB-1 and c-Fos, further supporting the safety of caffeine for clinical use. We found that treatment with CoCl2 (125 μM), a hypoxia mimetic agent, for 24 h triggered neuronal death and nuclear accumulation of HIF-1α in primary neuronal cultures. Subsequent treatment with caffeine at a concentration of 100 μM alleviated CoCl2-induced cell death and prevented nuclear accumulation of HIF-1α. Consistently, caffeine treatment in early postnatal life of neonatal mice (P4-P7) also prevented subsequent hypoxia-induced nuclear increase of HIF-1α. Together, our data support the utility of caffeine in alleviating hypoxia-induced damages in developing neurons.


Conflict of interest statement

Conflict of Interest

All authors have read the journal’s policy on disclosure of potential conflicts of interest and have none to declare. This study was supported by two non-profit foundations. The funders played no role in the design and conclusion of this study.

Figures

Figure 1.
Figure 1.
The brains of neonatal mice and preterm infants expressed A1R receptors. (A) Immunostaining results showed the specificity of A1R antibody but not A2AR antibody. Using the tested A1R antibody, A1R immunostaining showed a punctate distribution of this receptor in the cortex of wild type adult mice, but not in that of A1R deficient mice (25.33±2.4 and 8.67±0.88 puncta, respectively) (top). In contrast, several antibodies against A2AR showed non-specific immunoreactivity in the nucleus and the cytoplasm in both wild type and A2AR deficient mice (bottom). No punctate pattern was observed (6±1.53 puncta for WT and 4.33±0.3 puncta for A2AR knockout). Representative images are shown here. The quantitative results are shown on the right. Blue arrows indicate puncta. Scale bar, 10 μm. (B) The punctate pattern of A1R could be detected in the cortex of P3 pups. The A1R puncta appeared more discrete at a lower magnification as the animals mature (10 day-old and 1 month-old pups). (C) A1R distributed in a punctate pattern in medulla, cerebellum, thalamus and hippocampus. The puncta were more prominent in medulla and cerebellum. Scale bar, 20 μm. (D) Immunostaining showed a punctate pattern of A1R in the cortex of preterm infants at the corrected age of 26–27 weeks. Representative images of the cortex from 6 preterm brains are shown. Scale bar, 10 μm. (E) A1R colocalized with a synaptic protein, PSD-95, in frozen sections of neonatal mouse brain (upper panel) and paraffin sections of preterm infant brains (lower panel). Scale bar, 20 μm.
Figure 1.
Figure 1.
The brains of neonatal mice and preterm infants expressed A1R receptors. (A) Immunostaining results showed the specificity of A1R antibody but not A2AR antibody. Using the tested A1R antibody, A1R immunostaining showed a punctate distribution of this receptor in the cortex of wild type adult mice, but not in that of A1R deficient mice (25.33±2.4 and 8.67±0.88 puncta, respectively) (top). In contrast, several antibodies against A2AR showed non-specific immunoreactivity in the nucleus and the cytoplasm in both wild type and A2AR deficient mice (bottom). No punctate pattern was observed (6±1.53 puncta for WT and 4.33±0.3 puncta for A2AR knockout). Representative images are shown here. The quantitative results are shown on the right. Blue arrows indicate puncta. Scale bar, 10 μm. (B) The punctate pattern of A1R could be detected in the cortex of P3 pups. The A1R puncta appeared more discrete at a lower magnification as the animals mature (10 day-old and 1 month-old pups). (C) A1R distributed in a punctate pattern in medulla, cerebellum, thalamus and hippocampus. The puncta were more prominent in medulla and cerebellum. Scale bar, 20 μm. (D) Immunostaining showed a punctate pattern of A1R in the cortex of preterm infants at the corrected age of 26–27 weeks. Representative images of the cortex from 6 preterm brains are shown. Scale bar, 10 μm. (E) A1R colocalized with a synaptic protein, PSD-95, in frozen sections of neonatal mouse brain (upper panel) and paraffin sections of preterm infant brains (lower panel). Scale bar, 20 μm.
Figure 2.
Figure 2.
(A) Treatment with 200 μM caffeine has minimal/no effect on the transcription of A1R and A2AR, HIF-1α, CREB-1 or c-Fos in vitro. Single cell RT/PCR was performed on neuronal culture that were treated with or without caffeine for 5 days (n=10). The intensities of the RT-PCR bands were quantified by densitometry in arbitrary units. The results of control and caffeine groups are as follows: A1R (2104±138, 2000±136), A2AR (2446±130, 2500±150), HIF-1α (2978±17.5, 3141±19.3), CREB-1 (2928±64, 2933±88) and c-Fos (105±7.5, 132±7.6). The levels of β-actin were used as a loading control. The transcription levels of CREB-1 and HIF-1α were discernible, but the level of c-Fos was barely detectable. A high dose of caffeine (400 μM) selectively decreased the transcription of A1R (36±0.3, p<0.001) but not other tested factors. (B) Treatment with 200 μM caffeine did not affect neurite length (beta-III tubulin, red) (184.9±27.16 μm for control and 162.1±17.45 μm for caffeine treatment group) and synapse formation (syntaxin, green) (14.67±1.45 for control and 15.33±1.76 for caffeine treatment group). The quantitative results are shown on the right. Scale bar, 100 μm (n=5).
Figure 2.
Figure 2.
(A) Treatment with 200 μM caffeine has minimal/no effect on the transcription of A1R and A2AR, HIF-1α, CREB-1 or c-Fos in vitro. Single cell RT/PCR was performed on neuronal culture that were treated with or without caffeine for 5 days (n=10). The intensities of the RT-PCR bands were quantified by densitometry in arbitrary units. The results of control and caffeine groups are as follows: A1R (2104±138, 2000±136), A2AR (2446±130, 2500±150), HIF-1α (2978±17.5, 3141±19.3), CREB-1 (2928±64, 2933±88) and c-Fos (105±7.5, 132±7.6). The levels of β-actin were used as a loading control. The transcription levels of CREB-1 and HIF-1α were discernible, but the level of c-Fos was barely detectable. A high dose of caffeine (400 μM) selectively decreased the transcription of A1R (36±0.3, p<0.001) but not other tested factors. (B) Treatment with 200 μM caffeine did not affect neurite length (beta-III tubulin, red) (184.9±27.16 μm for control and 162.1±17.45 μm for caffeine treatment group) and synapse formation (syntaxin, green) (14.67±1.45 for control and 15.33±1.76 for caffeine treatment group). The quantitative results are shown on the right. Scale bar, 100 μm (n=5).
Figure 3.
Figure 3.
Caffeine promoted cell survival after hypoxia and decreased CoCl2-induced nuclear accumulation of HIF-1α in vitro. (A) Primary cortical neuronal cultures were treated with CoCl2 or vehicle (control) for 24 h. Each group was divided into two subgroups that were either treated with 100 μM caffeine or vehicle for an additional 24 h. The viability of each treatment group was subsequently measured by MTT assays. Data are presented as percentage of viability in each group relative to that of the control group (control, 100%; caffeine alone, 94±7.1%; CoCl2 treatment, 65.6±3.6%; CoCl2+caffeine, 87.2±10.5% n=4. p<0.001). (B) Treated neurons were double-immunostained to label HIF-1α (green, top row) and neuron-specific beta-III tubulin (red, not shown) and counter-stained with DAPI for nuclei (blue, middle row). The merged images of HIF-1α and DAPI are shown in the bottom row. Beta-III tubulin immunostaining (not shown) was used as a neuronal marker. In the absence of CoCl2, HIF-1α was primarily localized in the cytoplasm regardless of whether neurons received caffeine or not (Lane 1, a, b, c and Lane 2, d, e, f). In contrast, CoCl2 triggered nuclear co-localization of HIF-1α with DAPI (Lane 3, g.h.i), suggesting nuclear accumulation of HIF-1α. White arrows indicate co-localization of HIF-1α and DAPI. This nuclear accumulation of HIF-1α was alleviated by subsequent treatment with caffeine (Lane 4, j, k,l). Scale bar, 20 μm. (C) Quantification of the ratio of nuclear vs cytoplasmic HIF-1α in neurons of each treatment group (control, 0.73±0.07; caffeine alone, 0.78±0.03; CoCl2 treatment, 1.81±0.17, CoCl2 and caffeine, 0.82±0.04, p<0.001, n=5).
Figure 3.
Figure 3.
Caffeine promoted cell survival after hypoxia and decreased CoCl2-induced nuclear accumulation of HIF-1α in vitro. (A) Primary cortical neuronal cultures were treated with CoCl2 or vehicle (control) for 24 h. Each group was divided into two subgroups that were either treated with 100 μM caffeine or vehicle for an additional 24 h. The viability of each treatment group was subsequently measured by MTT assays. Data are presented as percentage of viability in each group relative to that of the control group (control, 100%; caffeine alone, 94±7.1%; CoCl2 treatment, 65.6±3.6%; CoCl2+caffeine, 87.2±10.5% n=4. p<0.001). (B) Treated neurons were double-immunostained to label HIF-1α (green, top row) and neuron-specific beta-III tubulin (red, not shown) and counter-stained with DAPI for nuclei (blue, middle row). The merged images of HIF-1α and DAPI are shown in the bottom row. Beta-III tubulin immunostaining (not shown) was used as a neuronal marker. In the absence of CoCl2, HIF-1α was primarily localized in the cytoplasm regardless of whether neurons received caffeine or not (Lane 1, a, b, c and Lane 2, d, e, f). In contrast, CoCl2 triggered nuclear co-localization of HIF-1α with DAPI (Lane 3, g.h.i), suggesting nuclear accumulation of HIF-1α. White arrows indicate co-localization of HIF-1α and DAPI. This nuclear accumulation of HIF-1α was alleviated by subsequent treatment with caffeine (Lane 4, j, k,l). Scale bar, 20 μm. (C) Quantification of the ratio of nuclear vs cytoplasmic HIF-1α in neurons of each treatment group (control, 0.73±0.07; caffeine alone, 0.78±0.03; CoCl2 treatment, 1.81±0.17, CoCl2 and caffeine, 0.82±0.04, p<0.001, n=5).
Figure 4.
Figure 4.
Caffeine blocked hypoxia-induced nuclear accumulation of HIF1-α in vivo. (A) Immunostaining for A1R, AMPA receptors, CREB-1 and c-Fos showed that caffeine treatment has minimal/no effect on the expression of these factors in neonatal cortex (n=5). Scale bar, 20 μm. The quantitative results in control and caffeine-treated groups are shown on the right; the number of A1R (70±1.15, 67.3±1.86) or AMPA receptor puncta (67.6±2, 63.6±2), the number of nuclear CREB-1 (79±2.1, 81.3±1.5) or c-Fos (1±0.58, 1±0.01). (B) Neonatal mouse pups were gavage fed with caffeine or vehicle from P4-P7. Subsequently, pups were placed under normoxic (room air) or hypoxic (8% O2) conditions for 20 min prior to cardiac perfusion and isolation of their brains. Brain sections were immunostained with anti-HIF-1α (green, top row) and counter-stained with DAPI to show nuclei (blue, middle row). The overlaid images of HIF-1α immunostaining and DAPI staining are shown in the bottom row. Representative cortical images are shown here. Under normoxic conditions, HIF-1α primarily distributed in the cytoplasm of cortical neurons whether mouse pups received caffeine therapy or not (Lane 1, a. b. c. and Lane 2, d, e, f). In pups without caffeine therapy, hypoxia induced nuclear accumulation of HIF-1α (Lane 3, g, h, i). White arrows indicate co-localization of HIF-1α and DAPI. Pre-treatment with caffeine prevented subsequent hypoxia-induced nuclear accumulation of HIF-1α in neonatal cortex (Lane 4, j, k, l). Scale bar, 20 μm. (C) Quantification of the ratio of nuclear vs cytoplasmic HIF-1α in neonatal cortex in each group (control, 0.71±0.05; caffeine alone, 0.77±0.03; hypoxia, 1.33±0.05; hypoxia and caffeine, 0.9±0.02, p<0.001, n=5)
Figure 4.
Figure 4.
Caffeine blocked hypoxia-induced nuclear accumulation of HIF1-α in vivo. (A) Immunostaining for A1R, AMPA receptors, CREB-1 and c-Fos showed that caffeine treatment has minimal/no effect on the expression of these factors in neonatal cortex (n=5). Scale bar, 20 μm. The quantitative results in control and caffeine-treated groups are shown on the right; the number of A1R (70±1.15, 67.3±1.86) or AMPA receptor puncta (67.6±2, 63.6±2), the number of nuclear CREB-1 (79±2.1, 81.3±1.5) or c-Fos (1±0.58, 1±0.01). (B) Neonatal mouse pups were gavage fed with caffeine or vehicle from P4-P7. Subsequently, pups were placed under normoxic (room air) or hypoxic (8% O2) conditions for 20 min prior to cardiac perfusion and isolation of their brains. Brain sections were immunostained with anti-HIF-1α (green, top row) and counter-stained with DAPI to show nuclei (blue, middle row). The overlaid images of HIF-1α immunostaining and DAPI staining are shown in the bottom row. Representative cortical images are shown here. Under normoxic conditions, HIF-1α primarily distributed in the cytoplasm of cortical neurons whether mouse pups received caffeine therapy or not (Lane 1, a. b. c. and Lane 2, d, e, f). In pups without caffeine therapy, hypoxia induced nuclear accumulation of HIF-1α (Lane 3, g, h, i). White arrows indicate co-localization of HIF-1α and DAPI. Pre-treatment with caffeine prevented subsequent hypoxia-induced nuclear accumulation of HIF-1α in neonatal cortex (Lane 4, j, k, l). Scale bar, 20 μm. (C) Quantification of the ratio of nuclear vs cytoplasmic HIF-1α in neonatal cortex in each group (control, 0.71±0.05; caffeine alone, 0.77±0.03; hypoxia, 1.33±0.05; hypoxia and caffeine, 0.9±0.02, p<0.001, n=5)

References

    1. Aden U, 2011. Methylxanthines during pregnancy and early postnatal life. Handb Exp Pharmacol, 373–389. - PubMed
    1. Aden U, Herlenius E, Tang LQ, Fredholm BB, 2000. Maternal caffeine intake has minor effects on adenosine receptor ontogeny in the rat brain. Pediatr Res 48, 177–183. - PubMed
    1. Aden U, Leverin AL, Hagberg H, Fredholm BB, 2001. Adenosine A(1) receptor agonism in the immature rat brain and heart. Eur J Pharmacol 426, 185–192. - PubMed
    1. Back SA, Craig A, Luo NL, Ren J, Akundi RS, Ribeiro I, Rivkees SA, 2006. Protective effects of caffeine on chronic hypoxia-induced perinatal white matter injury. Ann Neurol 60, 696–705. - PubMed
    1. Bairam A, Boutroy MJ, Badonnel Y, Vert P, 1987. Theophylline versus caffeine: comparative effects in treatment of idiopathic apnea in the preterm infant. J Pediatr 110, 636–639. - PubMed

Publication types