. 2019 Jun;1867(6):645-653.
doi: 10.1016/j.bbapap.2019.02.002. Epub 2019 Feb 27.

Inhibition of ricin A-chain (RTA) catalytic activity by a viral genome-linked protein (VPg)

Affiliations

Inhibition of ricin A-chain (RTA) catalytic activity by a viral genome-linked protein (VPg)

Valentina R Aitbakieva et al. Biochim Biophys Acta Proteins Proteom. 2019 Jun.

Abstract

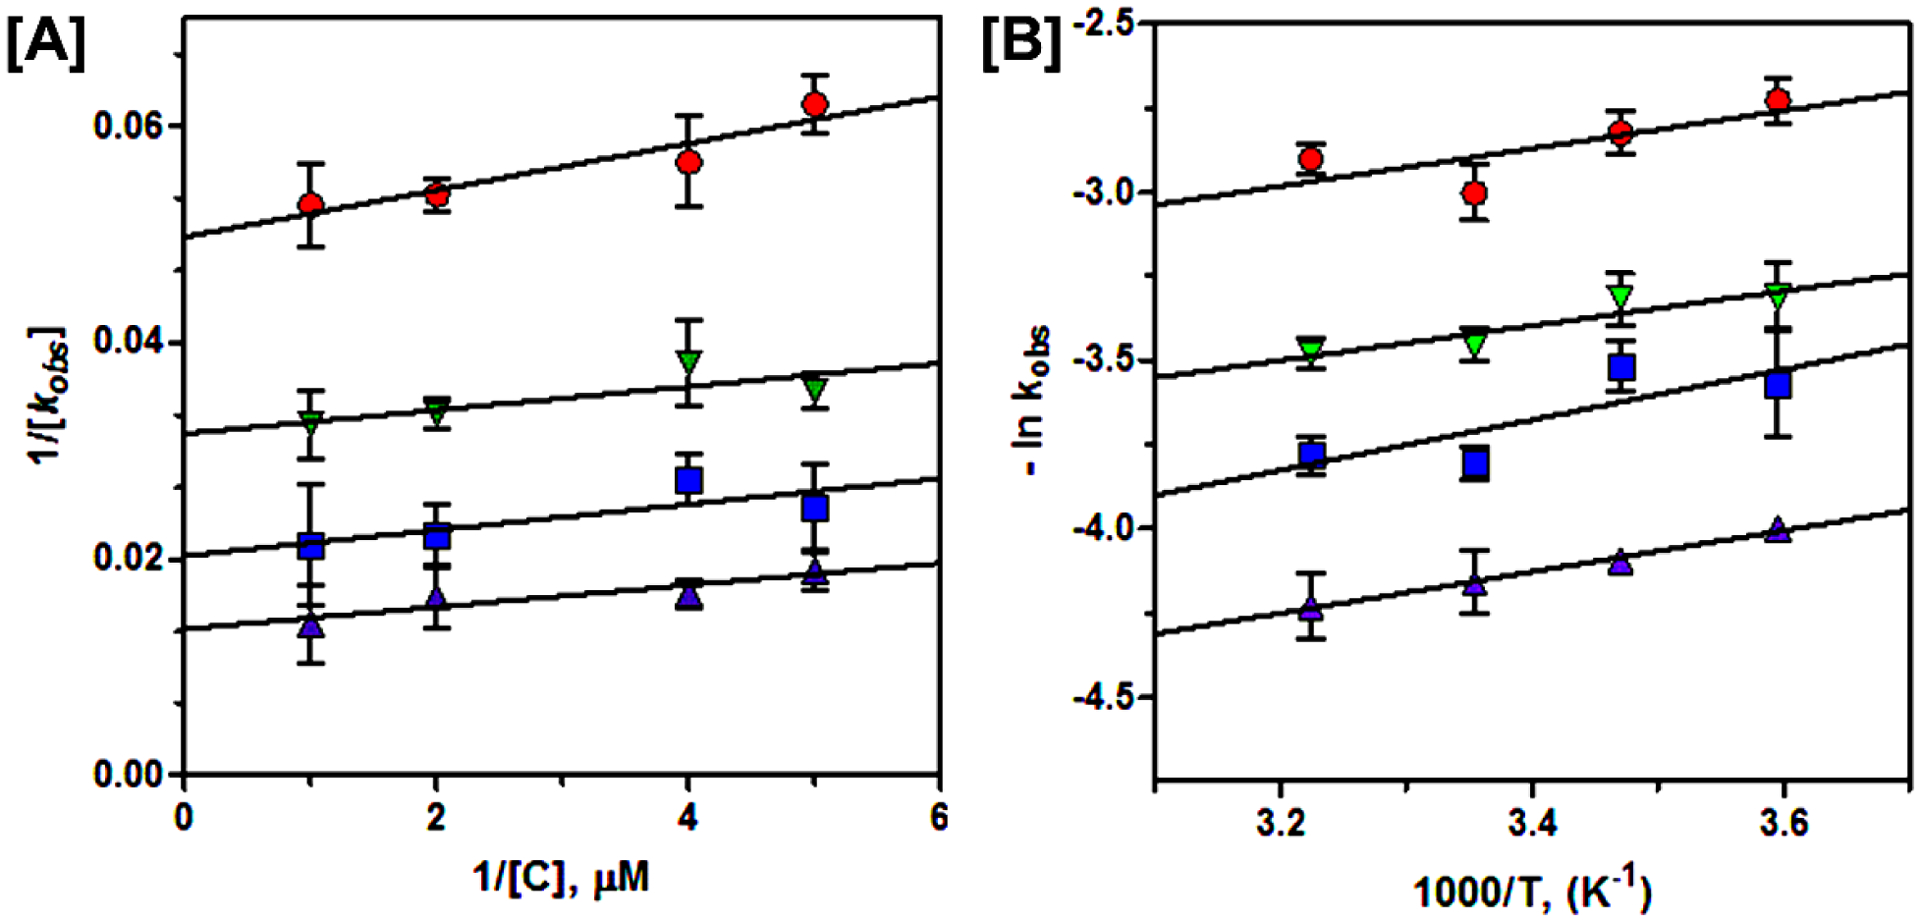
Ricin is a plant derived protein toxin produced by the castor bean plant (Ricinus communis). The Centers for Disease Control (CDC) classifies ricin as a Category B biological agent. Currently, there is neither an effective vaccine that can be used to protect against ricin exposure nor a therapeutic to reverse the effects once exposed. Here we quantitatively characterize interactions between catalytic ricin A-chain (RTA) and a viral genome-linked protein (VPg) from turnip mosaic virus (TuMV). VPg and its N-terminal truncated variant, VPg1-110, bind to RTA and abolish ricin's catalytic depurination of 28S rRNA in vitro and in a cell-free rabbit reticulocyte translational system. RTA and VPg bind in a 1 to 1 stoichiometric ratio, and their binding affinity increases ten-fold as temperature elevates (5 °C to 37 °C). RTA-VPg binary complex formation is enthalpically driven and favored by entropy, resulting in an overall favorable energy, ΔG = -136.8 kJ/mol. Molecular modeling supports our experimental observations and predicts a major contribution of electrostatic interactions, suggesting an allosteric mechanism of downregulation of RTA activity through conformational changes in RTA structure, and/or disruption of binding with the ribosomal stalk. Fluorescence anisotropy studies show that heat affects the rate constant and the activation energy for the RTA-VPg complex, Ea = -62.1 kJ/mol. The thermodynamic and kinetic findings presented here are an initial lead study with promising results and provides a rational approach for synthesis of therapeutic peptides that successfully eliminate toxicity of ricin, and other cytotoxic RIPs.

Keywords: Depurination; Fluorescence; Genome-linked viral protein (VPg); Protein-protein interactions; Ribosome inactivating protein (RIP); Ricin A-chain (RTA).


Figures

Figure 1.
Figure 1.. Effects of VPg peptides on catalytic activity of RTA towards ribosomes.
RTA concentration in all reactions was 200 nM. Controls: (1) (+) RTA / (−) VPg / (+) Ribosomes; (2) (−) RTA / (−) VPg / (+) Ribosomes; (3) (+) RTA / (−) VPg / (−) Ribosomes; wt VPg: (4) 50 nM VPg; (5) 100 nM VPg; (6) 200 nM VPg; VPg-71: (7) 50 nM VPg; (8) 100 nM VPg; (9) 200 nM VPg; VPg-111: (10) 50 nM VPg; (11) 100 nM VPg; (12) 200 nM VPg; VPg1–110: (13) 50 nM VPg; (14) 100 nM VPg; (15) 200 nM VPg.
Figure 2.
Figure 2.. Translation of TEV RNA luciferase reporter gene in rabbit reticulocyte extracts.
Luciferase relative light units (RLU) were measured for TEV(1–143)-luc-A50 RNA (-●-),TEV(1–143)-luc-A50 RNA + RTA (--), TEV(1–143)-luc-A50 RNA + RTA + wt VPg (--), TEV(1–143)-luc-A50 RNA + RTA + VPg-71 (-×-), TEV(1–143)-luc-A50 RNA + RTA + VPg-111 (--), and TEV(1–143)-luc-A50 RNA + RTA + VPg1–110 after 30 sec (--) in rabbit reticulocyte translational extract as a fuction of time. The proteins were added in the stoichiometric concentrations (10 nM) in the presence of 1.0 μg of TEV(1–143)-luc-A50 RNA, and light emission was measured after the addition of 0.5 mM luciferase substrate.
Figure 3.
Figure 3.. Binding plots of RTA (200 nM) with VPg peptides.
The values of ΔF / ΔFmax for WT VPg (--), VPg-71 (--), VPg-111 (--), and synthetic VPg1–110 (--) versus concentration of VPg peptides at 25 °C. The curves were fit to obtain equilibrium constants as described under Methods.
Figure 4.
Figure 4.. Temperature dependence of fluorescein-labeled RTA-VPg1–110 interactions.
The normalized fluorescence values (λex = 495 nm and λem = 516 nm) for the reaction of the bound ligand (VPg1–110) (ΔFFmax) are plotted versus VPg1–110 concentration at 5 °C (−−), 15 °C (−−), 25 °C (−−), and 37 °C (−−). Fluorescein-labeled RTA concentration was 200 nM in titration buffer. The curves were fit to obtain dissociation constants (Kd) as described under Methods. The inset shows van’t Hoff plot for the interactions of fluorescein-labeled RTA with VPg1–110 peptide.
Figure 5.
Figure 5.. Kinetic studies of RTA depurinating 28S rRNA, and the effects of VPg peptides on the rates of the depurination.
(A) Time course curves of adenine released during depurination of the rRNA in the absence (--) and presence of VPg (wt VPg, --; VPg-71, --; VPg-111, --; VPg1–110, --) by RTA, as measured by the fluorescence of N6-ethenoadenine. The controls of the studies included depurination of poly(C) RNA (-×-) by RTA. Aliquots of RTA-rRNA mixtures (± VPg) were withdrawn at different times, and loaded onto the HPLC column (excitation and emission wavelengths were 315 nm and 415 nm, respectively). (B) N6-Ethenoadenine assay kinetic curve for the depurination catalysis of 28S rRNA in the absence (--) and presence of VPg (wt VPg, --; VPg-71, --; VPg-111, --; VPg1–110, --) by RTA. Controls included samples where the rRNA was substituted for poly(C) RNA (-x-). Each reaction included a sample of RTA (200 nM), treated with the increasing concentrations of RNA, and the amounts of the released adenines were modified, as described under Experimental Procedures.
Figure 6.
Figure 6.. Stopped-flow kinetic binding measurements of fluorescein-labeled RTA and VPg1–110 peptide.
Representative kinetic data show the time dependent decrease in anisotropy after mixing 50 nM fluorescein-labeled RTA [A] (final concentration) with 0.2 μM unlabeled VPg peptides ([B], wild type VPg; [C], VPg-71; [D], VPg-111; and [E], VPg1–110) (final concentration) at 25 °C. Residuals for the fits are shown in the lower panels. The experimental conditions are described under Experimental Procedures.
Figure 7.
Figure 7.
[A] Kinetic plots of 1/kobs versus 1/[C] for the interaction of 200 nM fluorescein-labeled RTA with varying concentrations of wt VPg (--), VPg-71 (--), VPg-111 (--), and VPg1–110 (--) peptides. The rate constant k2 was obtained as the reciprocal of the y-intercept. [B] Arrhenius plots for the interaction of VPg peptides with fluorescein-labeled RTA. The rate constant values for wt VPg (--), VPg-71 (--), VPg-111 (--), and VPg1–110 (--) peptides with labeled-RTA at different temperatures were used to construct an Arrhenius plot according to equation S9. The activation energy was calculated from the slope of the fitted linear plot of –ln kobs versus reciprocal of absolute temperature T−1 (Kelvin).
Figure 8.
Figure 8.. Electrostatic component in RTA-VPg docking interactions.
(A) Surface electrostatic analysis reveals complementary acidic patches in VPg1–110 (RTA depicted in pale green cartoon format), and (B) Basic patches in RTA (VPg1–110 depicted in wheat cartoon format). (C) Surface electrostatics of the docked VPg1–110 (bottom) and RTA (top) showing VPg’s acidic surfaces clamp the basic surface of RTA on both sides of the interaction surface.
Figure 9.
Figure 9.. Predicted mode of interaction of VPg1–110 with RTA and Stx1.
(A) VPg1–110 (wheat cartoon) and RTA (pale green cartoon) with the key interaction interface residues shown in red (VPg1–110) and dark green (RTA). Active site residues are highlighted in orange on the RTA cartoon. (B) VPg1–110 (wheat cartoon) and Stx1 (pale green cartoon) with the key interaction interface residues shown in red (VPg1–110) and dark green (Stx1). Active site residues are highlighted in orange on Stx1 cartoon.

References

    1. Barbieri L, Battelli MG, and Stirpe F (1993) Ribosome-inactivating proteins from plants. Biochim. Biophys. Acta 1154, 237–282. - PubMed
    1. Wang P and Tumer NE (2000) Virus resistance mediated by ribosome inactivating proteins. Adv. Virus Res 55, 325–355. - PubMed
    1. Walsh MJ, Dodd JE, and Hautbergue GM (2013) Ribosome-inactivating proteins: potent poisons and molecular tools. Virulence 4, 774–784. - PMC - PubMed
    1. Jimenez A and Vazquez D (1985) Plant and fungal protein and glycoprotein toxins inhibiting eukaryote protein synthesis. Annu. Rev. Microbiol 39, 649–672. - PubMed
    1. Stirpe F (2004) Ribosome-inactivating proteins. Toxicon 44, 371–383. - PubMed

Publication types

Supplementary concepts

LinkOut - more resources