

Differences in the Quantity and Types of Foods and Beverages Consumed by Canadians between 2004 and 2015
- PMID: 30823448
- PMCID: PMC6471131
- DOI: 10.3390/nu11030526
Differences in the Quantity and Types of Foods and Beverages Consumed by Canadians between 2004 and 2015
Erratum in
-
Correction: Tugault-Lafleur C.N. and Black J.L. "Differences in the Quantity and Types of Foods and Beverages Consumed by Canadians between 2004 and 2015" Nutrients 2019, 11, 526.Nutrients. 2019 Sep 9;11(9):2160. doi: 10.3390/nu11092160. Nutrients. 2019. PMID: 31505842 Free PMC article.
Abstract
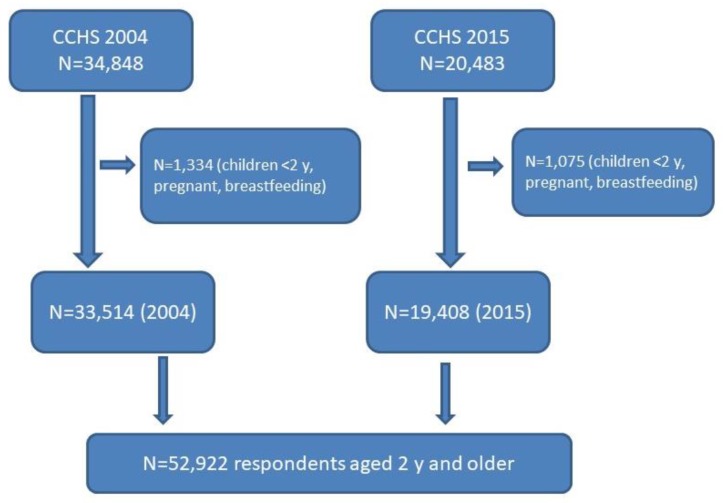
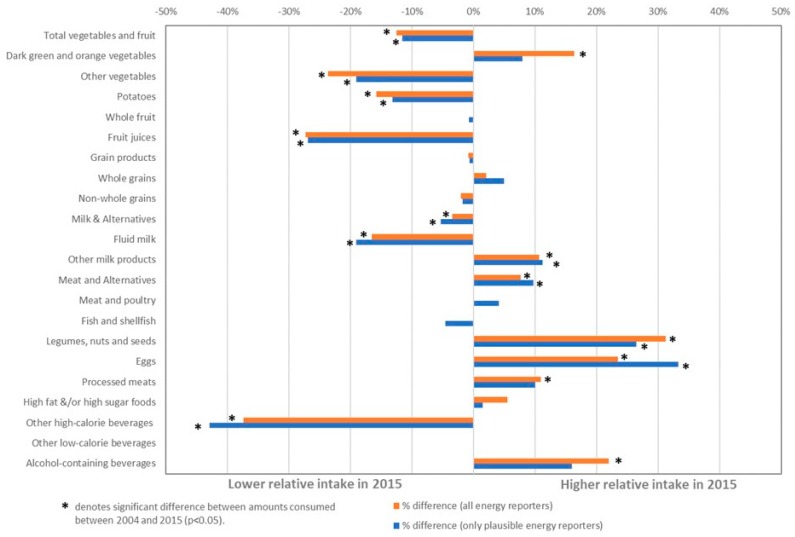
This study examined differences in food and beverage intake estimated from nationally representative surveys of Canadians in 2004 and 2015 collected through the Canadian Community Health Surveys. Differences in mean daily energy intake and amounts of food consumed were compared between 2004 and 2015 and across age groups for all energy reporters (aged 2 years+) and among only plausible energy reporters. From 2004 to 2015, mean energy intake decreased by 228 kcal/day (all energy reporters) and 74 kcal/day (plausible energy reporters). Canadians reported consuming more daily servings of meat and alternatives but fewer servings of vegetables and fruit and milk and alternatives in 2015 compared to 2004. Analyses of food subgroups revealed that Canadians reported consuming more daily servings of dark green and orange vegetables, dairy products, legumes, nuts and seeds, and eggs but fewer servings of potatoes, other vegetables, fruit juices, fluid milk, and sugar-sweetened beverages in 2015 compared to 2004. While some aspects of the Canadian diet have improved, daily mean intake of other nutritious foods either stagnated or worsened over time. Continued attention is needed to improve population-level intakes of vegetables, fruit, whole grains, and protein foods such as legumes, nuts, seeds, and lower fat dairy products.
Keywords: Canada; diet surveys; food groups; secular trends.
Conflict of interest statement
The authors declare no conflict of interest.
Figures
Similar articles
-
Eating away from home in Canada: impact on dietary intake.Health Rep. 2021 Aug 18;32(8):18-26. doi: 10.25318/82-003-x202100800003-eng. Health Rep. 2021. PMID: 34405972
-
Lunch on School Days in Canada: Examining Contributions to Nutrient and Food Group Intake and Differences across Eating Locations.J Acad Nutr Diet. 2020 Sep;120(9):1484-1497. doi: 10.1016/j.jand.2020.01.011. Epub 2020 Jun 2. J Acad Nutr Diet. 2020. PMID: 32507319
-
Changes in beverage consumption in Canada.Health Rep. 2019 Jul 17;30(7):20-30. doi: 10.25318/82-003-x201900700003-eng. Health Rep. 2019. PMID: 31314126
-
Dietary Intake Among US Adults, 1999-2012.JAMA. 2016 Jun 21;315(23):2542-53. doi: 10.1001/jama.2016.7491. JAMA. 2016. PMID: 27327801 Free PMC article.
-
Beverage consumption and energy intake among Canadians: analyses of 2004 and 2015 national dietary intake data.Nutr J. 2019 Oct 18;18(1):60. doi: 10.1186/s12937-019-0488-5. Nutr J. 2019. PMID: 31627756 Free PMC article.
Cited by
-
Consumption of Milk and alternatives decreased among Canadians from 2004 to 2015: evidence from the Canadian community health surveys.BMC Nutr. 2021 Nov 1;7(1):63. doi: 10.1186/s40795-021-00465-9. BMC Nutr. 2021. PMID: 34719398 Free PMC article.
-
Comparing the perceptions and opinions of the 2007 and 2019 Canada's food guides among parents of young children.Front Public Health. 2022 Aug 9;10:944648. doi: 10.3389/fpubh.2022.944648. eCollection 2022. Front Public Health. 2022. PMID: 36016900 Free PMC article. Clinical Trial.
-
Prediction of type 2 diabetes mellitus based on nutrition data.J Nutr Sci. 2021 Jun 21;10:e46. doi: 10.1017/jns.2021.36. eCollection 2021. J Nutr Sci. 2021. PMID: 34221364 Free PMC article.
-
The Effectiveness of the Foodbot Factory Mobile Serious Game on Increasing Nutrition Knowledge in Children.Nutrients. 2020 Nov 6;12(11):3413. doi: 10.3390/nu12113413. Nutrients. 2020. PMID: 33172094 Free PMC article. Clinical Trial.
-
Nutrient intakes of Canadian adults: results from the Canadian Community Health Survey (CCHS)-2015 Public Use Microdata File.Am J Clin Nutr. 2021 Sep 1;114(3):1131-1140. doi: 10.1093/ajcn/nqab143. Am J Clin Nutr. 2021. PMID: 34020449 Free PMC article.
References
-
- Institute for Health Metrics and Evaluation Global Burden of Disease (GBD) Profile: Canada. [(accessed on 24 April 2017)]; Available online: http://www.healthdata.org/canada.
-
- Garriguet D. Canadians’ eating habits. Health Rep. 2006;18:17–32. - PubMed
-
- Health Canada . Eating Well with Canada’s Food Guide. Health Canada; Ottawa, ON, Canada: 2007.
MeSH terms
Grants and funding
LinkOut - more resources
Full Text Sources
