

Estimating Crop Nutritional Status Using Smart Apps to Support Nitrogen Fertilization. A Case Study on Paddy Rice
- PMID: 30823623
- PMCID: PMC6412567
- DOI: 10.3390/s19040981
Estimating Crop Nutritional Status Using Smart Apps to Support Nitrogen Fertilization. A Case Study on Paddy Rice
Abstract
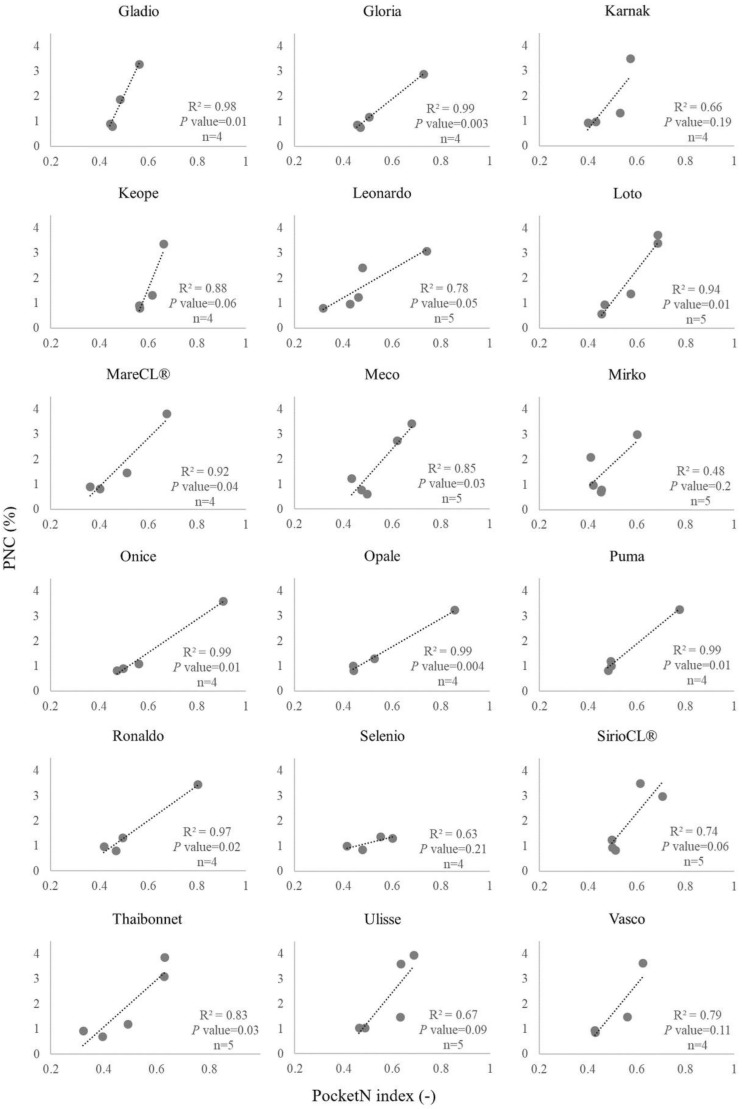
Accurate nitrogen (N) management is crucial for the economic and environmental sustainability of cropping systems. Different methods have been developed to increase the efficiency of N fertilizations. However, their costs and/or low usability have often prevented their adoption in operational contexts. We developed a diagnostic system to support topdressing N fertilization based on the use of smart apps to derive a N nutritional index (NNI; actual/critical plant N content). The system was tested on paddy rice via dedicated field experiments, where the smart apps PocketLAI and PocketN were used to estimate, respectively, critical (from leaf area index) and actual plant N content. Results highlighted the system's capability to correctly detect the conditions of N stress (NNI < 1) and N surplus (NNI > 1), thereby effectively supporting topdressing fertilizations. A resource-efficient methodology to derive PocketN calibration curves for different varieties-needed to extend the system to new contexts-was also developed and successfully evaluated on 43 widely grown European varieties. The widespread availability of smartphones and the possibility to integrate NNI and remote sensing technologies to derive variable rate fertilization maps generate new opportunities for supporting N management under real farming conditions.
Keywords: Critical nitrogen; NNI; PocketLAI; PocketN; sustainable N management.
Conflict of interest statement
The authors declare no conflict of interest.
Figures


Similar articles
-
May smart technologies reduce the environmental impact of nitrogen fertilization? A case study for paddy rice.Sci Total Environ. 2020 May 1;715:136956. doi: 10.1016/j.scitotenv.2020.136956. Epub 2020 Jan 27. Sci Total Environ. 2020. PMID: 32023514
-
Precision Estimation of Rice Nitrogen Fertilizer Topdressing According to the Nitrogen Nutrition Index Using UAV Multi-Spectral Remote Sensing: A Case Study in Southwest China.Plants (Basel). 2025 Apr 11;14(8):1195. doi: 10.3390/plants14081195. Plants (Basel). 2025. PMID: 40284082 Free PMC article.
-
Sensitivity of Vegetation Indices for Estimating Vegetative N Status in Winter Wheat.Sensors (Basel). 2019 Aug 27;19(17):3712. doi: 10.3390/s19173712. Sensors (Basel). 2019. PMID: 31461857 Free PMC article.
-
Relay cropping as a sustainable approach: problems and opportunities for sustainable crop production.Environ Sci Pollut Res Int. 2017 Mar;24(8):6973-6988. doi: 10.1007/s11356-017-8371-4. Epub 2017 Jan 13. Environ Sci Pollut Res Int. 2017. PMID: 28083744 Review.
-
Optimizing rice yields while minimizing yield-scaled global warming potential.Glob Chang Biol. 2014 May;20(5):1382-93. doi: 10.1111/gcb.12413. Epub 2014 Feb 24. Glob Chang Biol. 2014. PMID: 24115565 Review.
Cited by
-
Prediction of the Nitrogen Content of Rice Leaf Using Multi-Spectral Images Based on Hybrid Radial Basis Function Neural Network and Partial Least-Squares Regression.Sensors (Basel). 2022 Nov 9;22(22):8626. doi: 10.3390/s22228626. Sensors (Basel). 2022. PMID: 36433222 Free PMC article.
References
-
- Komarek A.M., Drogue S., Chenoune R., Hawkins J., Msangi S., Belhouchette H., Flichman G. Agricultural household effects of fertilizer price changes for smallholder farmers in central Malawi. Agric. Syst. 2017;154:168–178. doi: 10.1016/j.agsy.2017.03.016. - DOI
