Stochastic coupled map model of subcellular calcium cycling in cardiac cells
- PMID: 30823735
- PMCID: PMC7043839
- DOI: 10.1063/1.5063462
Stochastic coupled map model of subcellular calcium cycling in cardiac cells
Abstract
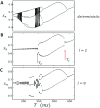
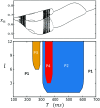
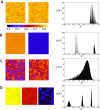
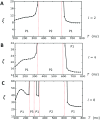
In this study, we analyze a nonlinear map model of intracellular calcium (Ca) and voltage in cardiac cells. In this model, Ca release from the sarcoplasmic reticulum (SR) occurs at spatially distributed dyadic junctions that are diffusively coupled. At these junctions, release occurs with a probability that depends on key variables such as the SR load and the diastolic interval. Using this model, we explore how nonlinearity and stochasticity determine the spatial distribution of Ca release events within a cardiac cell. In particular, we identify a novel synchronization transition, which occurs at rapid pacing rates, in which the global Ca transient transitions from a period 2 response to a period 1 response. In the global period 2 response dyadic junctions fire in unison, on average, on alternate beats, while in the period 1 regime, Ca release at individual dyads is highly irregular. A close examination of the spatial distribution of Ca reveals that in the period 1 regime, the system coarsens into spatially out-of-phase regions with a length scale much smaller than the system size, but larger than the spacing between dyads. We have also explored in detail the coupling to membrane voltage. We study first the case of positive coupling, where a large Ca transient promotes a long action potential duration (APD). Here, the coupling to voltage synchronizes Ca release so that the system exhibits a robust period 2 response that is independent of initial conditions. On the other hand, in the case of negative coupling, where a large Ca transient tends to shorten the APD, we find a multitude of metastable states which consist of complex spatially discordant alternans patterns. Using an analogy to equilibrium statistical mechanics, we show that the spatial patterns observed can be explained by a mapping to the Potts model, with an additional term that accounts for a global coupling of spin states. Using this analogy, we argue that Ca cycling in cardiac cells exhibits complex spatiotemporal patterns that emerge via first or second order phase transitions. These results show that voltage and Ca can interact in order to induce complex subcellular responses, which can potentially lead to heart rhythm disorders.
Figures


Similar articles
-
Synchronization of spatially discordant voltage and calcium alternans in cardiac tissue.Phys Rev E. 2022 Aug;106(2-1):024406. doi: 10.1103/PhysRevE.106.024406. Phys Rev E. 2022. PMID: 36109882 Free PMC article.
-
Inferring the cellular origin of voltage and calcium alternans from the spatial scales of phase reversal during discordant alternans.Biophys J. 2007 Feb 15;92(4):L33-5. doi: 10.1529/biophysj.106.100982. Epub 2006 Dec 15. Biophys J. 2007. PMID: 17172300 Free PMC article.
-
T-tubule disruption promotes calcium alternans in failing ventricular myocytes: mechanistic insights from computational modeling.J Mol Cell Cardiol. 2015 Feb;79:32-41. doi: 10.1016/j.yjmcc.2014.10.018. Epub 2014 Nov 6. J Mol Cell Cardiol. 2015. PMID: 25450613 Free PMC article.
-
Local calcium gradients during excitation-contraction coupling and alternans in atrial myocytes.J Physiol. 2003 Jan 1;546(Pt 1):19-31. doi: 10.1113/jphysiol.2002.025239. J Physiol. 2003. PMID: 12509476 Free PMC article. Review.
-
Cardiac systems biology and parameter sensitivity analysis: intracellular Ca2+ regulatory mechanisms in mouse ventricular myocytes.Adv Biochem Eng Biotechnol. 2008;110:25-45. doi: 10.1007/10_2007_093. Adv Biochem Eng Biotechnol. 2008. PMID: 18437298 Review.
Cited by
-
Voltage-mediated mechanism for calcium wave synchronization and arrhythmogenesis in atrial tissue.Biophys J. 2022 Feb 1;121(3):383-395. doi: 10.1016/j.bpj.2021.12.040. Epub 2021 Dec 27. Biophys J. 2022. PMID: 34968425 Free PMC article.
-
Dual regulation by subcellular calcium heterogeneity and heart rate variability on cardiac electromechanical dynamics.Chaos. 2020 Sep;30(9):093129. doi: 10.1063/5.0019313. Chaos. 2020. PMID: 33003911 Free PMC article.
-
Feedback control of calcium driven alternans in cardiac myocytes.Chaos. 2020 May;30(5):053106. doi: 10.1063/5.0005191. Chaos. 2020. PMID: 32491889 Free PMC article.
-
Synchronization of spatially discordant voltage and calcium alternans in cardiac tissue.Phys Rev E. 2022 Aug;106(2-1):024406. doi: 10.1103/PhysRevE.106.024406. Phys Rev E. 2022. PMID: 36109882 Free PMC article.
-
Multi-Scale Computational Modeling of Spatial Calcium Handling From Nanodomain to Whole-Heart: Overview and Perspectives.Front Physiol. 2022 Mar 9;13:836622. doi: 10.3389/fphys.2022.836622. eCollection 2022. Front Physiol. 2022. PMID: 35370783 Free PMC article. Review.
References
-
- Bers D. M., Excitation-Contraction Coupling and Cardiac Contractile Force, 2nd ed. (Kluwer Academic Publishers, Dordrecht, Boston, 2001).
MeSH terms
Substances
Grants and funding
LinkOut - more resources
Full Text Sources
Research Materials

