

Individualized frequency importance functions for listeners with sensorineural hearing loss
- PMID: 30823788
- PMCID: PMC6375730
- DOI: 10.1121/1.5090495
Individualized frequency importance functions for listeners with sensorineural hearing loss
Abstract
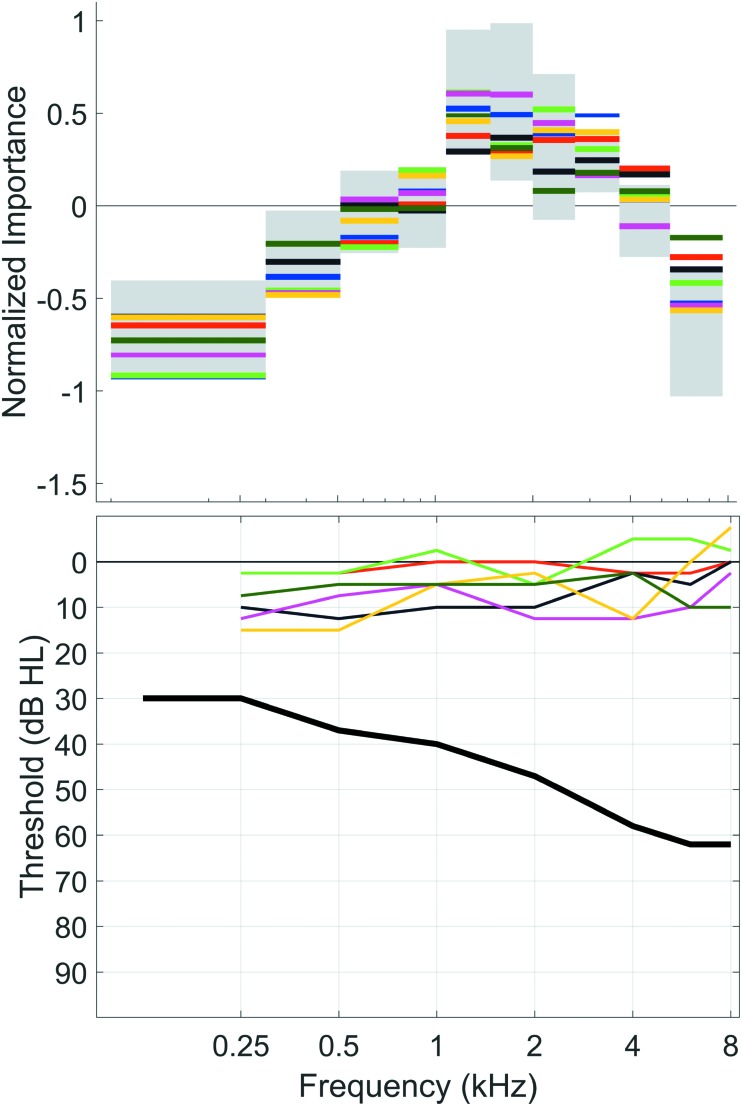
The Speech Intelligibility Index includes a series of frequency importance functions for calculating the estimated intelligibility of speech under various conditions. Until recently, techniques to derive frequency importance required averaging data over a group of listeners, thus hindering the ability to observe individual differences due to factors such as hearing loss. In the current study, the "random combination strategy" [Bosen and Chatterjee (2016). J. Acoust. Soc. Am. 140, 3718-3727] was used to derive frequency importance functions for individual hearing-impaired listeners, and normal-hearing participants for comparison. Functions were measured by filtering sentences to contain only random subsets of frequency bands on each trial, and regressing speech recognition against the presence or absence of bands across trials. Results show that the contribution of each band to speech recognition was inversely proportional to audiometric threshold in that frequency region, likely due to reduced audibility, even though stimuli were shaped to compensate for each individual's hearing loss. The results presented in this paper demonstrate that this method is sensitive to factors that alter the shape of frequency importance functions within individuals with hearing loss, which could be used to characterize the impact of audibility or other factors related to suprathreshold deficits or hearing aid processing strategies.
Figures


Similar articles
-
Auditory models of suprathreshold distortion and speech intelligibility in persons with impaired hearing.J Am Acad Audiol. 2013 Apr;24(4):307-28. doi: 10.3766/jaaa.24.4.6. J Am Acad Audiol. 2013. PMID: 23636211
-
Stop-consonant recognition for normal-hearing listeners and listeners with high-frequency hearing loss. II: Articulation index predictions.J Acoust Soc Am. 1989 Jan;85(1):355-64. doi: 10.1121/1.397687. J Acoust Soc Am. 1989. PMID: 2921418
-
Suprathreshold auditory processing and speech perception in noise: hearing-impaired and normal-hearing listeners.J Am Acad Audiol. 2013 Apr;24(4):274-92. doi: 10.3766/jaaa.24.4.4. J Am Acad Audiol. 2013. PMID: 23636209
-
Identification of the Spectrotemporal Modulations That Support Speech Intelligibility in Hearing-Impaired and Normal-Hearing Listeners.J Speech Lang Hear Res. 2019 Apr 15;62(4):1051-1067. doi: 10.1044/2018_JSLHR-H-18-0045. J Speech Lang Hear Res. 2019. PMID: 30986140 Free PMC article.
-
Effect of audibility on better-ear glimpsing as a function of frequency in normal-hearing and hearing-impaired listeners.J Acoust Soc Am. 2018 Apr;143(4):2195. doi: 10.1121/1.5031007. J Acoust Soc Am. 2018. PMID: 29716302
Cited by
-
Dichotic spectral integration range for consonant recognition in listeners with normal hearing.Front Psychol. 2022 Oct 20;13:1009463. doi: 10.3389/fpsyg.2022.1009463. eCollection 2022. Front Psychol. 2022. PMID: 36337493 Free PMC article.
-
Spectral weighting for sentence recognition in steady-state and amplitude-modulated noise.JASA Express Lett. 2023 May 1;3(5):055202. doi: 10.1121/10.0017934. JASA Express Lett. 2023. PMID: 37125871 Free PMC article.
-
The Effect of Gel Application on the Transducer in Cartilage Conduction Hearing Aids: A Case Series Study.Laryngoscope Investig Otolaryngol. 2025 Mar 4;10(2):e70108. doi: 10.1002/lio2.70108. eCollection 2025 Apr. Laryngoscope Investig Otolaryngol. 2025. PMID: 40046981 Free PMC article.
-
Individualized estimation of the Speech Intelligibility Index for short sentences: Test-retest reliability.J Acoust Soc Am. 2020 Sep;148(3):1647. doi: 10.1121/10.0001994. J Acoust Soc Am. 2020. PMID: 33003860 Free PMC article.
-
Frequency importance functions in simulated bimodal cochlear-implant users with spectral holes.J Acoust Soc Am. 2024 Jun 1;155(6):3589-3599. doi: 10.1121/10.0026220. J Acoust Soc Am. 2024. PMID: 38829154 Free PMC article.
References
-
- Akaike, H. (1974). “ A new look at the statistical model identification,” IEEE Trans. Automat. Contr. 19, 716–723.10.1109/TAC.1974.1100705 - DOI
-
- ANSI (1997). ANSI S3.5 (R2007), American National Standard Methods for the Calculation of the Speech Intelligibility Index ( ANSI, New York: ).
-
- ANSI (2004). ANSI S3.21 (R2009), American National Standard Methods for Manual Pure-Tone Threshold Audiometry ( ANSI, New York: ).
Publication types
MeSH terms
Grants and funding
LinkOut - more resources
Full Text Sources