. 2019 Mar 1;20(1):48.
doi: 10.1186/s13059-019-1653-z.

MMSplice: modular modeling improves the predictions of genetic variant effects on splicing

Affiliations

MMSplice: modular modeling improves the predictions of genetic variant effects on splicing

Jun Cheng et al. Genome Biol. .

Abstract

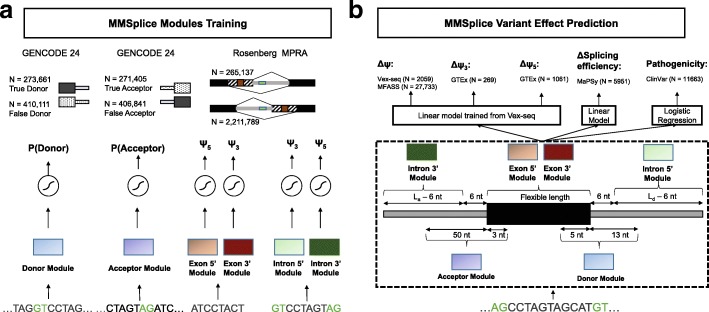
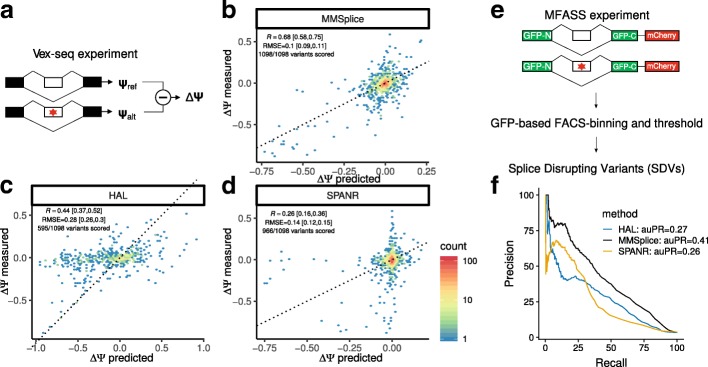
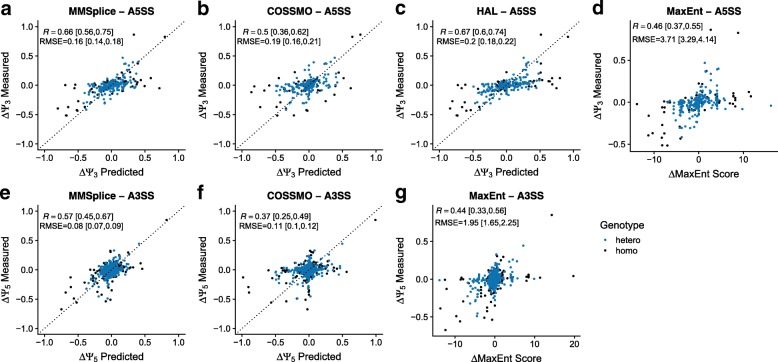
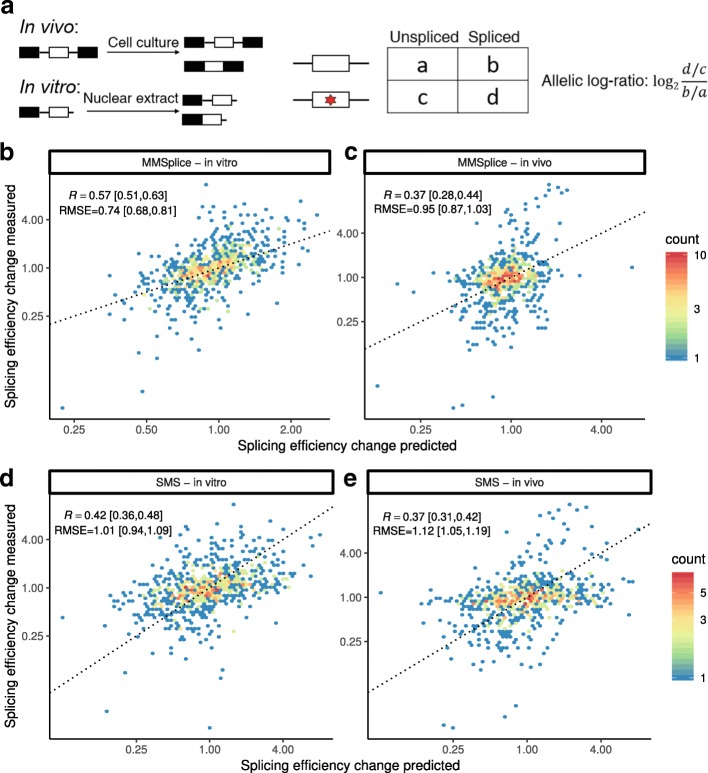
Predicting the effects of genetic variants on splicing is highly relevant for human genetics. We describe the framework MMSplice (modular modeling of splicing) with which we built the winning model of the CAGI5 exon skipping prediction challenge. The MMSplice modules are neural networks scoring exon, intron, and splice sites, trained on distinct large-scale genomics datasets. These modules are combined to predict effects of variants on exon skipping, splice site choice, splicing efficiency, and pathogenicity, with matched or higher performance than state-of-the-art. Our models, available in the repository Kipoi, apply to variants including indels directly from VCF files.

Keywords: Deep learning; Modular modeling; Splicing; Variant effect; Variant pathogenicity.


Conflict of interest statement

Ethics approval and consent to participate

Not applicable.

Consent for publication

Not applicable.

Competing interests

The authors declare that they have no competing interests.

Publisher’s Note

Springer Nature remains neutral with regard to jurisdictional claims in published maps and institutional affiliations.

Figures

Fig. 1
Fig. 1
Individual modules of MMSplice and their combination to predict the effect of genetic variants on various splicing quantities. a MMSplice consists of six modules scoring sequences from donor, acceptor, exon, and intron sites. Modules were trained with rich genomics dataset probing the corresponding regulatory regions. b Modules from a are combined with a linear model to score variant effects on exon skipping (ΔΨ), alternative donor (ΔΨ3), or alternative acceptor site (ΔΨ5), splicing efficiency, and they are combined with a logistic regression model to predict variant pathogenicity. La and Ld stand for the length of intron sequence taken from the acceptor and donor side respectively
Fig. 2
Fig. 2
MMSplice improves the prediction of variant effect on exon skipping. a Schema of the Vex-seq experiment [29]. The effect of 2059 ExAC variants (red star) from or adjacent to 110 alternative exons were tested with reporter genes by measuring percent splice-in of the reference sequence (Ψref) and of the alternative (Ψalt) by RNAseq. bd Measured (y-axis) versus predicted (x-axis) Ψ differences between alternative and reference sequence for MMSplice (b), HAL [18] (c), and SPANR [17] (d) on Vex-seq test data. Color scale represents counts in hexagonal bins. The black line marks the y=x diagonal. Each plot is shown with the subset of variants that the considered model can score. Pearson correlations (R) and root-mean-square errors (RMSE) were also calculated based on the scored variants. The 95% confidence intervals for these two metrics were calculated with bootstrap (“Methods” section). (e) Schema of MFASS experiment [34]. Exon skipping effects of 27,733 ExAC SNVs (red star) spanning or adjacent to 2339 exons were tested by genome integration of designed construct. Splice-disrupting variant (SDV) is defined as a variant that change an exon with original exon inclusion index 0.5 by at least 0.5. f Precision-recall curve of MFASS SDV classification based on model predicted ΔΨ. Precision-recall curve for all three models was calculated for the sets of variants they can score. MMSplice (black) scored all 27,733 variants, SPANR (yellow) scored 27,663 variants (1,048 SDVs), and HAL (blue) scored 14,353 variants (489 SDVs)
Fig. 3
Fig. 3
Evaluation of models predicting ΔΨ5 and ΔΨ3 on the GTEx dataset. Associated effects (y-axis) versus predictions (x-axis) for GTEx variants around alternative spliced donors (3 nt in the exon and 6 nt in the intron) and acceptors (3 nt in the exon and 20 nt in the intron) were considered. Ψ5 (or Ψ3) of homozygous (black) and heterozygous (blue) alternative variants as well as homozygous reference variants were calculated by taking the mean Ψ5 (or Ψ3) across individuals with the same genotype (excluding individuals with multiple variants within 300 nt around splice sites) on brain and skin (not sun exposed) samples. For donor variants, MMSplice (a) was benchmarked against COSSMO (b), HAL (c), and MaxEntScan (d). For acceptor variants, MMSplice (e) was benchmarked against COSSMO (f) and MaxEntScan (g). The 95% confidence intervals for Pearson correlation (R) and root-mean-square errors (RMSE) were calculated with bootstrap (“Methods” section). The dotted line marks the y=x diagonal
Fig. 4
Fig. 4
Splicing efficiency prediction. a MaPSy experiment (“Methods” section). Effect of 5761 published disease-causing exonic mutations on splicing efficiency is measured both in vivo and in vitro. Changes of splicing efficiency were quantified by allelic log-ratio. be Measured (y-axis) versus predicted (x-axis) allelic ratio for 797 variants in the test set for MMSplice (b, c) and the SMS score [28] (d, e). The dotted line marks the y=x diagonal. The 95% confidence intervals for Pearson correlation (R) and root-mean-square errors (RMSE) were calculated with bootstrap (“Methods” section)
Fig. 5
Fig. 5
Predictions on ClinVar variants. a Variants are first mapped to potentially affected exons. Variants in the exon or in the intron, within La nt of the acceptor site or within Ld nt from the donor site are considered to affect splicing of the exon. Afterwards, reference and alternative sequences are retrieved and subjected to MMSplice for prediction. MMSplice gives a prediction for each variant-exon pair. b Model comparison on classifying pathogenicity of ClinVar splice variants. Models were trained and evaluated in 10-fold cross-validation. Error bars indicate one standard deviation calculated across folds. The six leftmost models (blue) are incrementally added to the ensemble model: “+phyloP+CADD ” uses all five previous models as well as phyloP and CADD scores. Performance of MMSplice and SPANR alone as well as their performance with phyloP and CADD scores are on the right (orange)

References

    1. López-Bigas N, Audit B, Ouzounis C, Parra G, Guigó R. Are splicing mutations the most frequent cause of hereditary disease?FEBS Lett. 2005; 579(9):1900–3. 10.1016/j.febslet.2005.02.047. - PubMed
    1. Li YI, van de Geijn B, Raj A, Knowles DA, Petti AA, Golan D, Gilad Y, Pritchard JK. RNA splicing is a primary link between genetic variation and disease. Science. 2016; 352(6285):600–4. 10.1126/science.aad9417. - PMC - PubMed
    1. Wahl MC, Will CL, Lührmann R. The spliceosome: design principles of a dynamic RNP machine. Cell. 2009;136(4):701–18. doi: 10.1016/j.cell.2009.02.009. - DOI - PubMed
    1. Wang Z, Burge CB. Splicing regulation: from a parts list of regulatory elements to an integrated splicing code. Rna. 2008;14(5):802–13. doi: 10.1261/rna.876308. - DOI - PMC - PubMed
    1. Scotti MM, Swanson MS. RNA mis-splicing in disease. Nat Rev Genet. 2015; 17(1):19–32. 10.1038/nrg.2015.3. - PMC - PubMed

Publication types

LinkOut - more resources