. 2019 Mar 1;38(1):111.
doi: 10.1186/s13046-019-1102-6.

Long non-coding RNA ZEB1-AS1 regulates miR-200b/FSCN1 signaling and enhances migration and invasion induced by TGF-β1 in bladder cancer cells

Affiliations

Long non-coding RNA ZEB1-AS1 regulates miR-200b/FSCN1 signaling and enhances migration and invasion induced by TGF-β1 in bladder cancer cells

Ruxu Gao et al. J Exp Clin Cancer Res. .

Abstract

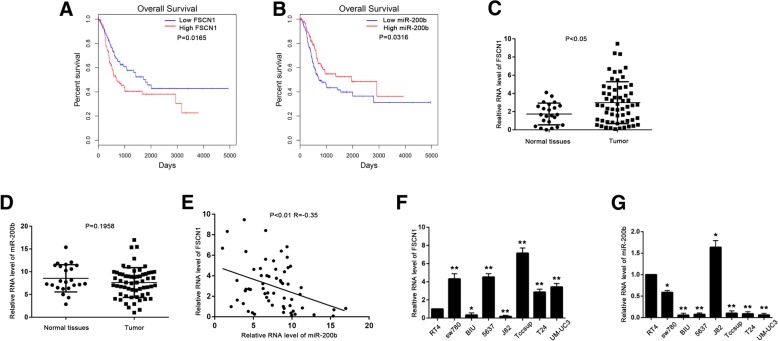
Background: The effect of competing endogenous RNA (ceRNA) can regulate gene expression by competitively binding microRNAs. Fascin-1 (FSCN1) plays an important role in the regulation of cellular migration and invasion during tumor progression, but how its regulatory mechanism works through the ceRNA effect is still unclear in bladder cancer (BLCA).

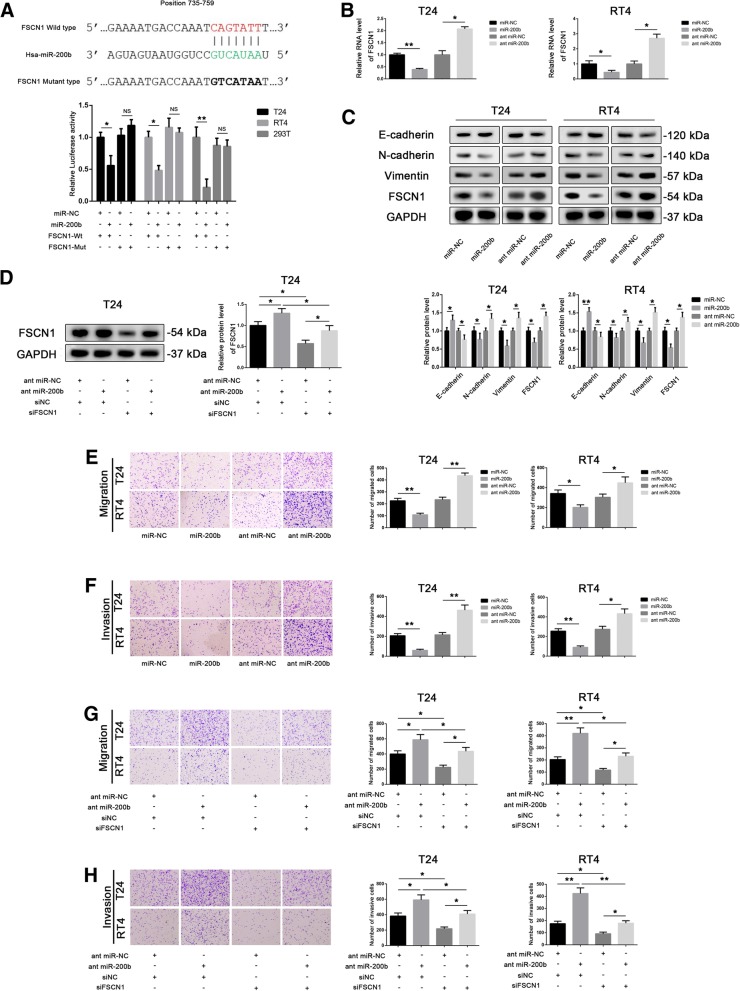
Methods: The role of fascin-1, miR-200b, and ZEB1-AS1 in BLCA was investigated in vitro and in vivo. The interaction between fascin-1, miR-200b, and ZEB1-AS1 was identified using bioinformatics analysis, luciferase activity assays, RNA-binding protein immunoprecipitation (RIP), quantitative PCR, and western blotting. Loss (or gain)-of-function experiments were performed to investigate the biological roles of miR-200b and ZEB1-AS1 on migration, invasion, proliferation, cell apoptosis, and cell cycle.

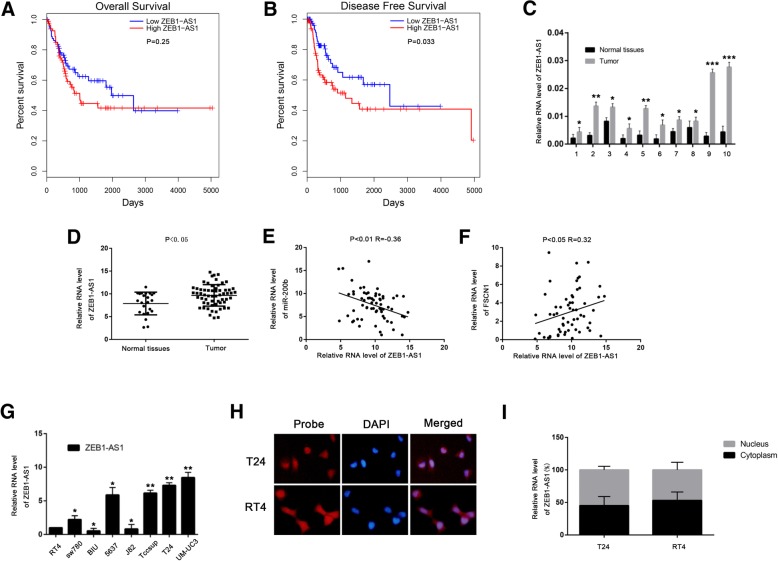
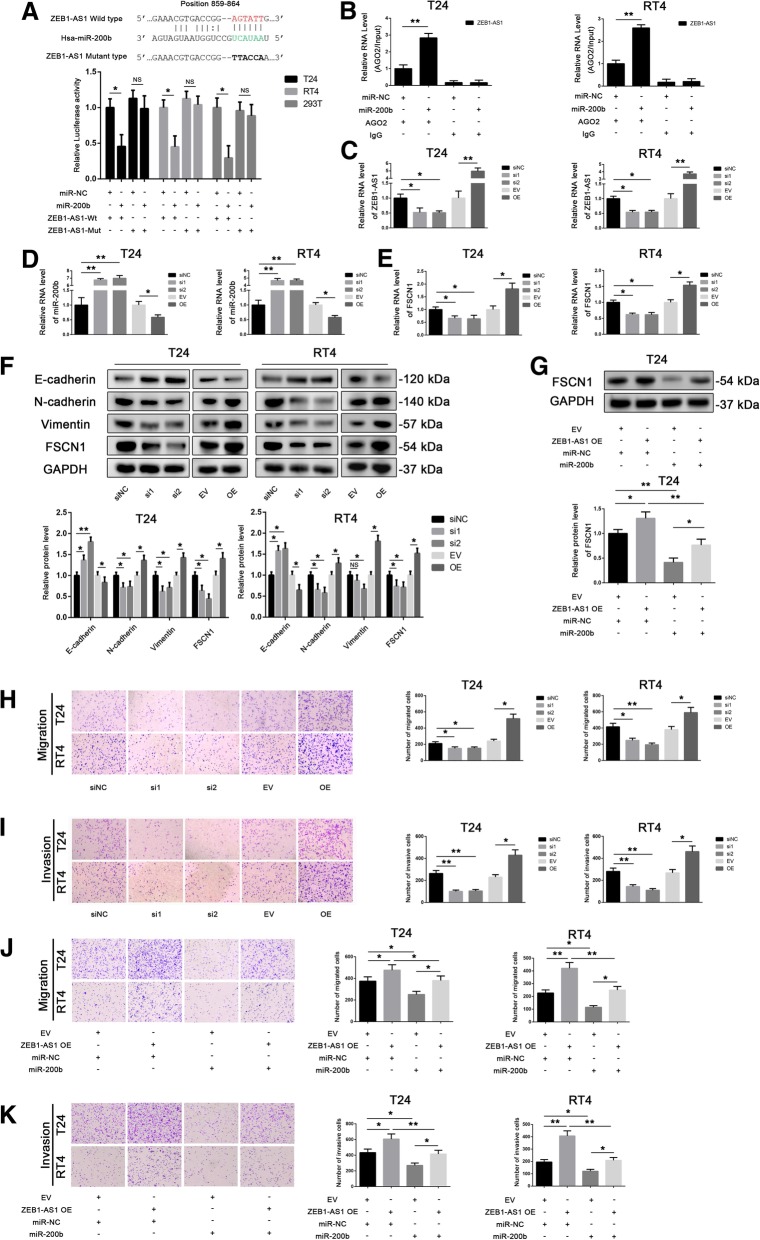
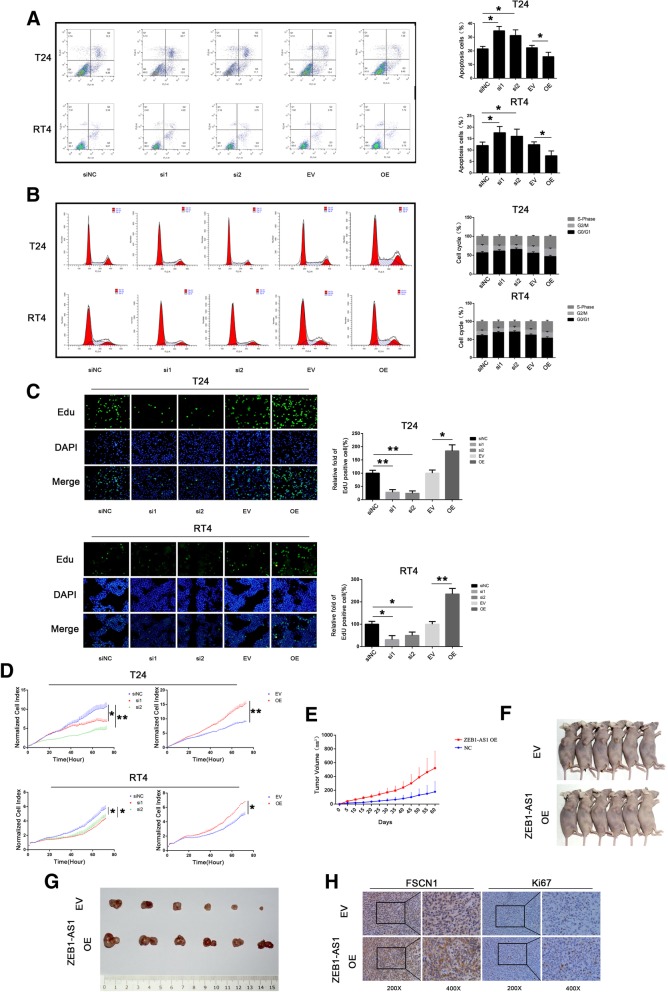
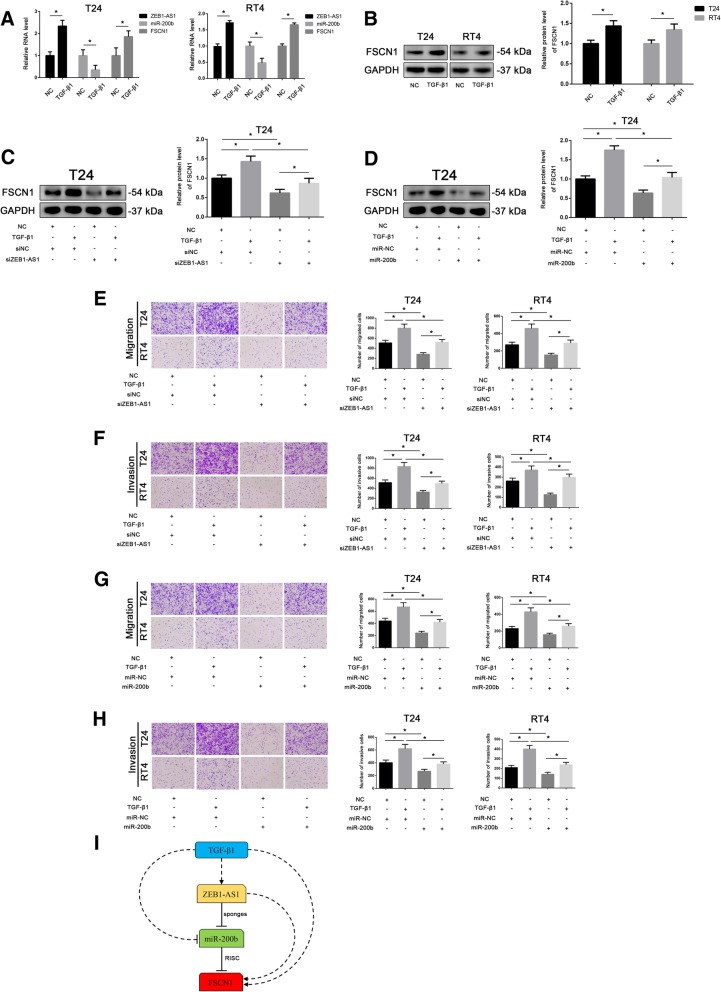
Results: ZEB1-AS1 functions as a competing endogenous RNA in BLCA to regulate the expression of fascin-1 through miR-200b. Moreover, the oncogenic long non-coding RNA ZEB1-AS1 was highly expressed in BLCA and positively correlated with high tumor grade, high TNM stage, and reduced survival of patients with BLCA. Moreover, ZEB1-AS1 downregulated the expression of miR-200b, promoted migration, invasion, and proliferation, and inhibited apoptosis in BLCA. Furthermore, we found TGF-β1 induced migration and invasion in BLCA by regulating the ZEB1-AS1/miR-200b/FSCN1 axis.

Conclusion: The observations in this study identify an important regulatory mechanism of fascin-1 in BLCA, and the TGF-β1/ZEB1-AS1/miR-200b/FSCN1 axis may serve as a potential target for cancer therapeutic purposes.

Keywords: Bladder cancer; Long non-coding RNA ZEB1-AS1; TGF-β1; fascin1; microRNA miR-200b.


Conflict of interest statement

Ethics approval and consent to participate

The protocols used in the study were approved by the Hospital’s Protection of Human Subjects Committee. The Institutional Animal Care and Use Committee of China Medical University approved all the experimental procedures of animal experiments.

Consent for publication

Consent for publication was obtained from all participants.

Competing interests

The authors declare that they have no competing interests.

Publisher’s Note

Springer Nature remains neutral with regard to jurisdictional claims in published maps and institutional affiliations.

Figures

Fig. 1
Fig. 1
Differential expression of fascin-1 (FSCN1) and miR-200b in bladder cancer (BLCA) tissues and cells. a and b Kaplan–Meier analysis of overall survival based on FSCN1 (a) and miR-200b (b) expression levels in patients with BLCA from the TCGA database. Patients with BLCA were divided into FSCN1 (or miR-200b) high expression group (33% of the total, with the highest FSCN1 (or miR-200b) expression) and low expression group (33%, with the lowest FSCN1 (or miR-200b) expression). c and d The mRNA level of FSCN1 (c) and miR-200b (d) in 23 normal bladder tissues and 60 BLCA tissues was measured by qPCR. Data were analyzed by Mann-Whitney U test. e Correlation between FSCN1 and miR-200b of 60 BLCA tissues. Data were analyzed by Spearman correlation analysis. f and g The mRNA level of FSCN1 (f) and miR-200b (g) in BLCA cell lines was measured by quantitative PCR (qPCR) and normalized by RT4 cell line. Data were analyzed by T-test. Data are presented as the mean ± standard deviation (SD). *P < 0.05; **P < 0.01; ***P < 0.001; ns, not significant
Fig. 2
Fig. 2
miR-200b inhibits fascin-1 (FSCN1) expression, migration, invasion. a Luciferase assays were performed after T24, RT4 and 293 T cells were co-transfected for 24 h with miR-negative control (miR-NC) or miR-200b and a plasmid containing wild-type or mutant-type FSCN1 3′ untranslated region (UTR) upstream the luciferase gene. The firefly luciferase activity of each sample was normalized by Renilla luciferase activity. Data were analyzed by T-test. b The mRNA level of FSCN1 in T24 and RT4 cells was measured by quantitative PCR (qPCR) after miR-200b was silenced or overexpressed. Data were analyzed by T-test. c The protein level of E-cadherin, N-cadherin, vimentin and FSCN1 in T24 and RT4 cells was measured by western blot after miR-200b was silenced or overexpressed. Data were analyzed by T-test. d The protein level of FSCN1 in T24 cells was measured by western blot after the cells were co-transfected with ant miR-NC or ant miR-200b and siNC or siFSCN1. Data were analyzed by T-test. e and f The migration (e) and invasion (f) abilities of T24 and RT4 cells were detected in transwell assays (without or with Matrigel) after miR-200b was silenced or overexpressed. g and h The cell migration (g) and invasion (h) abilities of T24 and RT4 were detected in transwell assays (without or with Matrigel) after co-transfection with miR-NC or miR-200b and siNC or siFSCN1. Data were analyzed by T-test. All images were taken at 100× magnification. Data are presented as the mean ± standard deviation (SD). *P < 0.05; **P < 0.01; ***P < 0.001; ns, not significant
Fig. 3
Fig. 3
ZEB1-AS1 is upregulated in BLCA tissues and correlates with miR-200b and fascin-1 (FSCN1). (A and B) Kaplan–Meier analysis of overall (a) and disease free (b) survival based on ZEB1-AS1 expression levels in patients with BLCA from the TCGA database. Patients with BLCA were divided into ZEB1-AS1 high expression group (21% of the total, with the highest ZEB1-AS1 expression) and low expression group (21% of the total, with the lowest ZEB1-AS1). c ZEB1-AS1 expression levels were detected in 10 pairs of BLCA and adjacent normal mucosa tissue samples by qPCR. Data were analyzed by T-test. d The mRNA level of ZEB1-AS1 in 23 normal bladder tissues and 60 BLCA tissues was measured by qPCR. Data were analyzed by Mann-Whitney U test. e and f The correlation between ZEB1-AS1 and miR-200b (e), ZEB1-AS1 and FSCN1 (f) of 60 BLCA tissues. Data were analyzed by Spearman correlation analysis. g The mRNA level of ZEB1-AS1 in BLCA cell lines was measured by quantitative (qPCR). Data were analyzed by T-test. h Fluorescence in situ hybridization (FISH) assay in T24 and RT4 cells showing ZEB1-AS1 (red); nuclei were stained with 4′, 6-diamidino-2-phenylindole (DAPI; blue). i The mRNA level of ZEB1-AS1 in the nuclear and cytoplasmic fraction of T24 and RT4 cells by qPCR. Data are presented as mean ± standard deviation (SD). *P < 0.05; **P < 0.01; ***P < 0.001; ns, not significant
Fig. 4
Fig. 4
ZEB1-AS1 downregulates miR-200b, upregulates fascin-1 (FSCN1), and promotes cell migration and invasion. a Luciferase assays were performed in T24, RT4, and 293 T cells co-transfected for 24 h with miR-negative control (NC) or miR-200b and a plasmid containing wild-type or mutant-type ZEB1-AS1 3′untranslated region (UTR) upstream the luciferase gene. Firefly luciferase activity of each sample was normalized by Renilla luciferase activity. Data were analyzed by T-test. b RNA-binding protein immunoprecipitation (RIP) assays with anti-AGO2 antibodies were performed in T24 and RT4 cells transiently transfected with miR-200b; ZEB1-AS1 levels were detected by quantitative PCR (qPCR); 10% input was used as positive control and RIP with anti-IgG antibodies served as negative control. Glyceraldehyde 3-phosphate dehydrogenase (GAPDH) was used as the internal control. Data were analyzed by T-test. c Transfection efficiency of ZEB1-AS1 knockdown (si1, si2) and overexpression (OE) in T24 and RT4 cells was detected by qPCR. Data were analyzed by T-test. d and e The levels of miR-200b (d) and FSCN1 (e) were measured by qPCR after ZEB1-AS1 knocked down or overexpressed in T24 and RT4 cells. Data were analyzed by T-test. f E-cadherin, N-cadherin, vimentin, and FSCN1 protein expression in T24 and RT4 cells in which ZEB1-AS1 had been knocked down or overexpressed. Data were analyzed by T-test. (g) FSCN1 levels in T24 cells co-transfected with miR-NC or miR-200b and with an empty vector (EV) or a plasmid overexpressing ZEB1-AS1. Data were analyzed by T-test. h and i Transwell assays (without or with Matrigel) to detect cell migration (h) and invasion (i) of T24 and RT4 after ZEB1-AS1 silencing or overexpression. j and k Transwell assays (without or with Matrigel) to detect cell migration (j) and invasion (k) of T24 and RT4 co-transfected with miR-NC or miR-200b and with an EV or a plasmid overexpressing ZEB1-AS1. Data were analyzed by T-test. Data are presented as the mean ± standard deviation (SD). *P < 0.05; **P < 0.01; ***P < 0.001; ns, not significant
Fig. 5
Fig. 5
ZEB1-AS1 inhibits apoptosis and promotes cell cycle and proliferation. a-b Apoptosis (a) and cell cycle (b) were detected by flow cytometry in T24 and RT4 cells after ZEB1-AS1 silencing or overexpression. Data were analyzed by T-test. c 5-Ethynyl-2′-deoxyuridine (EdU) assays on T24 and RT4 after ZEB1-AS1 silencing or overexpression. Data were analyzed by T-test. All images were taken at 200× magnification. d The proliferation of ZEB1-AS1-silenced or -overexpressing T24 and RT4 were detected by real time cell analysis (RTCA). Data were analyzed by T-test. e-h Xenograft model in nude mice. e Tumor growth was measured at the indicated days. f Nude mice at the end of the experiment. g Images of the excised tumors from each group. h Staining of Ki-67 and FSCN1 in the excised tumors. Data are presented as the mean ± standard deviation (SD). *P < 0.05; **P < 0.01; ***P < 0.001; ns, not significant
Fig. 6
Fig. 6
Transforming growth factor (TGF)-β1 inhibits miR-200b and promotes ZEB1-AS1 and fascin-1 (FSCN1) expression. a The mRNA level of ZEB1-AS1, miR-200b and FSCN1 in T24 and RT4 after treated with TGF-β1. Data were analyzed by T-test. b FSCN1 protein expression in T24 and RT4 cells treated with TGF-β1. Data were analyzed by T-test. c FSCN1 protein expression in T24 cells treated with TGF-β1 and transfected with siNC or siZEB1-AS1; untreated and not-transfected cells were used as control. Data were analyzed by T-test. d FSCN1 protein levels in T24 cells treated with TGF-β1 and transfected with miR-negative control (miR-NC) or miR-200b; untreated and not-transfected cells were used as control. Data were analyzed by T-test. e and f Transwell assays (without or with Matrigel) to detect migration (e) and invasion (f) of T24 and RT4 treated with TGF-β1 and transfected with siNC or siZEB1-AS1; untreated and not-transfected cells were used as control. g and h Transwell assays (without or with Matrigel) to detect the migration (g) and invasion (h) of T24 and RT4 treated with TGF-β1 and transfected with miR-NC or miR-200b untreated and not-transfected cells were used as control. Data were analyzed by T-test. i Hypothetical model illustrating the TGF-β1/ZEB1-AS1/miR-200b/FSCN1 axis. Data are presented as the mean ± standard deviation (SD). *P < 0.05; **P < 0.01; ***P < 0.001; ns, not significant

Similar articles

Cited by

References

    1. Jemal A, Bray F, Center MM, Ferlay J, Ward E, Forman D. Global cancer statistics. CA Cancer J Clin. 2011;61(2):69–90. doi: 10.3322/caac.20107. - DOI - PubMed
    1. Adams JC. Roles of fascin in cell adhesion and motility. Curr Opin Cell Biol. 2004;16(5):590–596. doi: 10.1016/j.ceb.2004.07.009. - DOI - PubMed
    1. Kureishy N, Sapountzi V, Prag S, Anilkumar N, Adams JC. Fascins, and their roles in cell structure and function. Bioessays. 2002;24(4):350–361. doi: 10.1002/bies.10070. - DOI - PubMed
    1. Anilkumar N, Parsons M, Monk R, Ng T, Adams JC. Interaction of fascin and protein kinase Calpha: a novel intersection in cell adhesion and motility. EMBO J. 2003;22(20):5390–5402. doi: 10.1093/emboj/cdg521. - DOI - PMC - PubMed
    1. Takikita M, Hu N, Shou JZ, et al. Fascin and CK4 as biomarkers for esophageal squamous cell carcinoma. Anticancer Res. 2011;31(3):945–952. - PMC - PubMed

MeSH terms