. 2019 Mar 1;17(1):20.
doi: 10.1186/s12964-019-0329-3.

A signalling cascade involving receptor-activated phospholipase A2, glycerophosphoinositol 4-phosphate, Shp1 and Src in the activation of cell motility

Affiliations

A signalling cascade involving receptor-activated phospholipase A2, glycerophosphoinositol 4-phosphate, Shp1 and Src in the activation of cell motility

Alessia Varone et al. Cell Commun Signal. .

Abstract

Background: Shp1, a tyrosine-phosphatase-1 containing the Src-homology 2 (SH2) domain, is involved in inflammatory and immune reactions, where it regulates diverse signalling pathways, usually by limiting cell responses through dephosphorylation of target molecules. Moreover, Shp1 regulates actin dynamics. One Shp1 target is Src, which controls many cellular functions including actin dynamics. Src has been previously shown to be activated by a signalling cascade initiated by the cytosolic-phospholipase A2 (cPLA2) metabolite glycerophosphoinositol 4-phosphate (GroPIns4P), which enhances actin polymerisation and motility. While the signalling cascade downstream Src has been fully defined, the mechanism by which GroPIns4P activates Src remains unknown.

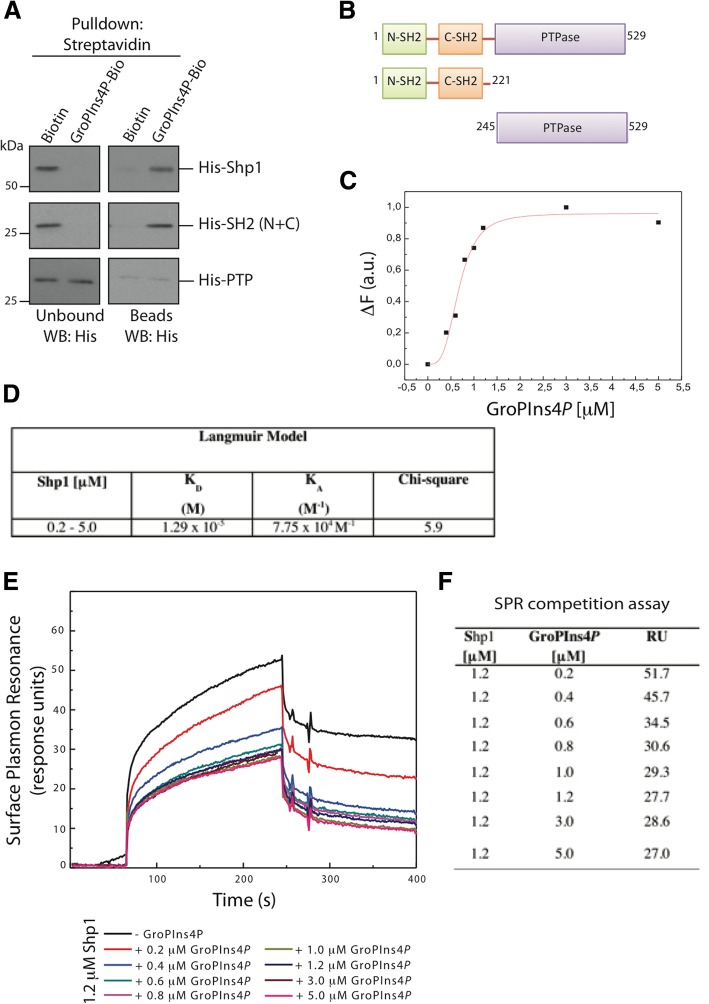
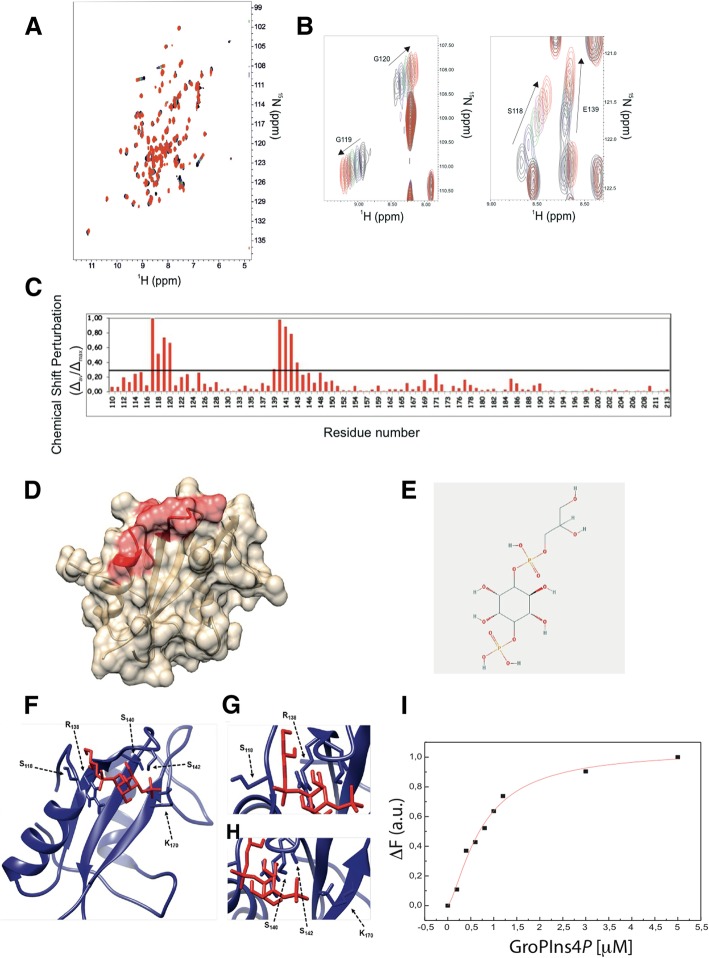
Methods: Affinity chromatography, mass spectrometry and co-immunoprecipitation studies were employed to identify the GroPIns4P-interactors; among these Shp1 was selected for further analysis. The specific Shp1 residues interacting with GroPIns4P were revealed by NMR and validated by site-directed mutagenesis and biophysical methods such as circular dichroism, isothermal calorimetry, fluorescence spectroscopy, surface plasmon resonance and computational modelling. Morphological and motility assays were performed in NIH3T3 fibroblasts.

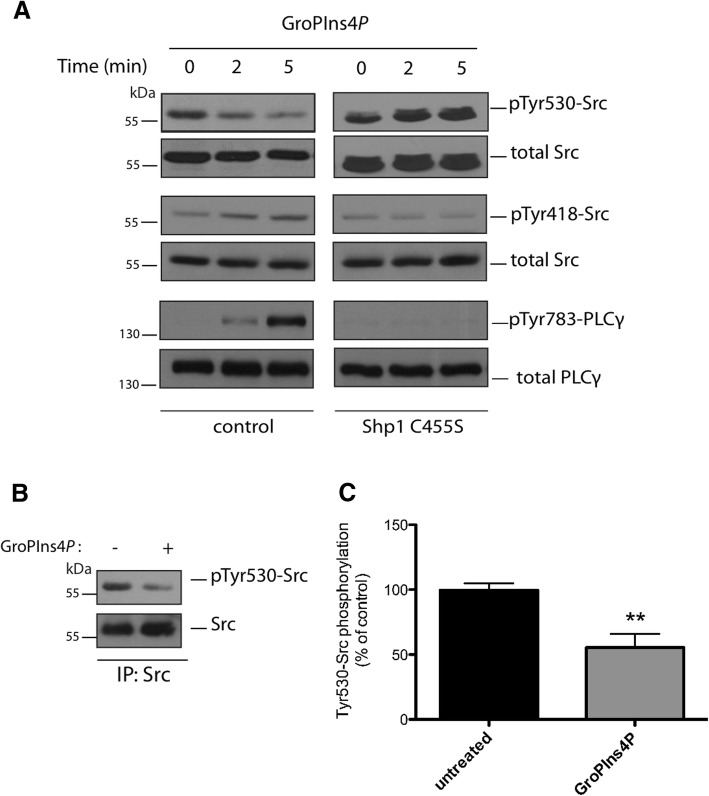
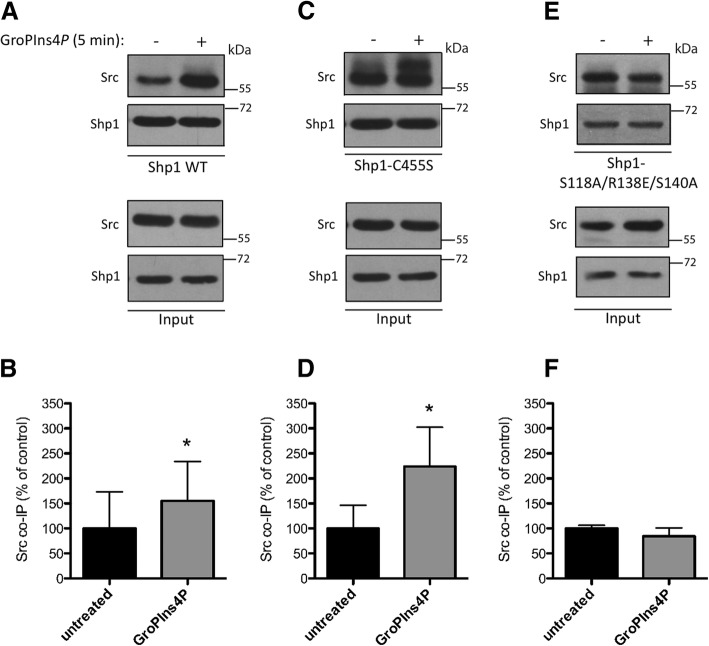
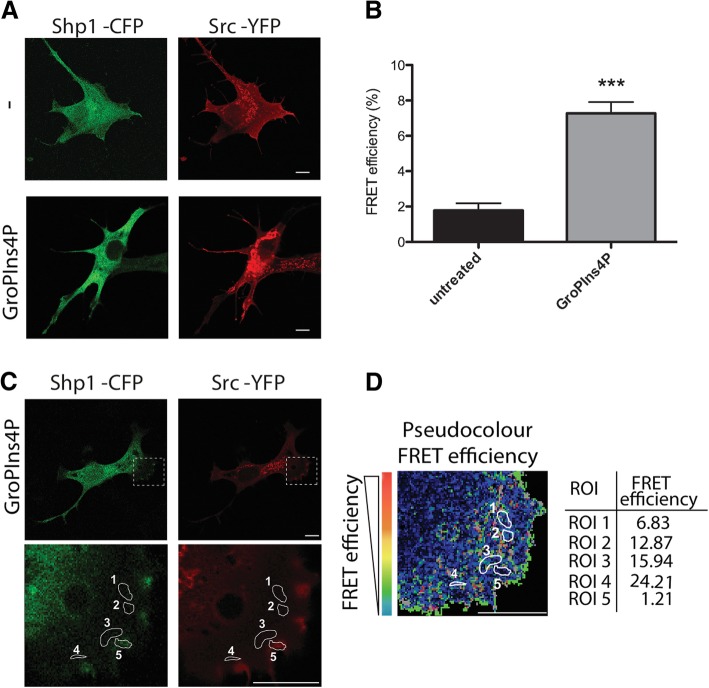
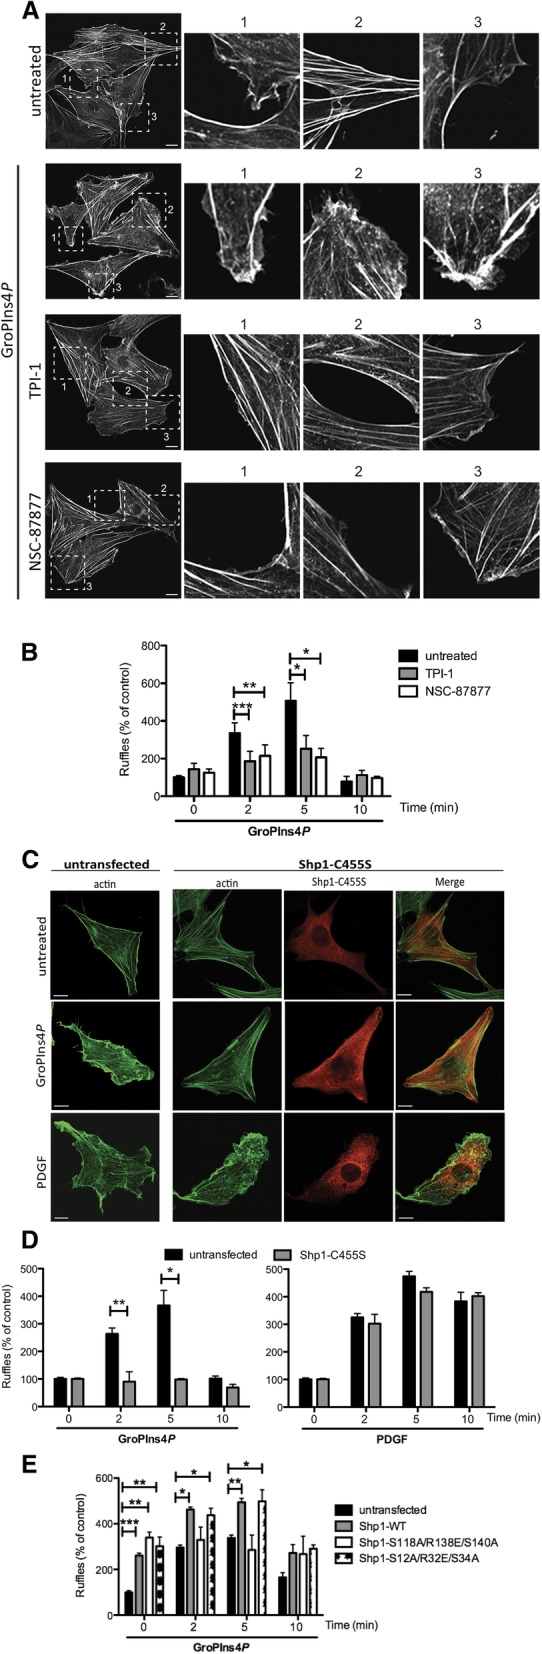
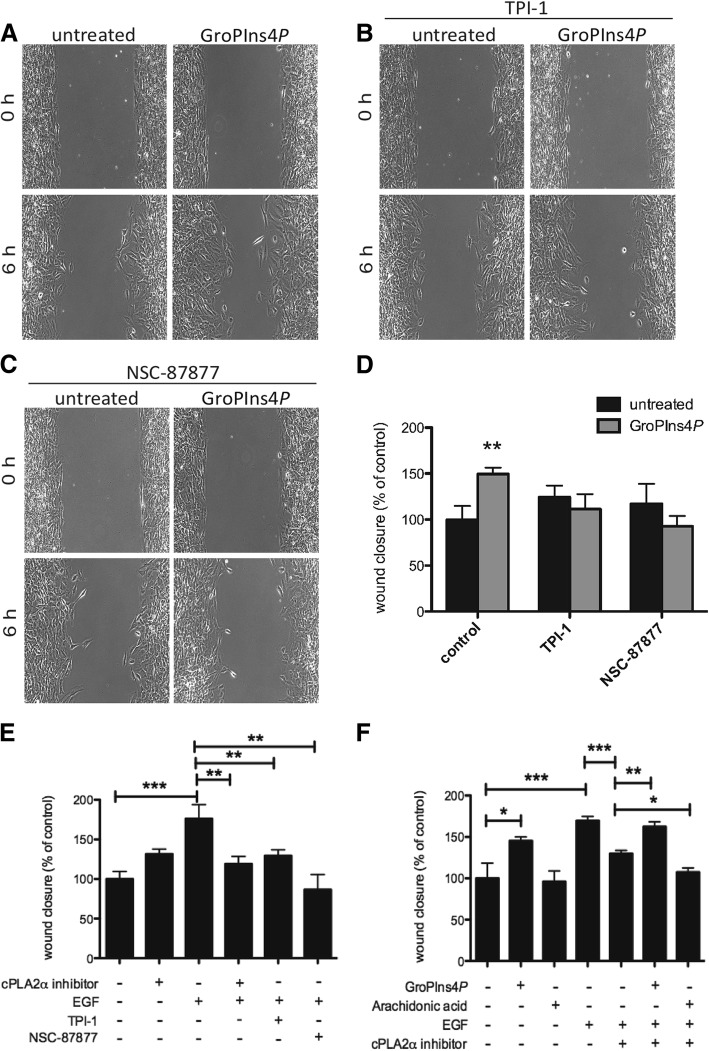
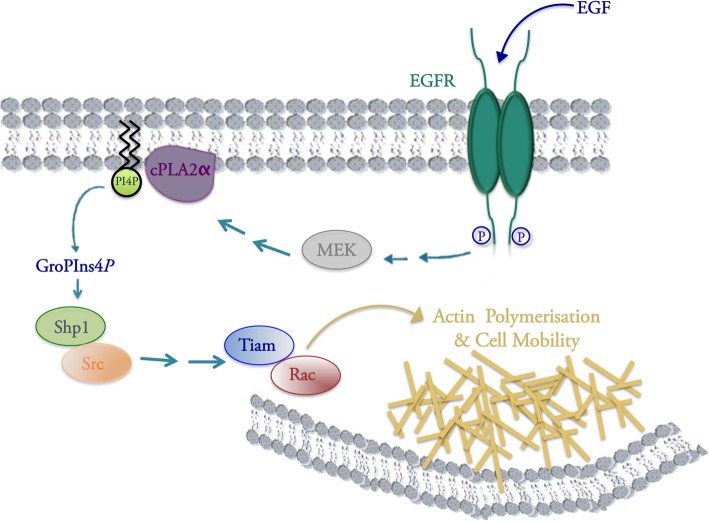
Results: We find that Shp1 is the direct cellular target of GroPIns4P. GroPIns4P directly binds to the Shp1-SH2 domain region (with the crucial residues being Ser 118, Arg 138 and Ser 140) and thereby promotes the association between Shp1 and Src, and the dephosphorylation of the Src-inhibitory phosphotyrosine in position 530, resulting in Src activation. As a consequence, fibroblast cells exposed to GroPIns4P show significantly enhanced wound healing capability, indicating that GroPIns4P has a stimulatory role to activate fibroblast migration. GroPIns4P is produced by cPLA2 upon stimulation by diverse receptors, including the EGF receptor. Indeed, endogenously-produced GroPIns4P was shown to mediate the EGF-induced cell motility.

Conclusions: This study identifies a so-far undescribed mechanism of Shp1/Src modulation that promotes cell motility and that is dependent on the cPLA2 metabolite GroPIns4P. We show that GroPIns4P is required for EGF-induced fibroblast migration and that it is part of a cPLA2/GroPIns4P/Shp1/Src cascade that might have broad implications for studies of immune-inflammatory response and cancer.

Keywords: Actin polymerisation; Cell motility; EGF; Glycerophosphoinositols; Membrane ruffles; Phosphoinositides; SH2 domain; Shp1.


Conflict of interest statement

Ethics approval and consent to participate

Not applicable.

Consent for publication

Not applicable.

Competing interests

The authors declare that they have no competing interests.

Publisher’s Note

Springer Nature remains neutral with regard to jurisdictional claims in published maps and institutional affiliations.

Figures

Fig. 1
Fig. 1
Direct binding of GroPIns4P to Shp1. a Representative pull-down of streptavidin-conjugated beads using Biotin or biotinylated GroPIns4P (GroPIns4P-Bio) with either Shp11–529 (His-Shp1), the N-terminal SH2-domain mutant (His-SH2 (N + C)) or the catalytic-domain mutant (His-PTPase) of Shp1. Unbound and eluted (beads) proteins were analysed by western blotting using an anti-Shp1 antibody. Molecular weights (kDa) are indicated on the left of each panel. b Schematic domain structure illustrating the amino acid sequences of the Shp1 mutants used in the pull-down. c Dose-response effect of GroPIns4P on Shp1 fluorescence emission (ΔF) at 332 nm (fluorescence emission spectra of Shp1 upon addition of the indicated μM concentrations of GroPIns4P are shown in supplementary Additional file 1 Figure S1). d Kinetic interaction parameters calculated by surface plasmon resonance (SPR) analysis. Binding of Shp1 on a GroPIns4P-Bio-functionalised chip was analysed SPR as a function of time and analysed using the Langmuir fit. e SPR competition assay. Sensorgram showing Shp1 (1.2 μM) binding to immobilised GroPIns4P-Bio in the absence and presence of increasing concentrations of GroPIns4P. The GroPIns4P concentrations are indicated below the panel. f Data from SPR competition assay (RU = resonance units). Data are representative of three independent experiments, each performed in triplicate
Fig. 2
Fig. 2
Identification of the Shp1-cSH2 domain residues involved in GroPIns4P binding. a, b Overlay of the 1H-15N Heteronuclear Single-Quantum Coherence (HSQC) spectra of the 15N-labeled cSH2 domain in the absence and presence of different amount of GroPIns4P. Protein alone (black) and in the presence of GroPIns4P at the ratios of 1:1 (blue), 1:2 (green), 1:3 (magenta), 1:4 (brown), 1:5 (red) are reported. c Normalised weighted average chemical shift differences (Δavmax) between the GroPIns4P-bound and free forms of the Shp1 cSH2 domain plotted against the residue number for the amide proton and nitrogen resonances. The horizontal bold line at 0.3 indicates the average value plus one standard deviation. d Chemical shift perturbation mapped onto the cSH2 structure of Shp1 (PDB code: 2B3O). The amino acid residues affected by GroPIns4P binding (Δavmax ≥ 0.3) are depicted in red. e Chemical structure of GroPIns4P. f Ribbon representation of the complex, in which the cSH2 domain is in blue and GroPIns4P in red. Residues involved in the interaction are presented as sticks and are labelled. g Close view of S118 and R138 of the cSH2 domain that interact with the phosphate group of GroPIns4P. h Close view of S140, S142 and K170 of the cSH2 domain that interact with the 4′-phosphate group of GroPIns4P. Similar experiments on the nSH2 domain of Shp1 were hampered by the poor stability of the isolated fragment. i Functional validation of the Shp1 S118A/R138E/S140A mutant. Dose-response effect of GroPIns4P on Shp1 S118A/R138E/S140A mutant fluorescence emission (ΔF) at 332 nm (fluorescence emission spectra of Shp1 upon addition of the indicated μM concentrations of GroPIns4P are shown in supplementary Additional file 1 Figure S3)
Fig. 3
Fig. 3
GroPIns4P induces Src dephosphorylation. a Representative western blots using anti-phosphotyrosine 530 in Src (pTyr530-Src), anti-phosphotyrosine 418 in Src (pTyr418-Src) and anti-phosphotyrosine 783 in PLCγ (pTyr783-PLCγ) specific antibodies in serum-starved NIH3T3 cells non-transfected or over-expressing the dominant negative Shp1-C455S mutant and treated with 50 μM GroPIns4P for the indicated times (see the top of the two panels). Total Src and total PLC were used as loading controls. Data are representative of three independent experiments. Molecular weight standards (kDa) are indicated on the left of each panel. b Representative immunoprecipitated Src fraction (IP: Src) from NIH3T3 cell lysates washed and incubated with purified recombinant Shp1 for 10 min at 37 °C in the absence (−) or presence (+) of 50 μM GroPIns4P (as indicated). The top panel shows western blots with an anti-phosphotyrosine antibody (pTyr530-Src) to reveal the specific phosphorylation of Tyr-530 in Src. The blot was then re-probed with an anti-Src antibody for immunoprecipitated proteins (bottom panel). Molecular weight standards (kDa) are indicated on the left of each panel. c Quantification of Src phosphorylation in samples treated with GroPIns4P (as in b) by the ImageJ analysis software. Data (GroPIns4P) are expressed as percentages of untreated sample (untreated) of the means (±SD) of three independent experiments, each of which was performed in duplicate (n = 6). **P < 0.02 (Student’s t-test)
Fig. 4
Fig. 4
GroPIns4P favours the association between Shp1 and Src. a, c, e Interaction between Src and Shp1 wild type (a, Shp WT), Shp1-C455S (c, Shp1-C455S) or Shp1-S118A/R138E/S140A mutant (e, Shp1-S118A/R138E/S140A) was examined by immunoprecipitation (IP) with an anti-Shp1 antibody in serum-starved NIH3T3 cells over-expressing Shp1 WT, Shp1-C455S or Shp1-S118A/R138E/S140A mutant untreated (−) or treated (+) with 50 μM GroPIns4P for 5 min (as indicated). The expression levels of Shp1 WT, Shp1-C455S, Shp1-S118A/R138E/S140A and Src, examined in total lysates (input) indicate comparable amounts of proteins. Molecular weight standards (kDa) are indicated on the right of each panel. b, d, f Quantification of co-immunoprecipitated Src with Shp1 WT (b), Shp1-C455S (d) or Shp1-S118A/R138E/S140A mutant (f) using ImageJ analysis software. Data (GroPIns4P) are expressed as percentages of untreated sample (untreated) and as the means (±SD) of at least three independent experiments (Shp1 WT n = 4; Shp1-C455S n = 4; Shp1-S118A/R138E/S140A n = 3). *P < 0.05 (Student’s t-test)
Fig. 5
Fig. 5
GroPIns4P promotes the association of Shp1 and Src within the lamellar region. a Representative confocal microscopy images of serum-starved NIH3T3 cells co-transfected with Shp1-CFP (green) and Src-YFP (red) for 24 h and then untreated (−) or treated with 50 μM GroPIns4P (GroPIns4P) for 5 min and subjected to Acceptor Photobleaching apFRET analysis. b Quantification of the FRET efficiency over the cells treated as in a. c Representative confocal microscopy images of serum-starved NIH3T3 cells co-transfected with Shp1-CFP (green) and Src-YFP (red) for 24 h and then treated with 50 μM GroPIns4P for 5 min before apFRET analysis. The dashed rectangle in the lamellar region (close to the plasma membrane) indicates where the FRET efficiency was analysed. d Representative colour-coded apFRET efficiency of the lamellar region (selected in a) where the colour-scale quantifies the degree of protein-protein interaction in each of the indicated regions of interest (ROIs 1 to 5, white circles; the FRET efficiency for each ROI is reported in the table on the right). Data are expressed as the means (±SD) (n = 15 cells/condition). ***P < 0.005 (Student’s t-test). Scale bars, 10 μm
Fig. 6
Fig. 6
Shp1 directly mediates the GroPIns4P-induced actin ruffle formation. a Representative confocal microscopy images of serum-starved NIH3T3 cells untreated (untreated) or treated with 50 μM of GroPIns4P for 5 min alone (GroPIns4P) or in presence of the Shp1 inhibitors TPI-1 (TPI-1 + GroPIns4P) or NSC-87877 (NSC-87877 + GroPIns4P). The cells were fixed and processed for immunofluorescence analysis with FITC-labelled phalloidin. Zoom 1, 2 and 3: higher magnification images of the membrane area. b Quantification of actin ruffle formation (as percentage of untreated cells) of cells treated as in a (see the Methods). c Representative confocal microscopy images of NIH3T3 cells untransfected or transfected with the Shp1-C455S mutant for 8 h, starved for 24 h and then untreated (untreated) or treated with 50 μM GroPIns4P (GroPIns4P) or 10 ng/ml PDGF (PDGF) for 5 min. The cells were fixed and stained with an anti-Shp1 antibody and FITC-labelled phalloidin. d Quantification of actin ruffle formation (as the percentage of untreated cells) of cells treated as above. e Quantification of actin ruffle formation (as the percentage of untreated cells) of cells transfected with Shp1-WT, Shp1-S118A/R138E/S140A and Shp1-S12A/R32E/S34A mutants for 8 h, starved for 24 h and then treated with 50 μM GroPIns4P for the indicated times. Data are expressed as the means (±SD) of at least three independent experiments. ***P < 0.001; **P < 0.02; *P < 0.05 (Student’s t-test) calculated for each treatment versus untreated samples (untrasfected). Scale bars, 10 μm
Fig. 7
Fig. 7
GroPIns4P binding to Shp1 facilitates and mediates EGF-induced wound closure in NIH3T3 cell monolayers. a Representative phase-contrast microscopy images after 6 h from scratching in serum-starved NIH3T3 cells untreated (untreated) or treated with 50 μM of GroPIns4P alone (a) or in presence of TPI-1 (b) or NSC-87877 Shp1 inhibitors (c), as indicated. d Quantification of wound healing as the percentage of the untreated control in cells treated as in a-c. e, f Cells without or with pre-incubation with the cPLA2α inhibitor, TPI-1, or NSC-87877 inhibitors (as indicated) were stimulated with 10 ng/ml EGF, 50 μM GroPIns4P or 10 μM arachidonic acid for 6 h. Quantifications of wound healing are presented as the percentage of the untreated controls. The differences between the untreated controls are not statistically significant. Data are expressed as the means (±SE) of at least three independent experiments. ***P < 0.001; **P < 0.02; *P < 0.05 (Student’s t-test) calculated for each treatment versus untreated samples (control). The cPLA2α inhibitor was used at 0.5 μM, but it was effective over a range of concentrations between 0.1 and 2 μM. Arachidonic acid was used at both 10 and 50 μM, with similar results
Fig. 8
Fig. 8
Schematic representation of the signalling cascade involved in the formation of GroPIns4P in NIH3T3 cells. In NIH3T3 cells, activation of the EGF receptor (EGFR) can lead to activation of cPLA2α through the involvement of MEK kinase. cPLA2α activation results in hydrolysis of PtdIns4P and release of GroPIns4P, which binds to Shp1 and promotes its association with Src. Once activated Src triggers a signalling cascade culminating with the formation of Tiam/Rac complex at the plasma membrane and consequent formation membrane ruffles with stimulation of cell motility. See text for details

Similar articles

Cited by

References

    1. Valitutti S, Cucchi P, Colletta G, Di Filippo C, Corda D. Transformation by the k-ras oncogene correlates with increases in phospholipase A2 activity, glycerophosphoinositol production and phosphoinositide synthesis in thyroid cells. Cell Signal. 1991;3:321–332. doi: 10.1016/0898-6568(91)90061-X. - DOI - PubMed
    1. Mariggio S, Sebastia J, Filippi BM, Iurisci C, Volonte C, Amadio S, De Falco V, Santoro M, Corda D. A novel pathway of cell growth regulation mediated by a PLA2alpha-derived phosphoinositide metabolite. The FASEB journal : official publication of the Federation of American Societies for Experimental Biology. 2006;20:2567–2569. doi: 10.1096/fj.05-5397fje. - DOI - PubMed
    1. Corda D, Falasca M. Glycerophosphoinositols as potential markers of ras-induced transformation and novel second messengers. Anticancer Res. 1996;16:1341–1350. - PubMed
    1. Falasca M, Marino M, Carvelli A, Iurisci C, Leoni S, Corda D. Changes in the levels of glycerophosphoinositols during differentiation of hepatic and neuronal cells. European journal of biochemistry / FEBS. 1996;241:386–392. doi: 10.1111/j.1432-1033.1996.00386.x. - DOI - PubMed
    1. Corda D, Iurisci C, Berrie CP. Biological activities and metabolism of the lysophosphoinositides and glycerophosphoinositols. Biochim Biophys Acta. 2002;1582:52–69. doi: 10.1016/S1388-1981(02)00137-3. - DOI - PubMed

Publication types