. 2019 Mar 13;25(3):418-431.e6.
doi: 10.1016/j.chom.2019.01.005. Epub 2019 Feb 26.

Hemizygosity Enables a Mutational Transition Governing Fungal Virulence and Commensalism

Affiliations

Hemizygosity Enables a Mutational Transition Governing Fungal Virulence and Commensalism

Shen-Huan Liang et al. Cell Host Microbe. .

Abstract

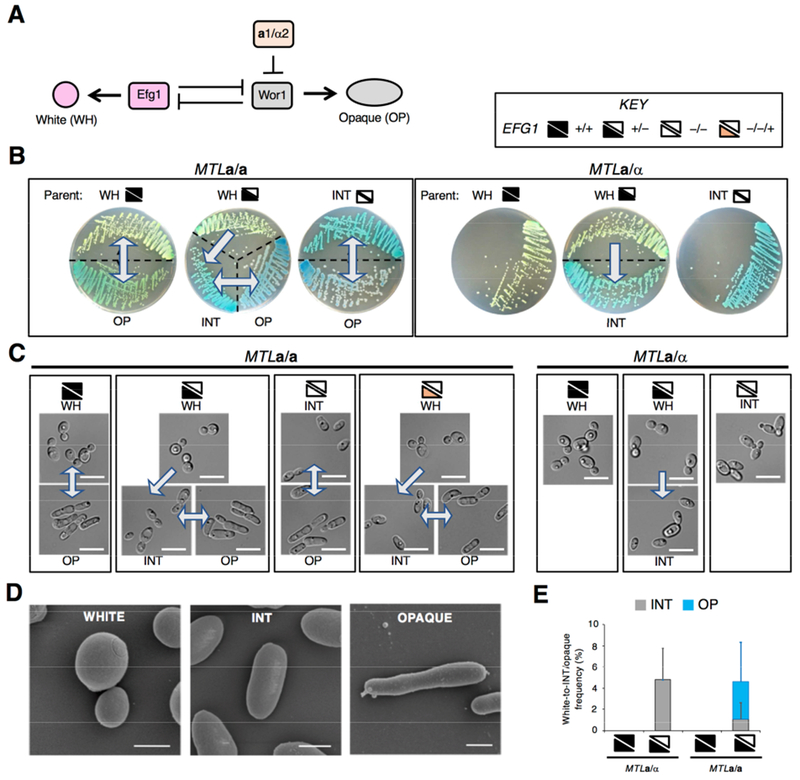
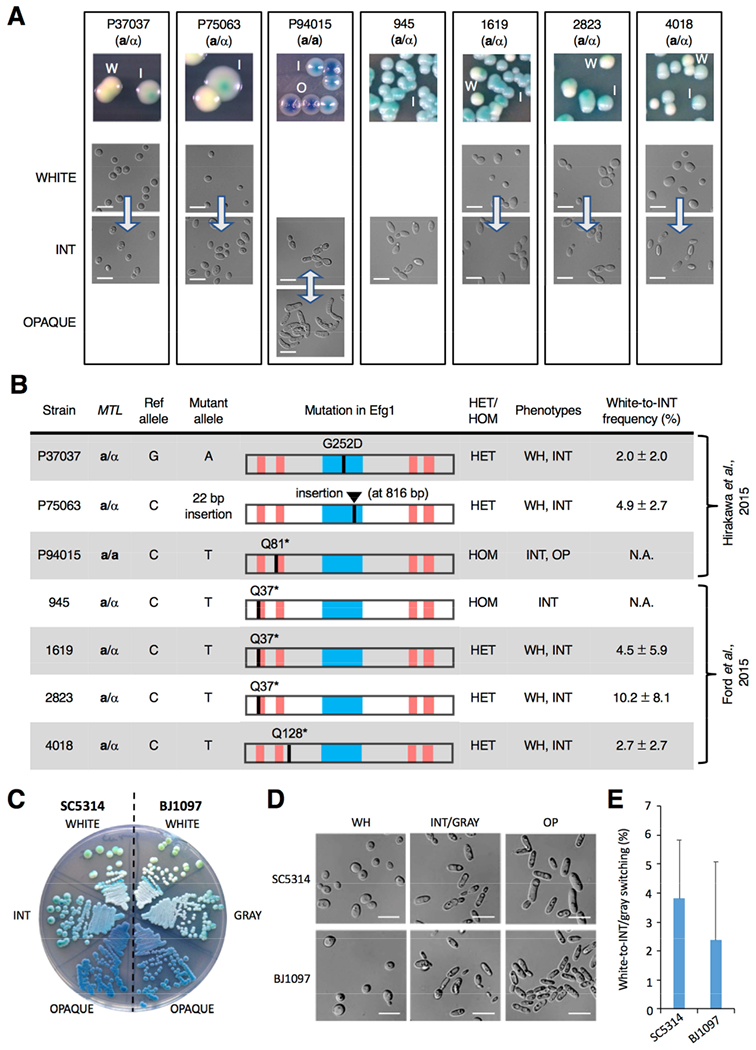
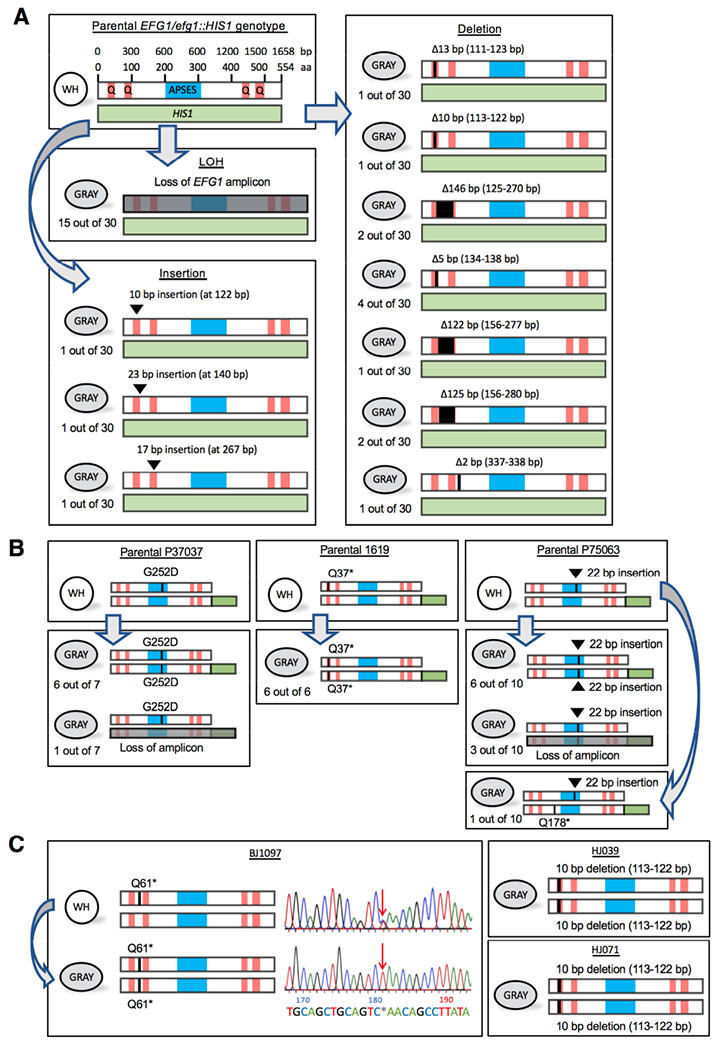
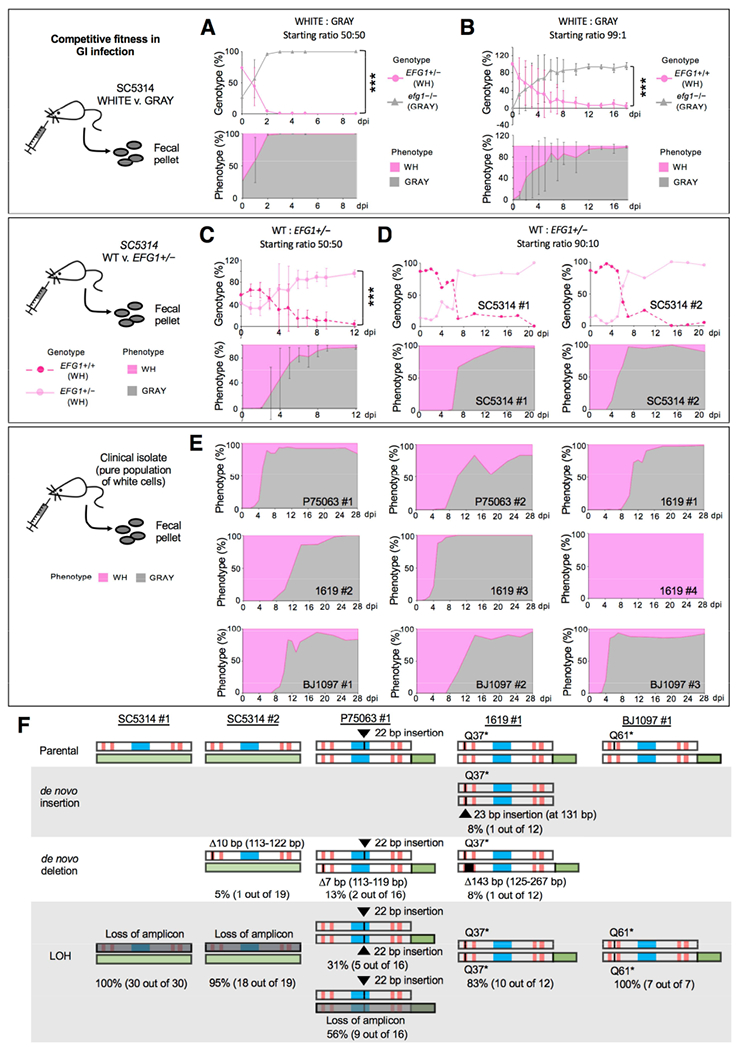
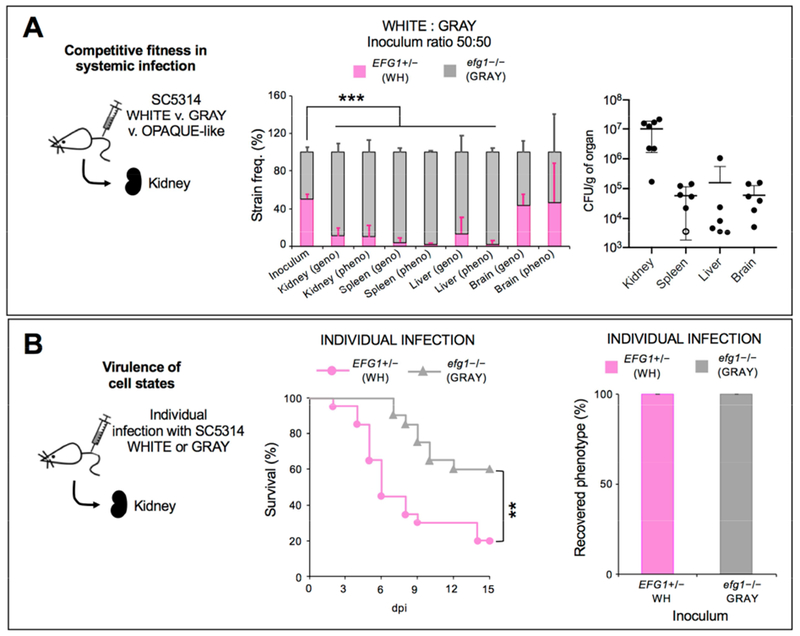
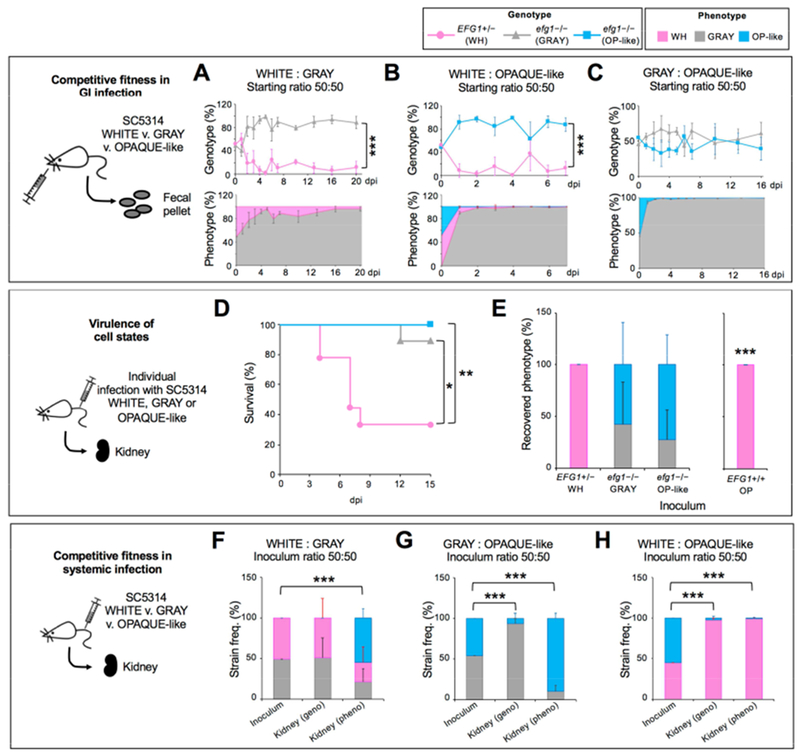
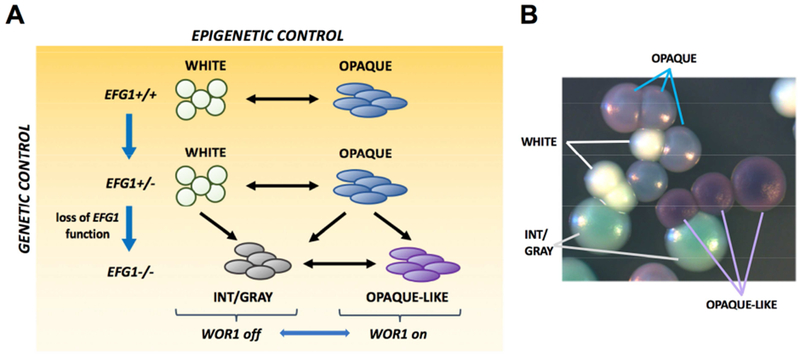
Candida albicans is a commensal fungus of human gastrointestinal and reproductive tracts, but also causes life-threatening systemic infections. The balance between colonization and pathogenesis is associated with phenotypic plasticity, with alternative cell states producing different outcomes in a mammalian host. Here, we reveal that gene dosage of a master transcription factor regulates cell differentiation in diploid C. albicans cells, as EFG1 hemizygous cells undergo a phenotypic transition inaccessible to "wild-type" cells with two functional EFG1 alleles. Notably, clinical isolates are often EFG1 hemizygous and thus licensed to undergo this transition. Phenotypic change corresponds to high-frequency loss of the functional EFG1 allele via de novo mutation or gene conversion events. This phenomenon also occurs during passaging in the gastrointestinal tract with the resulting cell type being hypercompetitive for commensal and systemic infections. A "two-hit" genetic model therefore underlies a key phenotypic transition in C. albicans that enables adaptation to host niches.

Keywords: Candida albicans; gastrointestinal tract; pathogenesis; phase variation; phenotypic switch; population genetics; transcription factor.


Conflict of interest statement

Declaration of Interests

The authors declare no competing interests.

Figures

Figure 1.
Figure 1.. EFG1 hemizygosity enables C. albicans cells to form an alternative cell state.
(A) White-opaque switching is regulated by Efg1 which promotes white cell formation and Wor1 which promotes opaque cell formation. MTLa1/α2 represses WOR1 and thus limits opaque formation by MTLa/α cells. (B) SC5314-derived strains grown on CHROMagar (for 3 days at 22°C) exhibit three cell states, white, intermediate (INT) and opaque. Arrows indicate unidirectional or bidirectional switching. Key indicates wildtype (+/+), heterozygous (+/−), and homozygous (−/−) EFG1 genotypes, as well as an efg1 null into which EFG1 was restored (−/−/+). (C) Microscopic images of cells from CHROMagar (3 days at 22°C). Scale bar, 10 μm. (D) Scanning electron micrographs of SC5314 white, INT and opaque cells. Scale bars, 2 μm. (E) Frequency of phenotypic switching on CHROMagar after 7 days at 22°C. Three independent experiments performed. Strains are SC5314 derivatives: MTLa/a EFG1+/+; RBY717, MTLa/a EFG1+/−; CAY6970. MTLa/a efg1−/−; CAY6977, MTLaEFG1+/+; SN87, MTLaEFG1+/−; CAY7064, MTLaefg1−/−; TF156, MTLa/a efg1−/−::EFG1; CAY6911. See also Figure S1.
Figure 2.
Figure 2.. Clinical isolates containing EFG1 polymorphisms form the ‘intermediate’ cell state.
(A) Images of colony and cell phenotypes on CHROMagar (W, white; I, intermediate (INT); O, opaque) at 22°C. Scale bar, 10 μm. Arrows indicate transitions between states. (B) Analysis of 63 clinical isolates revealed that 7 contained disruptive polymorphisms in EFG1. The APSES DNA-binding domain (blue box) and polyglutamine repeats (red bars) are shown. EFG1 mutations were heterozygous (HET) or homozygous (HOM), and cell states observed were white (WH), intermediate (INT) and opaque (OP). White-to-INT transition frequency was determined on YPD medium (22°C for 7 days) with three independent assays. (C) White/INT/opaque phenotypes in SC5314 (EFG1+/− parental strain) v. white/gray/opaque phenotypes in BJ1097. Cells were grown on CHROMagar at 22°C for 3 days. (D) White/INT/opaque phenotypes in SC5314 (EFG1+/− parental strain) v. white/gray/opaque phenotypes in BJ1097. Cells grown on YPD at 22°C for 3 days. (E) Comparison of white-to-INT and white-to-gray transition frequencies in SC5314 and BJ1097, respectively, on YPD after 7 days at 22°C. Error bars, ± SD. Three independent assays performed. See also Figure S2.
Figure 3.
Figure 3.. Genetic loss of EFG1 underlies the white-to-gray transition in vitro.
(A) Schematics show EFG1 mutations from white-to-gray switching. APSES, DNA binding domain. Q, polyglutamine tracts. The parental SC5314 strain is heterozygous for EFG1 (one allele replaced with HIS1) and mutational patterns are shown for 30 independent white-to-gray transitions. (B) Schematics depicting EFG1 mutations in three clinical strains (P37037, 1619, and P75063) upon switching to the gray state. The intact EFG1 allele was tagged with GFP (green box) in the parental strain. Independent switching events are shown. (C) Schematic of EFG1 mutations present in three clinical strains (BJ1097, HJ039, and HJ071) in which the gray state was first identified. For BJ1097, the chromatogram shows Sanger sequencing of EFG1 in white and gray cells. Arrow indicates a mutation (C181T) causing a premature stop codon (Q61*) that is heterozygous in white cells but homozygous in gray cells. See also Figure S4 and S5.
Figure 4.
Figure 4.. MTLa/α gray cells exhibit a fitness advantage over white cells in a commensal GI model.
(A) Competition between SC5314 white (EFG1+/−) and gray (efg1−/−) states in a GI model. Cell types were co-inoculated 50:50 and analyzed upon recovery from fecal pellets. NATR v. NATS analysis was used to define strain type (genotype) and colony color used to define the phenotype. Strains are CAY7768/7065. n=3 cohoused mice. Mean values with SD. ***, P<0.001 by t test. (B) Competition between SC5314 white (EFG1+/+) and gray (efg1−/−) cells inoculated in a 99:1 ratio (CAY8282 and 7769). n=3 mice housed separately. Mean values plotted with SD. ***, P<0.001 by t test. (C) A 50:50 competition between SC5314 EFG1+/+ and EFG1+/− cells (both in the white state) in the GI model (Strains CAY7770 and 7064). n=3 cohoused mice. Mean values with SD. ***, P<0.001 by t test. (D) A 90:10 competition between EFG1+/+ and EFG1+/− cells (strains CAY8282 and 7768). n=2 mice housed separately. (E) Strains P75073, 1619, and BJ1097 (naturally EFG1+/−) were evaluated for GI colonization. Cells were introduced in the white state and recovered from fecal pellets. Strains with GFP-tagged EFG1 (CAY9159/9165/9195) or wildtype isolates were used. n=9 independent experiments with mice housed separately. (F) Summary of EFG1 mutations arising during white-to-gray switching in the GI model. Genotypes examined by PCR and Sanger sequencing to determine mutations in EFG1. See also Figure S5.
Figure 5.
Figure 5.. Competitive fitness and virulence of MTLa/α white and gray cell states in disseminated infection.
(A) Competitive fitness of C. albicans cells in a disseminated infection model. A 50:50 mix of white EFG1+/− and gray efg1−/− cells were co-inoculated into the murine tail vein and recovered 7 dpi from the kidney, spleen, liver and brain. Two independent experiments were performed using EFG1+/− NATR versus efg1−/− NATS cells (CAY7768 versus 7065, n = 3 mice) and efg1−/− NATR versus EFG1+/− NATS cells (CAY7769 versus 7064, n = 4 mice). ‘Geno’ indicates colonies were identified using the SAT1 marker and ‘pheno’ indicates the colony phenotype. Open circle indicates sample was excluded from genotype/phenotype analysis due to low CFUs (<10 colonies recovered). ***, P<0.001 by t test. Error bars, SD. (B) Virulence and phenotypes of C. albicans in the disseminated infection model. Kaplan-Meier survival curves comparing the virulence of white and gray cells (CAY7064/7065). **, P <0.005 by log-rank test. n=20 mice each. Phenotypes of cells recovered from the kidney at 15 dpi (or when moribund). Error bars, SD.
Figure 6.
Figure 6.. Comparison of different MTLa/a cell states in infection.
(A) Competitive fitness of C. albicans MTLa/a cells in a disseminated infection model. A 50:50 mix of white EFG1+/− and gray efg1−/− cells were co-inoculated in the GI (CAY6970/7869). Cells analyzed from fecal pellets. n=3 mice. ***, P<0.001 by t test. (B) A 50:50 mix of white EFG1+/− and opaque-like efg1−/− cells were co-inoculated in the GI (CAY6970/7868) and cells analyzed from fecal pellets. n=4 mice. ***, P<0.001 by t test. (C) A 50:50 mix of gray efg1−/− and opaque-like efg1−/− cells were co-inoculated in the GI (CAY7022/7868) and cells analyzed from fecal pellets. n=3 mice. ***, P<0.001 by t test. (D) Kaplan-Meier survival curves comparing white, gray and opaque-like cells (CAY6970/7022/7023). *, P <0.05 and **, P <0.005 by log-rank test. n=9 mice each. (E) Phenotypes of cells recovered from the kidney at 15 dpi (or when moribund) for EFG1+/− and efg1−/− strains and 3 dpi for EFG1+/+ isolate. n=7 mice for EFG1+/− and efg1−/− strains and n=4 mice for the EFG1+/+ isolate. Error bars, SD. ***, P<0.001 by t test compared to the inoculum. (F) Competitive fitness of C. albicans cells in a disseminated model. A 50:50 mix of white EFG1+/− and gray efg1−/− cells (CAY6970/7869) were co-inoculated in the tail vein and recovered 7 dpi from the kidney. n=4 mice. ***, P<0.001 by t test. (G) A 50:50 mix of gray efg1−/− and opaque-like efg1−/− cells (CAY7022/7868) were co-inoculated in the tail vein and recovered 7 dpi from the kidney. n=3 mice. ***, P<0.001 by t test. (H) A 50:50 mix of white EFG1+/− and opaque-like efg1−/− cells (CAY6970/7868) were co-inoculated into the tail vein and recovered 7 dpi from the kidney. n=5 mice. ***, P<0.001 by t test.
Figure 7.
Figure 7.. Genetic and epigenetic mechanisms act together to generate phenotypic heterogeneity in C. albicans.
(A) Epigenetic switching occurs between white and opaque states. EFG1 is essential for the white state and mutational loss of this gene causes white cells to adopt the gray state. efg1 null cells can still undergo epigenetic switching between gray and opaque-like states. Both opaque and opaque-like states require WOR1 expression. C. albicans therefore uses both genetic and epigenetic mechanisms to adopt different cell states, with EFG1 playing a central role in both mechanisms. (B) Four alternative cell states are distinguishable on CHROMagar medium. See also Figure S7.

Similar articles

Cited by

References

    1. Ackermann M (2015). A functional perspective on phenotypic heterogeneity in microorganisms. Nat. Rev. Microbiol 13, 497–508. - PubMed
    1. Anders S, Pyl PT, and Huber W (2015). HTSeq--a Python framework to work with high-throughput sequencing data. Bioinformatics 31, 166–169. - PMC - PubMed
    1. Bendel CM, Hess DJ, Garni RM, Henry-Stanley M, and Wells CL (2003). Comparative virulence of Candida albicans yeast and filamentous forms in orally and intravenously inoculated mice. Critical Care Med. 31, 501–507. - PubMed
    1. Bennett RJ, Forche A, and Berman J (2014). Rapid mechanisms for generating genome diversity: whole ploidy shifts, aneuploidy, and loss of heterozygosity. Cold Spring Harb. Perspect. Med 4, a019604. - PMC - PubMed
    1. Bennett RJ, and Johnson AD (2006). The role of nutrient regulation and the Gpa2 protein in the mating pheromone response of C. albicans. Mol. Microbiol 62, 100–119. - PubMed

Publication types