. 2019 Mar 1;4(33):eaaw1941.
doi: 10.1126/sciimmunol.aaw1941.

Tissue clonality of dendritic cell subsets and emergency DCpoiesis revealed by multicolor fate mapping of DC progenitors

Affiliations

Tissue clonality of dendritic cell subsets and emergency DCpoiesis revealed by multicolor fate mapping of DC progenitors

Mar Cabeza-Cabrerizo et al. Sci Immunol. .

Abstract

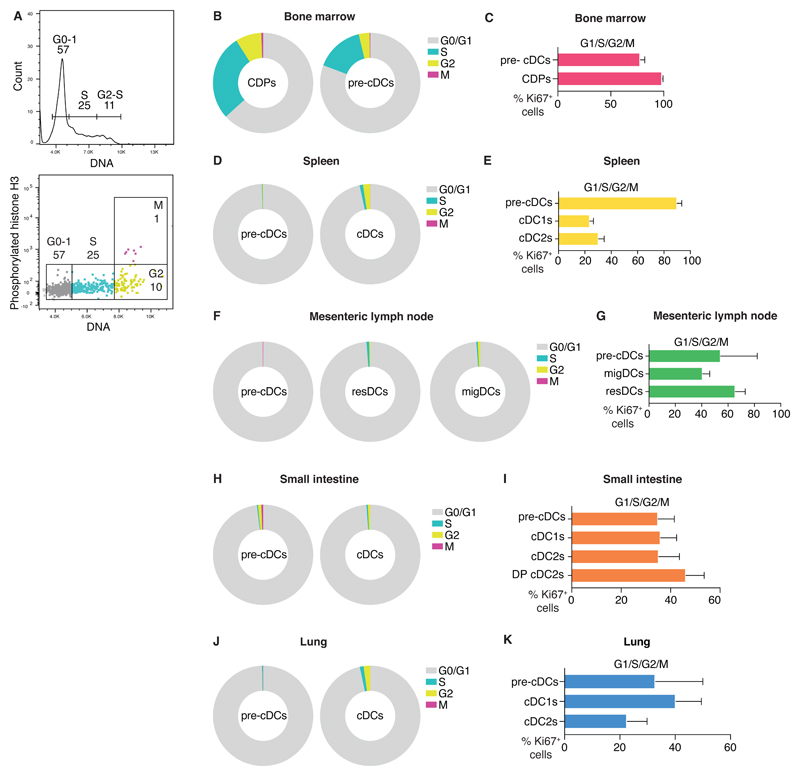
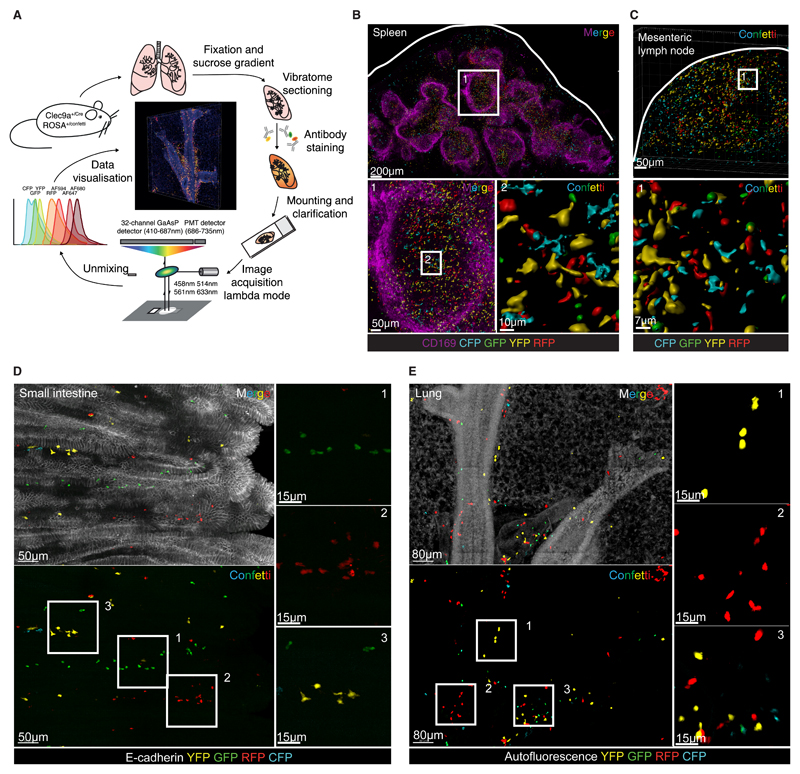
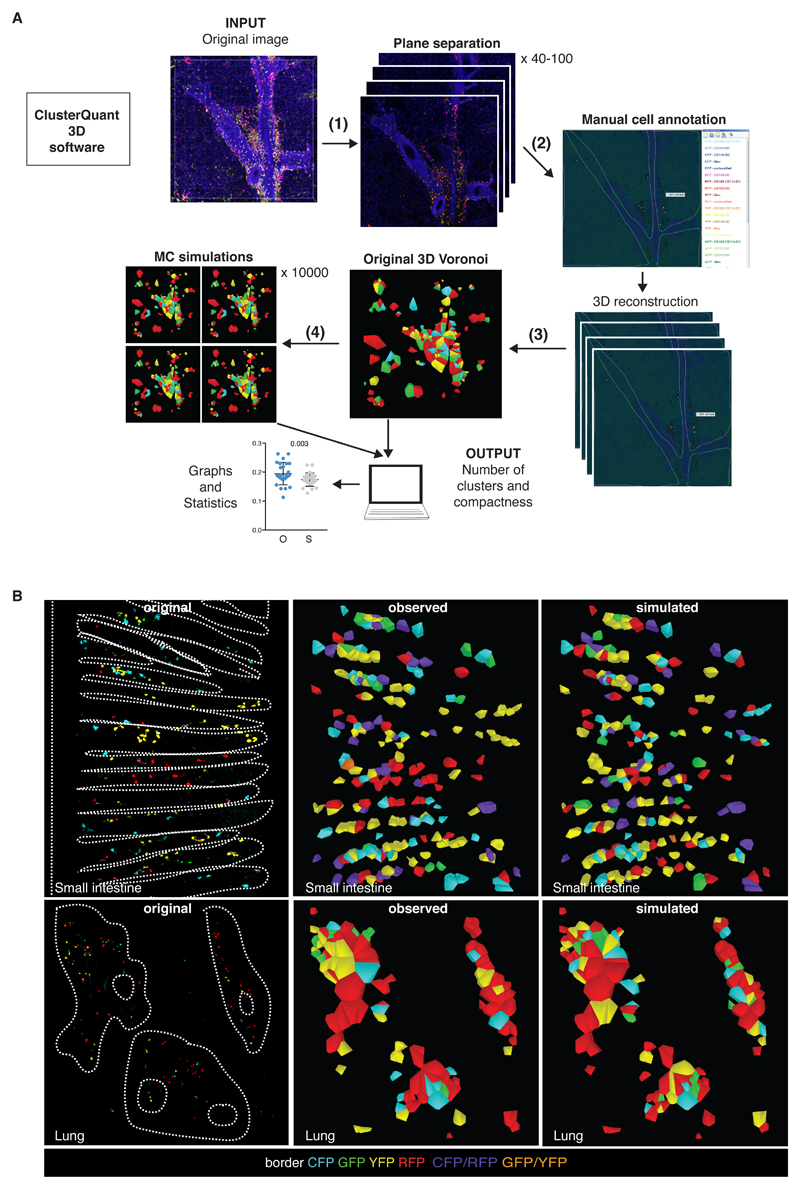
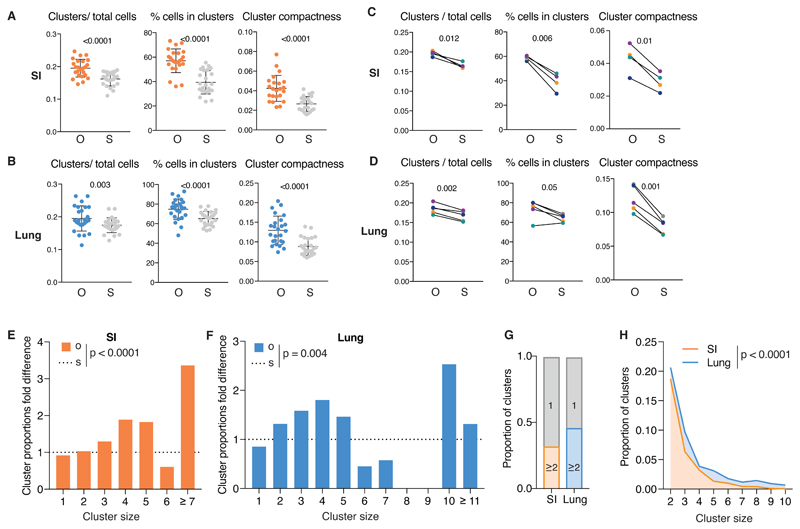
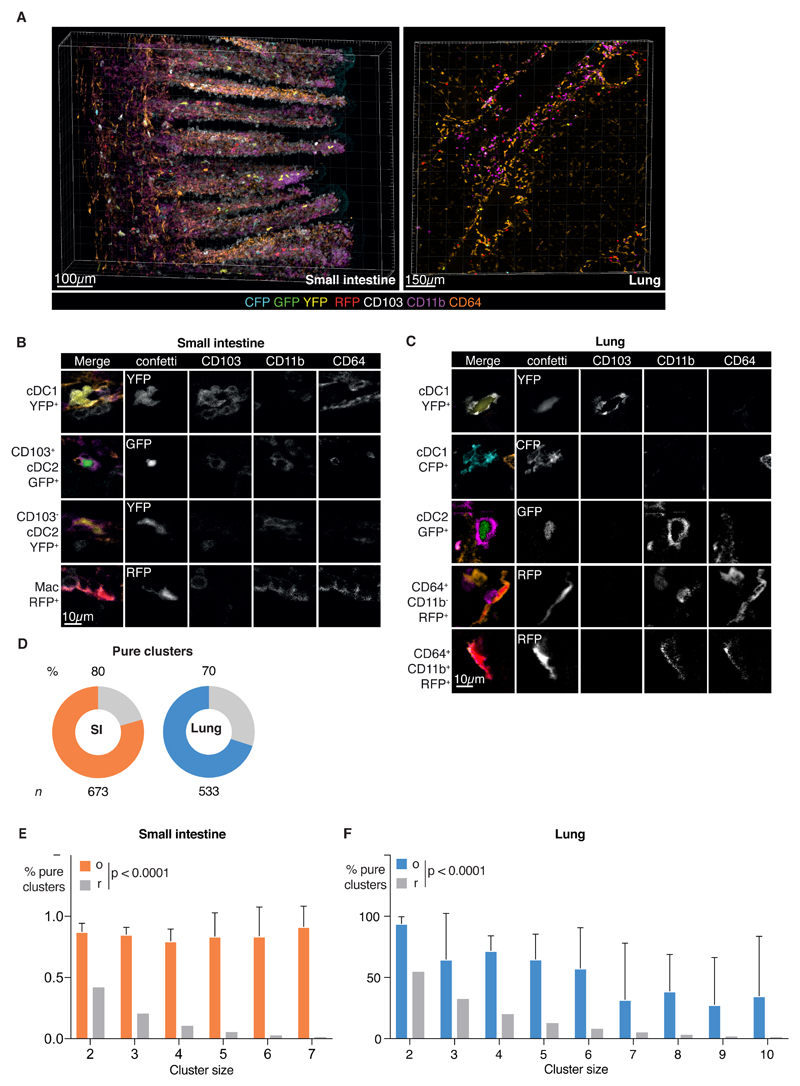
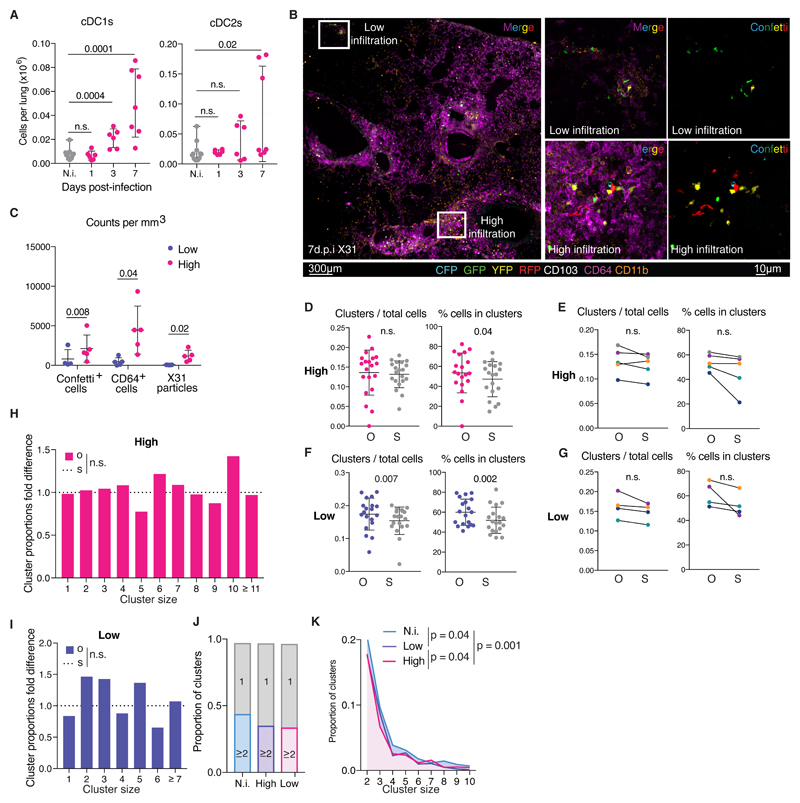
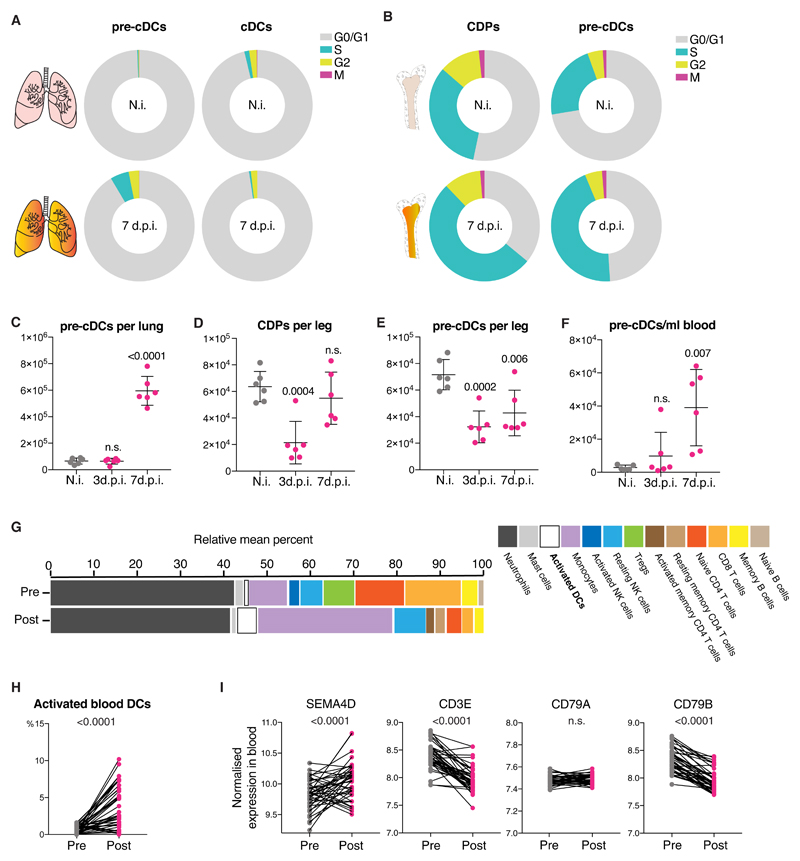
Conventional dendritic cells (cDCs) are found in all tissues and play a key role in immune surveillance. They comprise two major subsets, cDC1 and cDC2, both derived from circulating precursors of cDCs (pre-cDCs), which exited the bone marrow. We show that, in the steady-state mouse, pre-cDCs entering tissues proliferate to give rise to differentiated cDCs, which themselves have residual proliferative capacity. We use multicolor fate mapping of cDC progenitors to show that this results in clones of sister cDCs, most of which comprise a single cDC1 or cDC2 subtype, suggestive of pre-cDC commitment. Upon infection, a surge in the influx of pre-cDCs into the affected tissue dilutes clones and increases cDC numbers. Our results indicate that tissue cDCs can be organized in a patchwork of closely positioned sister cells of the same subset whose coexistence is perturbed by local infection, when the bone marrow provides additional pre-cDCs to meet increased tissue demand.


Conflict of interest statement

The authors declare that they have no competing interests.

Figures

Fig. 1
Fig. 1. Pre-cDCs and cDCs actively cycle in lymphoid and non-lymphoid organs.
(A) DNA content histogram (top) or dot plot with DNA content and phospho-H3 (bottom) of BM CDPs from one mouse as a representative example of cell cycle analysis. (B, D, F, H, J) Percentage of cells in G0/G1, S, G2 or M phases of the cell cycle determined as in (A) in the BM (B), spleen (D), mesenteric lymph node (F), SI (H) and lung (J). (C, E, G, I, K) Percentage of Ki67+ cells in in the BM (C), spleen (E), mesenteric lymph node (G), SI (I) and lung (K). Data in (B, D, F, H, J) are mean values from 6 C57BL/6 mice. Data in (C, E, G, I, K) are compiled from 12 C57BL/6 mice analyzed in 2 independent experiments. Error bars correspond to variation across mice using SD. Cells are gated as indicated in Materials and Methods.
Fig 2
Fig 2. Spectral imaging of organs from Clec9aConfetti reveals the presence of single-color cDC clusters.
(A) Workflow of tissue processing, staining and imaging of Clec9aConfetti mouse organs. (B) 3D projection of a 300µm spleen section stained with anti-CD169. Confetti surfaces were generated with Imaris software to reduce autofluorescence. Zooming into T cell areas (1) was used to visualize Confetti+ cDCs (2). (C) 3D projection of a mesenteric lymph node with surfaces as in B. Square depicts selected zoom in area displayed at the bottom. (D) 3D projection of a 300µm vibratome section of the SI from a Clec9aConfetti mouse stained for E-cadherin to delineate the epithelium. (E) 3D projection of a 300µm vibratome section of the lung from a Clec9aConfetti mouse. Autofluorescence channel is displayed to visualize the lung structure.
Fig 3
Fig 3. Analysis of single-color cDC clusters using ClusterQuant 3D.
(A) Workflow of plane separation (1), cell annotation (2), 3D Voronoi generation (3) randomisation (4) and analysis using ClusterQuant 3D. (B) Original images from the SI (top) and the lung (bottom) were annotated using ClusterQuant 3D software and converted to Voronoi polyhedrons (middle), which were then randomized through a Monte Carlo simulation (right). CD64 staining was used to exclude CD64+ cells from the analysis. Dashed lines indicate the structure of the SI (villi) or lung (airways), determined from CD11b staining or autofluorescence channel, respectively. Colors represent the different Confetti fluorescent proteins. Note the scarcity of double labelled cells, especially in lung.
Fig 4
Fig 4. SI and lung cDCs are organized in spatially-restricted clusters of sister cells
(A) From left to right: number of clusters of 2 or more cells normalised to number of cells, percentage of number of cells in clusters and cluster compactness from 24 images of SI from 4 mice. Each point represents one image; observed (O), orange, compared to simulations (S), grey. (B) As in (A) from 25 lung images from 5 mice. (C) Data from (A) grouped per mouse. Lines link the observed and simulated scenarios associated with each mouse. Colors correspond to individual mice (observed (O) and simulation (S)). (D) Data from B grouped per mouse as for C. (E-F) Proportion of clusters of the indicated size in observed scenario (O, orange) normalised to the simulated scenario (S, dashed line). Data are from SI (E) or lung (F) of a representative mouse. Other mice are shown in Fig. S4. (G) Proportion of all clusters analysed of size 1 (grey) or ≥2 in SI (orange) or lung (blue).. (H) Comparison of proportion of clusters of size 2 to 10 in the SI (orange) and in the lung (blue). In all cases, CD64 staining was used to exclude CD64+ cells from the analysis.. Statistical analysis in (B-E) used a paired t-test and in (F-G) used a chi-squared test.
Fig 5
Fig 5. Single-color cDC clusters are predominantly composed of a single cDC subset.
(A) 3D projection of a Clec9Confetti image of SI (left) or lung (right) stained for CD103, CD11b and CD64. (B-C) Single z optical slices depicting individual cells from the SI (B) or lung (C) of Clec9Confetti mice; individual channels are shown on the right side of the merged image. (D) Pie charts representing percentage of pure clusters in SI (orange, 80%) or lung (blue, 70%) analyzed. Grey bar indicates mixed clusters. Data are pooled from all images and n indicates number of clusters analyzed. (E-F) Analysis of the proportion of pure clusters of cluster size 2 to 7 found in the SI (E, orange) or lung (F, blue) (o) vs the expected null distribution assuming random mixing (r, grey). Data are pooled from all images. Error bars correspond to variation across mice using SD. Statistical analysis was carried out using a Fishers exact test.
Fig 6
Fig 6. Influenza A virus infection dilutes single-color cDC clustering
(A) Number of cDC1s (left) or cDC2s (right) in lungs of Clec9aeYFP mice infected with influenza A virus (magenta) or non-infected (N.i., grey). (B) 3D projection of a Clec9Confetti lung section 7 dpi with Influenza A virus. (C) Quantification of Confetti+ cells, CD64+ cells and X31 particles from images with high (magenta) and low (purple) infiltration of cells. (D) Number of clusters of 2 or more cells normalised to number of cells and percentage of cells in clusters from 20 high infiltrated lung images from 5 mice. Each point represents one image; observed (O), magenta, compared to simulations (S), grey. (E) Data in D grouped per mouse. Lines link the observed and simulated scenarios associated with each mouse. Colors correspond to individual mice (observed (O) and simulations (S)). (F) Data as in D from 19 low infiltrated lung images from 4 mice. (G) Data in F grouped per mouse. (H-I) Proportion of clusters of the indicated size in original (O) normalised to the simulated (S, dashed line) scenario from the high (H) or low (I) infiltrated areas of a representative mouse. (J) Proportion of clusters of size 1 (grey) or ≥2 in non-infected lungs (N.i., blue) vs. high (magenta) and low (purple) infiltrated areas from lungs of infected mice. (K). Comparison of proportion of clusters of size 2-10 in non-infected lungs (N.i., blue, Fig.2), and high (magenta) and low (purple) infiltrated areas in the lungs of infected mice. Data correspond to the pool of all mice analyzed. Statistical analysis in (A) used an unpaired t-test in 2 independent experiments with 3mice/group, (C-G) paired t-test and in (H-K) used a chi-squared test.
Fig 7
Fig 7. Influenza A virus infection increases lung cDC numbers by recruiting BM progenitors.
(A-B) Percentage of lung (A) and BM (B) pre-cDCs and cDCs in G0/G1, S, G2 or M phases of the cell cycle determined as in Fig 1. Data are mean values from 6 non-infected (top) or 6 C57BL/6 mice 7 dpi with influenza virus (bottom). (C-F) Numbers of BM CDPs (D) or pre-cDCs in lung (C), BM (E) or blood (F) in non-infected (grey), or influenza A virus-infected C57BL/6 mice (magenta) at 3dpi or 7dpi. Each dot represents one mouse of 6 per group from one representative experiment. (G) Relative mean percentage of cells from peripheral blood of 41 patients pre and post natural infection with influenza A virus obtained from microarray data using CIBERSORT. (H) Percentage of activated blood DCs in individual patients from G. (I) Expression of SEMA4D, CD3E, CD79A and CD79B in peripheral blood from patients before (pre, grey) or in the first 48h of symptoms after natural infection with influenza A virus virus (post, magenta). Statistical analysis in C-F was based on an unpaired t test in a single experiment with 6 mice/group. Statistics in H, I employed a paired t-test.

References

    1. Merad M, Sathe P, Helft J, Miller J, Mortha A. The Dendritic Cell Lineage: Ontogeny and Function of Dendritic Cells and Their Subsets in the Steady State and the Inflamed Setting. Annu Rev Immunol. 2013;31:563–604. - PMC - PubMed
    1. Guilliams M, Ginhoux F, Jakubzick C, Naik SH, Onai N, Schraml BU, Segura E, Tussiwand R, Yona S. Dendritic cells, monocytes and macrophages: a unified nomenclature based on ontogeny. Nat Rev Immunol. 2014;14:571–578. - PMC - PubMed
    1. Naik SH, Metcalf D, van Nieuwenhuijze A, Wicks I, Wu L, O'Keeffe M, Shortman K. Intrasplenic steady-state dendritic cell precursors that are distinct from monocytes. Nat Immunol. 2006;7:663–671. - PubMed
    1. Onai N, Obata-Onai A, Schmid MA, Ohteki T, Jarrossay D, Manz MG. Identification of clonogenic common Flt3+M-CSFR+ plasmacytoid and conventional dendritic cell progenitors in mouse bone marrow. Nat Immunol. 2007;8:1207–1216. - PubMed
    1. Ginhoux F, Liu K, Helft J, Bogunovic M, Greter M, Hashimoto D, Price J, Yin N, Bromberg J, Lira SA, Stanley ER, et al. The origin and development of nonlymphoid tissue CD103+ DCs. Journal of Experimental Medicine. 2009;206:3115–3130. - PMC - PubMed

Publication types